Effect of dosing aid size and consumer age on detergent dosage and discrepancies between perceived and measured laundry load in household washing
-
Tobias Kimmel
Tobias Kimmel is a Professor of Cleaning Technology at the University of Applied Sciences Niederrhein, Krefeld, since 2012. He previously worked at Miele & Cie. KG, Gütersloh (2005–2012), focusing on washing process design and the development of detergents and dosing systems. From 2000 to 2005, he was a scientific assistant at TU Berlin, where he completed his PhD in 2004 on microemulsions and reaction kinetics. His research interests include cleaning processes, detergents, and dosing technology.
 ,
Kevin Pauels
,
Kevin Pauels

Abstract
A laboratory study of 97 participants, designed to simulate home laundry conditions, was conducted to investigate the effect of dosing aid size on detergent usage. Each participant used two differently sized dosing aids when dosing their usual detergent. Participants used an average of 75.7 ml of detergent across both dosing aid conditions, which was approximately 15 % below the recommended amount. On average, the amount dosed with the large dosing aid was 16 % higher than with the small one, corresponding to a mean difference of 11.1 ml. This relative increase was more pronounced among younger users (18–29 years), who dosed 23 % more with the large aid compared to the small one, while older participants showed an increase of only 12 %. Surprisingly, even when instructed to load 7 kg-capacity machines, participants loaded on average only (3.4 ± 0.9) kg in a cotton program. This confirms earlier findings that perceived fullness often diverges from technical capacity. Since dosing aids are no longer included with most detergent packages, the findings highlight the continued relevance of dosing tools and the persistent mismatch between consumer behavior and manufacturer recommendations.
1 Introduction
Laundry processes account for a considerable share of household energy and resource use. In Germany, an average of (5.0 ± 2.0) kg of laundry is washed per person per week, 1 resulting in an annual laundry volume of approximately 22 million tons. 2 In the UK, laundry accounted for around 12 % of total household energy use in 2012. 3 More recent assessments, such as the EU Preparatory Study (2017), report comparable orders of magnitude for electricity consumption by washing machines in European households. 4
Given this relevance, the environmental impact of laundry has become a target of various interventions. Studies show that a substantial part of the life cycle footprint of garments arises during the use phase, particularly washing. 5 , 6 Consumer behavior, including temperature choice and detergent dosing, plays a major role.
In response, the EU introduced regulatory measures such as energy labeling for washing machines (EU Regulation No. 2019/2014), leading to reduced energy use in standardized programs. At the same time, detergent manufacturers introduced products for low-temperature use and compact detergents. 7
Industry campaigns have also promoted low-temperature washing practices. 8 In parallel, dosing aids have increasingly been removed possibly due to consumer feedback. 9
The removal of product-specific dosing aids means that consumers often use dosing aids not tailored to the detergent. This can lead to over- or underdosing, depending on the available tool and the interpretation of dosage instructions. Even small deviations can accumulate into substantial environmental impacts. In 2021, for example, 540,000 tons of laundry detergent were used in Germany. 10 While most ingredients are biodegradable, approximately 6 % are not readily degradable and may enter water bodies after wastewater treatment, e.g. functional polymers. 10 , 11
While overdosing poses environmental risks due to excessive use of surfactants and poorly degradable additives, underdosing may also have negative consequences. From a practical perspective, underdosing may lead to greying and stiffness of fabrics over time, particularly due to incrustation in hard water conditions. These effects can reduce the perceived cleanliness and softness of laundry and may shorten textile lifespan.
Despite the environmental and behavioral relevance, empirical studies on domestic laundry practices remain limited. 12 One of the few widely cited sources is the study by Kruschwitz, 1 which, despite being more than 10 years old, was still referenced 14 times in 2024.
While consumer awareness, washing machine capacities, and detergent formulations have evolved, little is known about actual dosing behavior under current conditions. The most recent major studies on domestic laundry practices in Germany date back more than a decade. Furthermore, the influence of dosing aid size on detergent use in machine washing has not yet been systematically studied. This study addresses both aspects: current laundry routines and the impact of dosing aid volume on dosage behavior.
2 Theoretical background and research question
2.1 Detergents and dosing
Heavy-duty detergents are the most widely used type of laundry detergent in Germany, particularly for white and durable fabrics. In 2021, 86 % of surveyed consumers reported using heavy-duty detergents at least several times per month. 13 These products are most commonly applied in the cotton program, which accounts for approximately 75 % of wash cycles. 1 Powdered formulations, often chosen for white laundry, contain bleaching agents that are only stable in dry form and provide a disinfecting effect in addition to surfactant-based cleaning. Given their widespread use and functional properties, powdered heavy-duty detergents for white laundry were selected for this study.
Recommended dosage amounts for powder detergents in Europe have declined in recent years, from around 85 ml in 2012 to 65 ml in 2019. 14 At the same time, several dosage-relevant parameters have changed. In some regions, such as Krefeld, water hardness has decreased due to centralized softening by water utilities, which in turn reduces the amount of detergent required. 15 In a 2014 study, 65 % of participants in Germany correctly assessed their regional water hardness. 1 Conversely, the maximum load size for washing machines has increased, which consequently also affects the quantity of the dosage. 16
In a study in Finland, 299 participants were interviewed in a simulated laundry situation in the laundry room at home in 2005. 17 For machines with a rated capacity of 5 kg or more, similar to those used in the present study, the average dosage was 99 % of the recommended amount. Overdosing occurred mainly in machines with a rated capacity between 3 kg and 5 kg, with a mean dosage of 127 %.
However, 62 % of the participants were between 18 and 29 years old, and the results were not stratified by age group. This limits the interpretation of potential age-related effects. The present study addressed this by using an age-balanced sample with predefined age group quotas.
In practice, detergent dosage is determined based on the manufacturer’s recommendations and is typically linked to a defined “normal load”. According to Detergents Regulation (EC) No. 648/2004, this corresponds to 4.5 kg of dry laundry for heavy-duty detergents. However, modern household machines are marketed with higher capacities, ranging from six to over 9 kg, and in some cases up to 20 kg. While consumers may load less than the rated capacity, the mismatch between machine size and dosage instructions creates ambiguity in real-world usage.
Most detergent packages offer adjusted recommendations for “half loads” and “maxi loads,” typically suggesting modifications of ± (20–50) ml (see Table 1 for an example). However, definitions of these load categories are rarely provided. Based on regulatory definitions and likely consumer perception, the two threshold values of 2.25 kg and 3.00 kg are considered reasonable interpretations of a “half load”.
Example of a dosage table for powdered heavy-duty detergent (values in ml). The recommended dose for a normal 4.5 kg load with medium water hardness and normal soiling is highlighted in bold. For other detergents, values will differ.
| Water hardness | Light soiling | Normal soiling | Heavy soiling | |
|---|---|---|---|---|
| Soft | 45 ml | 65 ml | 105 ml | Adjustment |
| Medium | 45 ml | 85 ml | 130 ml | Half load: –20 ml |
| Hard | 65 ml | 105 ml | 150 ml | Maxi (6–8 kg): +50 ml |
To operationalize the concept of a “half load” in the analysis, this study applied two threshold values (2.25 kg and 3.00 kg), as mentioned above. The consumer must consider soiling level, water hardness, and load size when interpreting dosage instructions. However, many packaging designs assume prior knowledge of these factors, and terms like “half load” remain undefined. In the present study, the recommended dosage was calculated based on the measured machine load and scenario parameters (medium hardness, normal soiling). Nonetheless, many consumers estimate detergent amounts without precise measurement, which increases the likelihood of dosing errors.
2.2 Research question
This study addresses the following main research question:
How does the size of a dosing aid influence the amount of detergent dispensed by consumers under realistic conditions?
An additional question examined was:
Does consumer age affect dosage behavior and its sensitivity to the size of the dosing aid?
To answer these questions, participants were asked to dose a powdered heavy-duty detergent under standardized but home-like test conditions, using one of two differently sized dosing aids commonly found in households. Both the relative difference between the amounts dosed with the small and large aid, and the absolute deviation from a product-specific reference dosage, were assessed.
The reference dosage was calculated individually for each participant, based on fixed washing parameters (medium water hardness, normal soil level) and the actual laundry load, which was measured directly during the test.
Additional parameters, such as subjective load estimation, washing frequency, and previous use of dosing aids, were recorded for descriptive purposes and may support future exploratory analyses.
To support natural behavior and dosing routines, the test environment was specifically designed to resemble typical household conditions: participants used the same powdered detergent they normally used at home and were provided with a pre-sorted laundry pile that they could freely rearrange according to their usual habits. Further methodological details are provided in the following section.
3 Experimental
3.1 Study design and participants
This study was conducted as a standardized laboratory simulation of a domestic laundry situation in order to be able to record the dosed quantities unnoticed with high accuracy. Participants were asked to perform a dosing task using one of two differently sized dosing aids and their familiar detergent. The test environment was designed to reflect everyday decision-making as closely as possible, allowing participants to follow their usual routines during laundry preparation and dosing. In addition to the laboratory procedures, participants completed a brief online questionnaire prior to the test session and took part in a short interview afterwards. These additional components were intended to capture background data and contextual insights related to washing and dosing behavior.
A total of 97 participants took part in the study from November 24, 2022, to February 1, 2023. Due to ongoing uncertainties related to potential COVID-19 restrictions, recruitment was limited to the local region to avoid complications from possible travel limitations in the event of a renewed outbreak. Recruitment was carried out by distributing invitation letters to households in the university’s neighborhood, displaying posters on campus and newsletters to reach both administrative staff and students. All participants had prior experience with machine-based laundry. To enable the planned age-based analysis, participants were assigned to one of three predefined age groups using quota sampling: 18–29 years, 30–49 years, and 50 years and older.
3.2 Materials and equipment
The detergent used in this study was a commercially available powdered heavy-duty detergent for white laundry. Each participant was provided with the same product they reported using at home, ensuring familiarity with the detergent.
All detergent dosing was performed using either a small (70 ml) or a large (130 ml) transparent dosing aid. Additional equipment (e.g., baskets, containers) reflected typical household items to support realistic handling. Each participant had access to a 20 kg pile of previously used and washed cotton laundry (bed linen, tea towels, and towels) without visible stains, representing moderate soiling.
Seven front-loading washing machines were used in the study. The first two machines (no. 1 and 2), both Miele Softtronic W 1935 WTL models with a rated capacity of 7 kg, were loaded by participants. Machines 3 to 7, from different manufacturers, were not loaded during the session and had rated capacities between 5 kg and 9 kg. Machines 3 and 5 were placed 31 cm higher to simulate ergonomic variation.
Illustrative images of the dosing aids and additional information about the washing machines are provided in the Supplementary Material.
3.3 Test procedure
Each participant completed the test individually in a controlled laboratory environment and had no contact with other participants. This ensured that dosing decisions were made independently, without group influence.
All participants began with washing machine one and then proceeded to machine 2. In both identical machines, they were instructed to load laundry, select the 40 °C cotton program, and dose detergent as they would at home. Participants were informed that the textiles had been used for one to two weeks. They were allowed to rearrange the laundry pile according to their usual sorting preferences.
Water hardness was not explicitly communicated, as participants were instructed to dose “as at home,” implying they should assume their usual local conditions. Given that the lab was located in Krefeld and participants were from the same region, this corresponded to medium water hardness. Upon request, participants were informed that water hardness was the same as at home.
For machines 3 to 7, participants selected the same wash program and dosed detergent without inserting laundry. They were told that the same amount of laundry as in machines 1 and 2 would later be added by laboratory staff before the cycle began. This setup allowed for standardized and time-efficient execution across all stations.
Participants used the same powder detergent brand and type they reported using at home. Only one dosing aid was placed on each machine to guide the dosing task. Half of the participants started with the smaller dosing aid (70 ml), the other half with the larger one (130 ml), to avoid systematic order effects. Participants were instructed to use only the provided dosing aid and received no further guidance regarding the amount to be used. No time constraints were imposed.
After participants had left the room, the dispensed detergent amounts were measured and recorded. For machines 1 and 2, the actual laundry load was also weighed.
3.4 Data collection and analysis
The quantitative outcome variable of this study was the Dosage Difference (DD), defined as the absolute difference in detergent quantity (in grams) dispensed when using the large versus the small dosing aid. DD is the most direct metric to assess individual variation in the use of differently sized dosing aids. It provides a straightforward comparison that does not depend on external reference values or conversion.
For each participant, seven individual dosing amounts were recorded – one per washing machine. The Dosage Difference (DD) was calculated for each machine i as the difference between the actual dosage m i (in grams) and the participant’s mean dosage m across all seven machines (see Eq. (1)).
In addition, the Dosage Gap (DG) was calculated as a relative measure of this difference. DG estimates how strongly dosing behavior deviates between the two conditions in percentage terms.
For each participant, the average dosage across machines using the small dosing aid (m small) and the large dosing aid (m large) was calculated. The difference between these values was set in relation to m small to yield a unitless value (see Eq. (2)). Positive values indicate higher dosages with the large aid.
Both DD and DG are based solely on the measured detergent weights and represent raw outcome values that are independent of manufacturer recommendations or volumetric conversions. While DD quantifies the absolute behavioral shift, DG serves as an indicator of the relative imbalance between intended and unintended dosing across aid sizes.
To enable comparison with recommended dosages in milliliters, the dispensed amounts were converted into milliliters using the bulk density stated on the detergent packaging. This allowed calculation of the Dosing Factor (DF), which is defined in Eq. (3). It is the ratio between the actual dosage of the participant V i in ml and the recommended dosage V target in ml according to the dosing instruction.
Since participants used 15 different detergents, the recommended dosages varied considerably between products. According to the information provided on the packaging, the values ranged from 47 ml to 100 ml for a half load and from 75 ml to 100 ml for a full load (based on medium water hardness and normal soil level). Therefore, the recommended dosages used for calculating DF were determined individually for each participant, based on the measured load weight in machines one and two and assuming medium water hardness and medium soil level.
To support further analyses, two threshold values 2.25 kg and 3.00 kg were used to define a “half load,” reflecting both regulatory standards and typical consumer interpretations.
For each participant, the following data were recorded: the weight of the laundry load (machines 1 and 2 only), the amount of detergent dispensed (in grams), the type of dosing aid used (small or large), the participant’s age group, and self-reported washing habits.
In addition to the experimental data, all participants completed an online questionnaire prior to their laboratory session. This included demographic information, washing habits, use of detergent types, and self-reported dosing routines. After the laboratory task, a brief structured interview was conducted to capture participants’ reflections on their dosing decisions and perceived appropriateness of the amount used. These qualitative and self-reported data supported the interpretation of the dosing behavior and are reported descriptively in the results.
The main outcome variables were the Dosage Difference (DD), the Dosage Gap (DG), and the Dosing Factor (DF). DD represents the absolute difference in detergent weight between the two dosing aid conditions and serves as the simplest indicator of individual variation in dosing behavior. DG expresses this difference as a relative value, providing an estimate of the degree of imbalance between intended and unintended dosing. Both values are based on raw weights and do not rely on any volumetric conversion or product recommendations. DF, in contrast, relates the dispensed volume (converted from weight) to the recommended volume and reflects dosing accuracy in relation to manufacturer instructions.
Statistical analysis was conducted using SPSS (Statistical Package for the Social Sciences). Descriptive statistics were used to summarize central tendencies and variability. Between-group comparisons (e.g., dosing aid, age group) were analyzed using appropriate parametric or non-parametric tests depending on data distribution. Regression models were applied to examine the influence of participant characteristics (e.g., age, dosing aid) on DD, DG, and DF values. All individual values used to calculate DD, DG, and DF are provided in the Supplementary Material.
4 Results
4.1 Participant characteristics and laundry loads
All 97 participants actively wash laundry at home and have an established routine in using powder detergents. The proportions of the age groups 18–29, 30–49, and 50+ were 28 %, 33 %, and 30 %, respectively.
Household size ranged from one to seven persons, with 95 % living in households of one to four members. The distribution of household sizes among participants was compared to national statistics for Germany in 2022. The average household size in Germany was 2.03. 18 Based on this, the expected value for self-reported household size would be 2.69 ± 1.34; in the present sample it was 2.63 ± 1.23. The distribution of household sizes closely mirrors national data: two-person households were the most common, and the deviations in most categories were below five percentage points. Households with five or more members were slightly underrepresented, showing the largest deviation of approximately five percentage points. Overall, the distribution of household sizes in the sample is very similar to that of the general German population.
In terms of washing behavior, the majority of participants reported doing two to three loads of laundry per week. The most commonly used program was the 40 °C cotton cycle.
A total of 194 load weights were recorded, as each of the 97 participants filled two washing machines with laundry. Despite having a 20 kg laundry pile available and being instructed to load the machines as they would at home, the average load weight was only (3.4 ± 0.9) kg per machine. This corresponds to less than 50 % of the machines’ rated capacity of 7 kg. The distribution of the individual load quantities is shown in Figure 1.
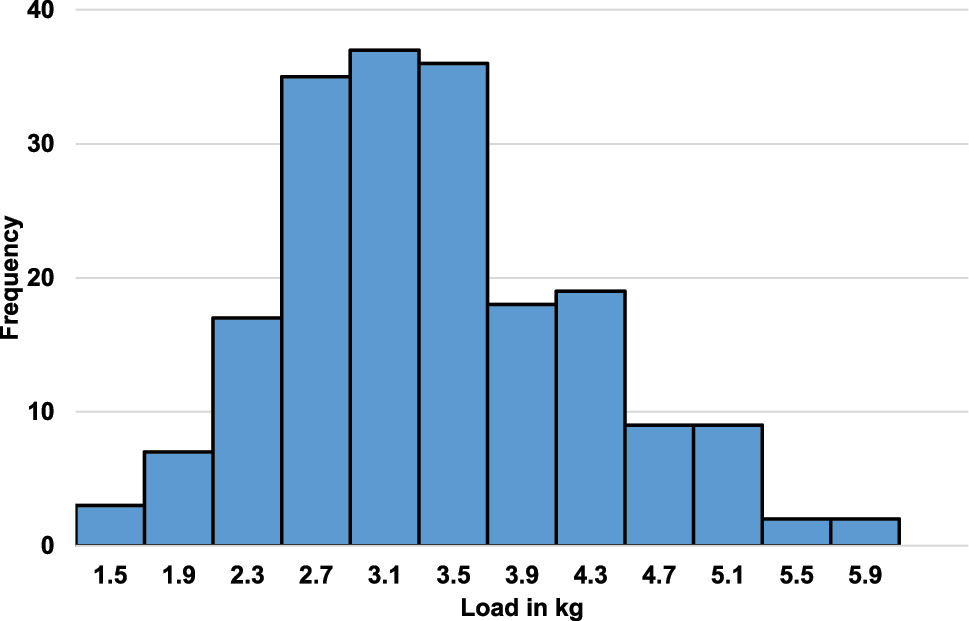
Frequency distribution of load sizes from 97 participants who loaded two washing machines (n = 194), both washing machines had a recommended rated capacity of 7 kg.
An analysis of Spearman’s rank correlation revealed no significant correlations for household size (p = 0.757), number of washes per week (p = 0.625) or age group (p = 0.191), see Table 2.
Analysis of load according to Spearman’s rank correlation.
| Load in relation to: | Correlation coefficient | p-Value |
|---|---|---|
| Household size | −0.032 | 0.757 |
| Washes per week | −0.050 | 0.625 |
| Age group | 0.134 | 0.191 |
The average load of a participant from a one-person household was 3.2 kg, and the average load in households with two–four persons was between 3.3 kg and 3.4 kg. Age showed no significant effect on load, but mean values increased from (3.2 ± 0.8) to (3.6 ± 0.9) kg from the youngest to the oldest group.
Participant feedback collected after the test indicated that most believed their machines were ‘full’. Observations after the test showed that loading close to 7 kg would have required considerable compression, which does not reflect typical home practice and is not addressed in dosing guidelines.
4.2 Effect of dosing aid size on absolute dosage difference
To examine the impact of dosing aid size, participants completed seven individual dosing tasks – alternating between a small (70 ml) and large (130 ml) transparent dosing aid. The average amount of detergent dispensed was significantly higher when the large dosing aid was used. Across all machines and participants, the mean dosage was (53 ± 24) g with the small aid and (61 ± 27) g with the large aid.
For each participant, the average of all seven doses served as their personal reference value. The Dosage Difference (DD) for each machine was then calculated as the deviation from this individual mean value (see Eq. (1)). This approach allowed for the assessment of test conditions (e.g., dosing aid size, machine height) independently of the overall dosing level, which differed between the various detergents used.
A linear mixed model confirmed a significant effect of dosing aid size (p < 0.001), along with two additional factors, machine height (platform vs. no platform) and dosing order (first to last), see Table 3.
Analysis of the Dosage Difference (DD) according to Eq. (1) by a linear mixed model with three parameters. Degrees of freedom were 1 and 668.
| Parameter | F-Value | p-Value |
|---|---|---|
| Small dosage aid (yes/no) | 168.9 | <0.001 |
| Washing machine on elevated platform (yes/no) | 8.7 | 0.003 |
| Machine number (1–7) | 38.9 | <0.001 |
The use of the large dosing aid led to a higher dosage (p < 0.001). Participants also dosed more when the washing machine was placed on a platform (p = 0.003), and a decreasing trend in dosage was observed across the course of the seven repetitions (p < 0.001). As can be seen from the F-values, the effects of platform and machine number were weaker. When the machine was on a platform, the average dosage was 58.5 g compared to 56.4 g without a platform. As the number of machines increased, the average dosage decreased, for the large dosing aid from 58.2 g to 52.3 g, and for the small dosing aid from 57.1 g to 54.2 g.
These results confirm that even under relatively standardized conditions, the physical properties of the dosing aid – as well as environmental factors such as ergonomics can systematically influence consumer behavior.
To allow for generalized statements about the difference between dosages with the large and small dosing aid, the difference was normalized as the Dosage Gap (DG) to enable comparison across participants.
4.3 Dosage differences
4.3.1 Relative dosage gap (DG)
To further assess the effect of dosing aid size on consumer behavior, the Dosage Gap (DG) was calculated as a personal relative measure. On average, the DG was 1.16, indicating that participants dosed approximately 16 % more when using the large aid compared to the small one. The gap was particularly pronounced among younger participants.
While the Dosage Difference (DD) reflects the absolute difference in grams, the Dosage Gap (DG) represents the relative deviation between doses using the large and small dosing aids, compared to the participant’s mean dosage. This allows for better comparability across participants with different general dosing levels because of the use of different detergents.
However, considerable variation of DG was observed across participants. The distribution values (Figure 2) showed a slight bimodal pattern, with one group of participants showing little or no change and another group exhibiting much larger deviations.
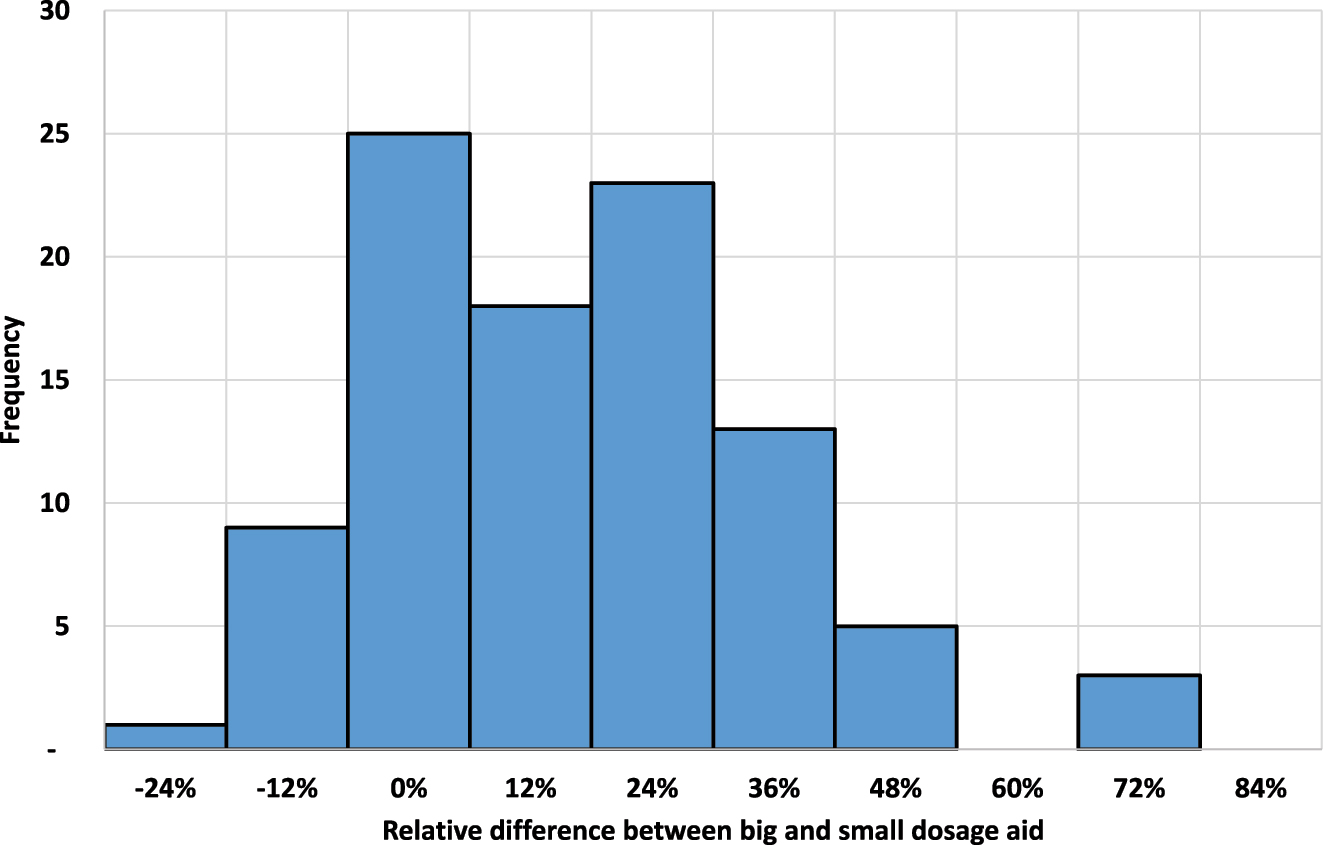
Histogram of the relative difference between dosing with the large and small dosing aids for each participant (n = 97). These values correspond to the dosage gap (DG) minus 1, expressed as a percentage. Values > 0 % indicate a higher dose with the bigger dosing aid.
A group comparison showed that younger participants (18–29 years) exhibited significantly a higher mean DG value of 1.23 compared to the two older age groups with values between 1.11 and 1.12, see Table 4.
Average normalized Dosage Gap (DG) in g/g between the large and small dosing aid for different age groups.
| Age group | |||
|---|---|---|---|
| 18–29 | 30–49 | 50+ | |
| DG | 1.23 ± 0.20 | 1.11 ± 0.16 | 1.12 ± 0.18 |
There are no significant differences between the 30–49 and 50+ age groups (Bonferroni, p = 1.000). However, when the youngest group is compared to the combined older groups, the difference is significant (Mann-Whitney-U-Test, p = 0.005).
The effect of age on dosage can also be seen in the histogram of the Dosage Gap for all participants (Figure 2). The first maximum can be assigned to the two age groups 30–50+, the second at 24 % to the 18–29 age group.
Despite lower average DG values in the older groups, all three age groups showed DG values clearly above 1. This confirms that participants across all age groups generally dosed more when using the larger dosing aid. Since age appears to be a relevant factor, it is also included in the linear mixed model used later in the analysis of the Dosing Factor.
4.3.2 Deviation from recommended dose
Following the initial analysis based on raw detergent weight, dosage accuracy was assessed using the Dosing Factor (DF), defined as the ratio of actual to recommended dosage. This analysis revealed that participants on average underdosed, with notable differences between age groups and dosing aid sizes.
To contextualize the results, we first examined whether participants correctly interpreted the scenario with regard to the parameters relevant for identifying the recommended dosage: load size, degree of soiling, and water hardness. Since sufficient laundry was available for a full load, the scenario expectation was set to “normal” or “full” load. The laundry had no visible stains and was intended to represent medium soiling; water hardness was medium.
The results are shown in Figure 3. Each solid bar starting at 0 % represents the proportion of participants who correctly estimated the respective parameter (e.g., “medium” water hardness). This allows for a visual comparison of correct estimates across parameters, which range between 46 % and 75 %. The blue-hatched bars to the left and right indicate the shares of underestimation and overestimation, respectively. The rightmost grey-hatched bar shows the proportion of participants who did not provide an estimate.
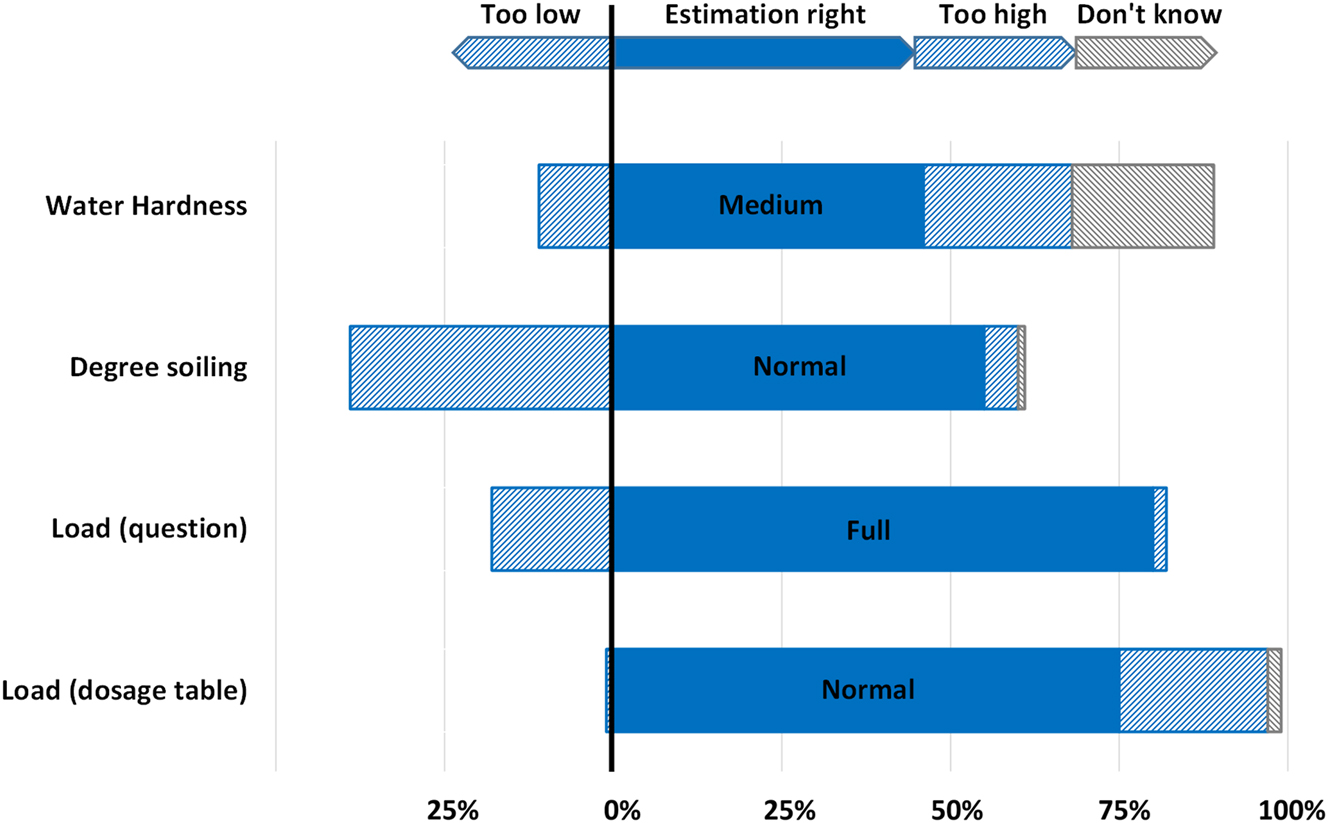
Percentage of participants who correctly (solid bar) or incorrectly estimated water hardness, soiling level, and actual laundry load. Bars show categorical response frequencies (correct, overestimated, underestimated, no answer). Load was assessed in two ways: via a tick in the dosage table and a direct question.
Around 55 % of participants correctly identified the degree of soiling as “normal,” and about 70 % reported considering water hardness in dosing decisions. However, only 46 % correctly estimated water hardness for the scenario, mostly due to a lack of knowledge about their local conditions.
Regarding machine loading, approximately 80 % of participants believed the machine was fully loaded, and 75 % selected “normal load” when confronted with a dosage table. This shows that even in a controlled setup, consumer estimation of dosing parameters remains a potential source of deviation.
Regardless of potential misinterpretations, a personalized reference dosage was calculated for each participant. This calculation was based on the measured laundry weight, combined with the scenario’s predefined medium water hardness and normal soiling level.
Values of DF around one indicate accurate dosing, while values below or above one represent under- or overdosing, respectively.
Across all participants, DF values were on average below 1, indicating a general tendency toward underdosing. This pattern was particularly pronounced when participants used the small dosing aid. However, even with the large aid, many participants failed to reach the recommended dosage.
Since detergent dosage recommendations often distinguish between full and half loads, in detail two thresholds for defining a half load were applied: 2.25 kg and 3.00 kg. These reflect both regulatory standards and a plausible consumer interpretation. Results according to these thresholds, denoted as DF2.25 and DF3.00 are shown for comparison in Table 5. If the limit of 2.25 kg applies, then 6 % of the average loadings by the participants would be considered a half load, and if the limit were 3.00 kg, even 36 %.
Mean and standard deviation of the Dosing Factor DF for different limits to distinguish between half and full load of 2.25 and 3.00 kg for the small and large dosing aids.
| Dosing aid | DF2.25 | DF3.00 |
|---|---|---|
| Small | 0.77 ± 0.35 | 0.85 ± 0.42 |
| Large | 0.90 ± 0.37 | 0.98 ± 0.47 |
| Small & large | 0.83 ± 0.36 | 0.92 ± 0.45 |
The threshold of 2.25 kg was selected for the following analysis, as it aligns more closely with current EU Detergent Regulation. Age again played a notable role: younger participants had lower DF values on average than older participants, suggesting they tended to underdose more (see Table 6).
Relative dosage in relation to the respective recommended dosage, calculated as the average Dosing Factor DF2.25 in ml/ml for different age groups.
| Age | |||
|---|---|---|---|
| 18–29 | 30–49 | ≥50 | |
| DF2.25 | 0.77 ± 0.40 | 0.85 ± 0.36 | 0.90 ± 0.28 |
This pattern is consistent with the DG analysis, where younger participants showed stronger effects of dosing aid size. While they exhibited a larger difference between the two dosing aids (DG), their overall dosage – especially with the small dosing aid – was lower, resulting in a lower DF on average. A linear mixed model confirmed a significant effect of age group on DF, even when controlling for dosing aid and other factors (data not shown).
Additional insights into participant behavior were gathered through self-reports and post-test interviews. The following observations provide context regarding participants’ confidence in their dosing decisions and their reliance on dosing instructions.
In the post-test interview, 49 % of participants stated that they dosed according to the instructions on the detergent package, while an additional 13 % reported dosing somewhat according to the instructions. However, only 40 % felt confident that the amount they dosed at home was correct, whereas 31 % expressed uncertainty, believing they might be overdosing, and 29 % suspected they might be underdosing.
Despite these reported perceptions, subjective confidence in dosing decisions did not strongly correlate with actual dosing accuracy.
5 Discussion
5.1 Summary of main findings
This study investigated how consumers dose laundry detergent under realistic but controlled conditions, with particular attention to the influence of dosing aid size and individual estimation of dosing parameters. The results demonstrate that the size of the dosing aid has a significant impact on the quantity of detergent dispensed. Across all participants, larger aids consistently led to higher dosages, as reflected in both the absolute Dosage Difference (DD) and the relative Dosage Gap (DG).
In addition, participants generally underdosed compared to the manufacturer’s recommendations, especially when using the smaller dosing aid. This was evident in the calculated Dosing Factor (DF), which on average fell below 1. The findings also revealed age-related differences: younger participants showed a more pronounced reaction to the size of the dosing aid, resulting in a higher DG. However, they also dosed less overall, particularly when using the small dosing aid, leading to lower DF values.
Another important finding concerns the actual laundry loads. Although participants had sufficient textiles available and were instructed to load the machines as they would at home, the average measured load was only (3.4 ± 0.9) kg, which was well below the machine’s rated capacity of 7 kg.
5.2 Interpretation of dosage
The findings of this study indicate that the physical properties of the dosing aid have a systematic effect on consumer behavior. Participants consistently dosed more detergent when using the larger dosing aid. This suggests that the volume of the container implicitly communicates what is perceived as an appropriate amount, functioning as a non-verbal dosing cue.
The magnitude of this effect varied by age group. Younger participants were more strongly influenced by the size of the aid, as reflected in the higher DG values. However, they also dosed less in absolute terms, especially with the small aid. This combination explains their overall lower Dosing Factor (DF), despite greater sensitivity to the dosing aid itself. These findings point to a pattern of relative dosing consistency within individuals, but with differing baseline levels across age groups.
A further factor contributing to dosing variability lies in the participant’s interpretation of key scenario parameters. Although dosing instructions were accessible and participants had experience with laundry routines, many incorrectly estimated water hardness or selected load descriptors like “maxi” that did not match the actual test setup.
This discrepancy suggests that dosing is guided more by routine and heuristics than by deliberate evaluation of objective conditions. This interpretation is supported by findings from an online survey conducted in Finland in 2017 with 1,841 participants, where only about 50 % agreed or somewhat agreed that they followed the dosing instructions on the detergent packaging. 19
The observed underdosage relative to manufacturer recommendations may thus result from both physical cues (aid size) and cognitive simplifications (parameter assumptions), rather than intentional product saving. These factors underline the need to consider behavioral patterns when interpreting dosing performance in consumer settings.
5.3 Comparison of load with previous studies
The observed average load weight of 3.4 kg closely mirrors findings from earlier studies. Berkholz 20 reported an average of 3.2 kg for cotton programs, and Kruschwitz et al. 1 reported a load of (3.4 ± 1.2) kg. At that time, most washing machines had a rated capacity of only 5 kg. Despite the higher capacity of 7 kg in the present study, participants did not significantly increase their load. This aligns with results from online surveys as well. 16
This consistency across different studies suggests that consumers rely more on subjective indicators of fullness than on technical capacity. Test runs confirmed that fitting 7 kg of cotton laundry into a machine without compression is difficult, which may reinforce the perception that the drum is already full even when it is not close to its rated capacity.
The persistent pattern of underloading, despite the availability of sufficient laundry, indicates that increasing machine capacity alone does not lead to higher load volumes. Instead, it seems that dosing and loading behavior is governed by habit, visual cues, and convenience.
5.4 Strengths and limitations
One of the strengths of the study is its realistic setup, which allowed participants to behave similarly to how they would dose detergent at home. Participants used the same detergent brand and type they normally used in their household, and they had access to a familiar laundry scenario with a large pile of cotton textiles. They were free to sort the laundry as they preferred, and dosing aids were placed on each machine to match the test condition. This design helped ensure that dosing behavior was guided by habitual routines rather than artificial instructions.
The inclusion of both absolute and relative dosing metrics (DD, DG, DF), combined with measured load weights and post-test responses, provided a multifaceted picture of user behavior. The age-balanced sample design also enabled meaningful subgroup analyses, revealing how different consumer groups respond to dosing aid formats. Furthermore, the alternation of dosing aids and variation in machine height reduced potential order effects and supported more robust conclusions.
However, some limitations must be noted. The study was conducted in a single location, and participant recruitment was restricted to a local region due to uncertainty about travel restrictions following the COVID-19 pandemic. This may limit generalizability, particularly regarding cultural and regional factors that may influence washing behavior. In addition, only two dosing aid sizes were tested. While these reflect commonly used formats, they do not capture the full variety of designs available on the market.
Lastly, although the experimental setting was intentionally realistic, participants were aware that they were being observed. This awareness may have influenced their behavior to some extent.
The sample was not nationally representative, as recruitment was limited to one region. However, the age distribution was balanced across three predefined age groups (18–29, 30–49, and 50+ years), and the household size distribution closely matched national statistics for Germany in 2022. In addition, the range of detergent brands used by participants reflected common market shares in Germany, indicating that the study covered typical consumer preferences. Larger households were somewhat underrepresented.
Moreover, certain experimental factors such as the order of tasks and whether the machine was placed on an elevated platform were shown to influence the amount of detergent dispensed. Although these variables were included in the statistical analysis, they highlight the importance of carefully considering procedural details in study design. Future research should systematically capture and control such influences to improve reproducibility and comparability of findings.
6 Conclusion and implications for the practice
This study shows that the size of a dosing aid can systematically influence the amount of detergent dispensed under conditions that closely reflect everyday household routines. Across all age groups, participants dosed more when using the larger dosing aid, and this effect was especially pronounced among younger users. However, even in the absence of dosing aids matched to the product, many participants underdosed compared to the manufacturer’s recommendation. Inaccurate estimations of parameters such as water hardness or load size were common, which may contribute to this deviation.
The results also demonstrate that users continue to load washing machines well below their technical capacity, supporting earlier findings that perceived fullness rather than rated volume determines user behavior. Together, these insights suggest that dosing performance is shaped not only by information and technical specifications, but also by physical cues, routines, and subjective perceptions.
To improve detergent dosing in real-life contexts, future research and product development should consider the behavioral dimension of dosing more systematically. This includes the design of dosing aids and clearer visual or tactile cues that support correct parameter estimation. Moreover, digitally assisted observation of real household routines, e.g. through smart washing machines or automated sensors, could provide more granular data on typical user behavior and dosing patterns. These technologies may help identify recurring mismatches between recommended and actual use and inform more effective consumer guidance and product design.
The methodological framework developed in this study provides a solid foundation for such investigations and can be extended to evaluate alternative dosing aids, packaging formats, or communication strategies under comparable conditions.
The practical implications are summarized in order to address different parties, which deal with this topic in regard to regulation and consumer information.
Manufacturers of detergents and manufacturers of dosing aids should consider the strong behavioral influence of dosing aid design. The study shows that consumers consistently dosed more with the larger aid, even without explicit instruction. This suggests that the physical dimensions of a dosing tool convey implicit dosing guidance. Designing dosing aids with appropriate volume cues, ideally aligned with recommended dosages, may help consumers stay closer to target amounts.
Washing machine manufacturers should be aware that increases in machine capacity do not automatically result in higher load volumes. The average load of 3.4 kg observed in this study confirms that users fill machines based on perceived fullness, not technical specifications. To support better use, machine interfaces and user instructions could include more intuitive guidance for optimal loading.
Policy makers and regulators should note the discrepancy between labeled recommendations and actual consumer behavior. Even under simplified test conditions, many participants failed to estimate water hardness, soiling, or load size correctly. This undermines the effectiveness of dosing tables and highlights the limits of information-based guidance. Regulatory frameworks may need to consider standardized, user-centered dosing tools or digital aids as part of broader consumer protection strategies.
Consumers themselves appear to rely heavily on routines and subjective assessments when dosing. While many feel confident in their dosing, this confidence does not always match objective accuracy. Educational efforts or clearer feedback systems (e.g. app-based aids, visible markers on dosing tools) may help bridge this gap, particularly for less experienced users.
Consumer organizations could use these findings to advocate for more intuitive dosing systems and better consumer education. The observed age-related differences suggest that younger users are less accustomed to consistently achieving a specific dosage target, especially when using different dosing aids. This highlights the potential for targeted educational efforts to improve dosing accuracy and promote sustainable washing practices.
Funding source: Industrieverband Körperpflege- und Waschmittel e. V. (IKW)
About the author
Tobias Kimmel is a Professor of Cleaning Technology at the University of Applied Sciences Niederrhein, Krefeld, since 2012. He previously worked at Miele & Cie. KG, Gütersloh (2005–2012), focusing on washing process design and the development of detergents and dosing systems. From 2000 to 2005, he was a scientific assistant at TU Berlin, where he completed his PhD in 2004 on microemulsions and reaction kinetics. His research interests include cleaning processes, detergents, and dosing technology.
-
Research ethics: Not applicable.
-
Informed consent: Not applicable.
-
Author contributions: All authors approved its submission.
-
Use of Large Language Models, AI and Machine Learning Tools: Use of AI für improvement of language.
-
Conflict of interest: None.
-
Research funding: Funding was provided by Industrieverband Körperpflege- und Waschmittel e. V. (IKW).
-
Data availability: As Supplement.
References
1. Kruschwitz, A.; Karle, A.; Schmitz, A.; Stamminger, R. Consumer Laundry Practices in Germany. Int. J. Consum. Stud. 2014, 38 (3), 265–277; https://doi.org/10.1111/ijcs.12091.Suche in Google Scholar
2. Kimmel, T.; Pauels, K.; Köpke, M.; Steigerwald, V. Efficiency and Costs of Household Filters for the Retention of Fibrous Microplastics from the Laundry Process in Germany. Environ. Chall. 2024, 15, 100919; https://doi.org/10.1016/j.envc.2024.100919.Suche in Google Scholar
3. Thomas, B.; Fishwick, M.; Joyce, J.; van Santen, A. A Carbon Footprint for UK Clothing and Opportunities for Savings; WRAP: Banbury, UK, 2012.Suche in Google Scholar
4. European Commission Follow-up of the Preparatory Study for Ecodesign and Energy Label for Household Washing Machines and Household Washer Dryers: Final Report; Publications Office of the European Union: Luxembourg, 2017.Suche in Google Scholar
5. Beton, A.; Dias, D.; Farrant, L.; Gibon, T.; Le Guern, Y.; Desaxce, M.; Perwueltz, A.; Boufateh, I. Environmental Improvement Potential of Textiles (IMPRO Textiles), Report EUR 26316 EN; Publications Office of the European Union: Luxembourg, 2014.Suche in Google Scholar
6. Palamutcu, S. Energy Footprints in the Textile Industry. In Handbook of Life Cycle Assessment (LCA) of Textiles and Clothing; Woodhead Publishing: Amsterdam, 2015; pp 31–61.10.1016/B978-0-08-100169-1.00002-2Suche in Google Scholar
7. Cortez, D. M.; Ter Bekke, M.; Liang, Z.; Stamminger, R. The Impact of Detergent Performance on Sustainable Consumer Laundry Behavior: a Socio-Technical Challenge. Tenside Surfactants Deterg. 2024, 61 (3), 203–215; https://doi.org/10.1515/tsd-2023-2575.Suche in Google Scholar
8. Morgan, E.; Foxon, T. J.; Tallontire, A. I Prefer 30°’? Business Strategies for Influencing Consumer Laundry Practices to Reduce Carbon Emissions. J. Clean. Prod. 2018, 190, 234–250; https://doi.org/10.1016/j.jclepro.2018.04.117.Suche in Google Scholar
9. Lange, I. Vorschläge zur Produktentwicklung und -verbesserung in Produktbewertungen. In Texte als Daten. Beiträge zur empirischen Marketing- und Vertriebsforschung; Springer Gabler: Wiesbaden, 2023; pp 73–113.10.1007/978-3-658-42973-7_4Suche in Google Scholar
10. IKW Nachhaltigkeit in der Wasch-, Pflege- und Reinigungsmittelbranche in Deutschland, 2025. https://www.ikw.org/fileadmin/IKW_Dateien/downloads/Haushaltspflege/2023_IKW_Nachhaltigkeitsbericht.pdf (accessed 2025-06-14).Suche in Google Scholar
11. Vandermeulen, G. W. M.; Boarino, A.; Klok, H. A. Biodegradation of Water-Soluble and Water-Dispersible Polymers for Agricultural, Consumer, and Industrial Applications – Challenges and Opportunities for Sustainable Materials Solutions. J. Polym. Sci. 2022, 60 (12), 1797–1813; https://doi.org/10.1002/pol.20210922.Suche in Google Scholar
12. Yates, L.; Evans, D. Dirtying Linen: Re-Evaluating the Sustainability of Domestic Laundry. Env Pol Gov 2016, 26 (2), 101–115; https://doi.org/10.1002/eet.1704.Suche in Google Scholar
13. VuMa. Den Markt im Blick . Basisinformationen für fundierte Mediaentscheidungen. VuMA Touchpoints; Hamburg, 2022.Suche in Google Scholar
14. A.I.S.E. Compaction of Household Laundry Detergents: Fact Sheet, 2019. https://aise.eu/app/uploads/2024/04/Compaction-AISE-factsheet-2019.pdf (accessed 2025-06-14).Suche in Google Scholar
15. Netzgesellschaft Niederrhein mbH. Wasserversorgungskonzept der Stadt Krefeld, 2018. https://www.bund-krefeld.de/fileadmin/krefeld/Stellungnahmen/Wasser/18-06-20_Wasserversorgungskonzept_Stadt_Krefeld.pdf (accessed 2025-06-14).Suche in Google Scholar
16. Schmitz, A.; Alborzi, F.; Stamminger, R. Large Washing Machines are Not Used Efficiently in Europe. Tenside Surfactants Deterg. 2016, 53 (3), 227–234; https://doi.org/10.3139/113.110427.Suche in Google Scholar
17. Paloviita, A.; Järvi, P. Environmental Value Chain Management of Laundry Detergents in the Use Phase. Int. J. Consum. Stud 2008, 32 (6), 607–612; https://doi.org/10.1111/j.1470-6431.2008.00692.x.Suche in Google Scholar
18. Destatis. Haushalte und Familien: Haushalte nach Haushaltsgrößen im Zeitvergleich, 2023. https://www.destatis.de/DE/Themen/Gesellschaft-Umwelt/Bevoelkerung/Haushalte-Familien/Tabellen/1-3-privathaushalte-neuer-zeitvergleich.html (accessed 2025-06-14).Suche in Google Scholar
19. Miilunpalo, S.M.; Räisänen, R. Clean Laundry with Pure Conscience – A Study on Laundry Practices Among Finnish Consumers. Int. J. Consum. Stud. 2019, 43 (2), 153–165; https://doi.org/10.1111/ijcs.12493.Suche in Google Scholar
20. Berkholz, P.; Brückner, A.; Kruschwitz, A.; Stamminger, R. Verbraucherverhalten und verhaltensabhängige Einsparpotentiale beim Betrieb von Waschmaschinen: Leicht geänderte Fassung einer Studie durchgeführt im Auftrag des Bundesministeriums für Wirtschaft und Technologie (BMWI - Projektnummer: 86/05 AZ: I A 2 - 00 09 80); Shaker: Aachen, 2007.Suche in Google Scholar
Supplementary Material
This article contains supplementary material (https://doi.org/10.1515/tsd-2025-2678).
© 2025 the author(s), published by De Gruyter, Berlin/Boston
This work is licensed under the Creative Commons Attribution 4.0 International License.
Artikel in diesem Heft
- Frontmatter
- Household Washing
- Effect of dosing aid size and consumer age on detergent dosage and discrepancies between perceived and measured laundry load in household washing
- Applications
- Impact of detergents on okra seed germination, plant growth and soil properties
- The limitations of flotation technique in processing complex Um Nar BIF: exploring sustainable alternatives
- Preparation and evaluation of hydroxymethylated betaine surfactant for enhanced recovery application
- Physical Chemistry
- Physical chemistry of nanoparticle reinforced polymer fracturing fluid system with high temperature resistance
- Novel Surfactants
- Scrutinizing self-assembly, interfacial properties and antimicrobial behavior of pyrrolidinium-based monomeric surfactants