The effects of sodium benzoate exposure on learning and neurobehavior during the prepubertal period in rats
-
İlter İlhan

 ,
Duygu Kumbul Doğuç
,
Halil İbrahim Büyükbayram
,
Dilek Aşcı Çelik
,
Nilgun Gurbuz
and
Fatih Gultekin
,
Duygu Kumbul Doğuç
,
Halil İbrahim Büyükbayram
,
Dilek Aşcı Çelik
,
Nilgun Gurbuz
and
Fatih Gultekin

Abstract
Objectives
Exposure to food additives, especially during the critical development period, has been associated with some behavioral disorders and learning difficulties in childhood. In this study, we aimed to evaluate the impact of sodium benzoate (NaB) on learning and neurobehavior in prepubertal rats.
Methods
A total of male rats (4-week-old) were divided into three groups as the control (CG), experiment 1 (NaB-ADI (acceptable daily intake) dose, Exp1G), and experiment 2 (NaB-NOAEL (no observed adverse effect level) dose, Exp2G) groups and NaB was administered by oral gavage for six weeks. Changes in learning, memory, motor activity and neurobehavior were evaluated by Morris water maze and open field tests. At the end of the experiment, rats’ hippocampi were extracted; NR1, NR2A, NR2B, and nAChRα7 receptor concentrations and mRNA expressions were determined.
Results
Neurobehavioral tests supported the possibility of increased anxiety and decreased motivation in the Exp1G. Also, molecular tests showed that NR2B receptor protein and mRNA expression levels significantly increased in Exp2G compared to CG.
Conclusions
Our study showed that NaB administration in the prepubertal period may cause increased anxiety, decreased motivation, and attention with ADI dose. Furthermore, NOAEL dose administration may lead to an increase in NR2B receptor levels. In light of these results, NaB consumption in childhood may affect hippocampal functions related to learning and neurobehavior.
Introduction
Sodium Benzoate (NaB) is the sodium salt of benzoic acid, labeled as E 211 [1]. It is widely used as a preservative in soft drinks, fruit yogurts, canned vegetables, jams, pickles, salad sauces, and fruit juices [2]. Besides, benzoic acid and NaB are used as antimicrobial agents in edible coatings [3]. In addition to its use in the food industry, NaB is also used in pharmacy, as a preservative in liquid medicines, and as a drug for treating children with urea cycle disorders [4].
The dose-related harmful effects of the food additives are evaluated by animal toxicity studies, and ‘No Observed Adverse Effect Level’ (NOAEL) doses are determined. Then, the dose, the consumable daily amount for a lifetime without any health problem for humans, is calculated as the ‘Acceptable Daily Intake’ (ADI) with the formula NOAEL/100. Due to its wide usage, the European Food Safety Authority (EFSA) described the ADI of NaB as 0–5 mg/kg [1]. NaB exposure in the general population is mainly via foods that contain the substances naturally or via NaB-added products. In the prepubertal ages, non-alcoholic flavored drinks like coke or lemonade are the main source of consumed benzoic acid [5]. Due to the permitted high level of benzoate concentration in soft drinks (250 mg/kg), ADI was found to be exceeded by children in some countries [6].
Food preservatives are generally considered safe at recommended doses. However, many studies have shown unexpected side effects of food additives, making the safety of these ingredients controversial. It has been reported that benzoic acid causes various allergic reactions, such as asthma, skin rashes, and anaphylactic shock, even at low levels in humans due to oral, dermal, or respiratory intake [3]. Also, long-term intake of NaB is suggested to result in chromosomal damage [7]. Furthermore, the combination of ascorbic acid with NaB in beverages leads to the formation of benzene which is a known carcinogen [8].
There is increasing evidence suggesting that NaB may contribute to behavioral disorders like attention/deficit hyperactivity disorder (ADHD) in the young population [9]. A well-designed clinical study indicated that artificial food colorings and NaB could affect neurobehavior in children [10]. In an animal model, it has been shown that the NaB could cause neurotoxicity during embryogenesis which is the most critical period of neurodevelopment [11].
Although many studies show that NaB has negative effects on the nervous system, there are also studies showing the opposite. For example, cinnamon, converted to NaB in the liver, has been reported to have beneficial effects on the neuronal system by elevating neurotrophic factors [12]. The N-methyl D-aspartate receptors (NMDARs) and nicotinic acetylcholine receptors (nAChRs) are key members of memory and learning in the hippocampus and are found to decrease in Alzheimer’s disease (AD). It has also been shown that cinnamon improves cognitive functions, memory, and learning in AD [13].
The prepubertal and pubertal periods are also important for neuronal development [14]. Environmental and endocrine factors may affect brain plasticity and behavior during these periods and may lead to various childhood disturbances such as anxiety, poor social skills, ADHD, and depression [15, 16].
In our study, we aimed to investigate the effects of NaB consumption on learning and neurobehaviour in the prepubertal period by performing neurobehavioral tests and measuring the expressions of learning-related neurotransmitter receptors in the hippocampus.
Materials and methods
Animals
We used 42 male Wistar albino rats (4-week-old, weighing 100–150 g) housed at 21–22 °C, % 60 ± 5 humidity, and a 12 h light-dark cycle. All rats were given free food and water. Our study was approved by The Local Animal Ethics Committee of Suleyman Demirel University (Ethic No: 18.06.2015/06–14). The rats were grouped as follows:
Control group (CG, n=14): 1 mL of saline was orally administered by gavage for six weeks.
Experimental one group (Exp1G, n=14): 5 mg/kg (ADI) dosage of NaB (Sigma-Aldrich, USA, B3420) was orally administered by gavage for six weeks.
Experimental two group (Exp2G, n=14): 500 mg/kg (NOAEL) dosage of NaB (Sigma-Aldrich, USA, B3420) was orally administered by gavage for six weeks.
Rats were weighed, and an appropriate amount of 99.5% pure NaB (Sigma-Aldrich, USA, B3420) was calculated and dissolved in drinking water. NaB administration continued until the rats were 10 weeks old to reflect a regular intake of NaB throughout childhood [17].
Behavioral tests
Morris water maze
In the assessment of spatial learning and memory as a measure of cognitive function, the Morris water maze was used. For this test, a platform was placed 2 cm below the surface in a round tank containing colored water. The water temperature was checked every day and was adjusted to 23 °C. The tank was surrounded by four lamps, and dim-lit was provided with indirect illumination. Also, fixed visual cues such as gloves and ribbons were placed around the pool, and their position was not changed until the end of the experiment.
Experimental procedure
The pool was divided into four quadrants, with a platform placed in the quadrant called the ‘target quadrant.’ Using spatial cues and navigational strategies exercises to learn the location of the platform were performed for five consecutive days via modified Morris protocol [18]. On the sixth day, the ‘Probe trial’ test was applied. For this test, the hidden platform in the target quadrant was removed, and the rats were released without the hidden platform and allowed to swim for 1 min and the period they spent in the target quadrant where the hidden platform was located during the training days (1–5 days) was recorded. This period was evaluated as an indicator of spatial memory.
Then, on the 6th day, the ‘Visible Platform’ test of this experiment was applied to the rats. This test was conducted to evaluate the effects of NaB on vision, changes in locomotor activity, and/or motivation in rats. Durations to find the visible platform were recorded while performing this test.
Open field test
The open field test is used to assess locomotor activity, exploratory behavior patterns, and anxiety-related behaviors and is scored accordingly [19]. The excess of the number of lines passed, rearing, climbing the wall, and activities in the center square reflect increased locomotor activity, exploratory behavior, and low anxiety. The excess of time spent on the edge of the platform decreased movements in the center field, and increased defecation and urination reflect the loss of exploratory behavior and a high level of anxiety [20].
Sample preparation and western blotting
At the end of the experiment, the rats were decapitated under anesthesia (10 mg/kg Xylazine-80 mg/kg Ketamine), and hippocampi were extracted from brain tissue. Hippocampi were homogenized in a special buffer (50 mM Tris-HCl, 0.15 M NaCl, 1 mM EDTA, 2 mM EGTA, 25 μg/mL Leupeptin, 25 μg/mL Aprotinin, 10 μM benzamidin and % one Triton X-100). After centrifugation, protein concentrations of samples were analyzed, and 50 μg of protein was used per lane for electrophoresis. At the end of electrophoresis, proteins were blotted to the polyvinylidene fluoride (PVDF) membrane (Millipore, Australia). Following the routine steps (blocking, incubation with primary and secondary antibodies), membranes were visualized with BCIP/NBT premixed solution (Thermo Scientific, USA), and optical density was taken with Kodak Image 2,000 MM (Eastman Kodak, USA). Anti NR1 (Sigma Aldrich, USA, 1/1,000 concentration), anti NR2A (Sigma Aldrich, USA, 1/3,000 concentration), anti-phospho-Tyr1472NR2B (Sigma Aldrich, USA, 1/500 concentration), anti nAChRα7 (Abcam, UK, 1/1,000 concentration) were used as primary antibodies, and β-actin (Abcam, UK, 1/1,000 concentration) was used for loading control. The densitometrical results of the control group for each receptor were adjusted to 100 due to simplifying the values.
Reverse transcriptase polymerase chain reaction (RT-PCR) analysis
Total RNA was isolated from the hippocampus tissues with TRIzol Reagent (Invitrogen Life Technologies, USA). cDNA was synthesized from 1 µg of total RNA using with cDNA Synthesis Kit (Thermo Fisher, USA). The cDNA for NR2A, NR2B, nAChRα7 and GAPDH were amplified by PCR, using Platinum Taq DNA Polymerase kit (Invitrogen Life Technologies, USA), with specific primers. 2 µL of the total 20 µL of the reverse-transcribed product were used for PCR in 1 × PCR buffer containing 1.5 mM MgCl2, 200 µM deoxynucleotide triphosphates (dNTPs), 1 unit of Platinum Taq polymerase, and 0.2 µM of each indicated primers (Integrated DNA Technologies, USA). The sequences of the sense and anti-sense NR2A primers were 5′-CGAACCCTTCAGTGCCTCC-3′; and 5′-ACTTGGTCCACAAACTCCTCCT-3′, respectively. The sequences of the sense and anti-sense NR2B primers were 5′-GCAAGCACGGGAAGAAGA-3′; and 5′-AGACAGCCACCGCAGAAAC-3′, respectively. The sequences of the sense and anti-sense nAChRα7 primers were 5′-GCTACATTGACGTTCGCTGGT-3′; and 5′-AGGTGACATCTGGGTATGGCT-3′, respectively. The cDNA samples were incubated at 94 °C for 2 min, and this step was followed by 35 cycles of PCR amplification (94 °C for 30 s, 60 °C for 30 s, and 72 °C for 60 s, in each cycle). The PCR reaction was terminated with a final extension step of 5 min at 72 °C. The amplified reaction products were analyzed on a 1.2% agarose gel containing SYBR Green under a Blook LED transilluminator (GeneDireX, USA). The cDNA synthesis was verified by detecting the GAPDH transcript, which was used as an internal control. The gene expression bands were semi-qualified using Image J analysis (NIH, USA).
Statistical analysis
In order to evaluate the effect of time in terms of ‘time to find the hidden platform’ from the Morris Water Maze data, within-group and inter-day comparisons were made for each training day. In the group comparison, for the first 5-day learning period, the data from day 1 to day 5 for each group were evaluated by Univariate repeated-measure analysis of variance (RMANOVA), and p<0.05 was considered significant. Bonferroni corrected t-test was applied to determine the day responsible for the significance.
Inter-group comparisons of the data of ‘Morris Water Maze training days’, ‘probe trial test’, ‘visible platform test’ and ‘open field test’ were evaluated with ‘One Way ANOVA’ followed by post-hoc Tukey test, p<0.05 was considered significant.
Protein optic densities and mRNA expressions of the hippocampal receptors were evaluated by the Kruskal Wallis test, followed by ‘The Mann-Whitney U test’; p<0.05 was accepted as significant.
Results
Morris water maze test
When each group was evaluated day to day in the water maze test, the time they spent to find the hidden platform from the 1st day to the 5th day (training period) was significantly shortened in all three groups (p<0.001), this data showed that all groups learned the task (Figure 1A).

Comparison of latency to locate the hidden platform during the training period in Morris Water Maze. (A) Intragroup day-to-day comparison of the time to find the hidden platform. * Indicates a significant difference as compared to the 1st day of the control group (p<0.001); # indicates a significant difference as compared to the 1st day of the Exp1G (p<0.001); & indicates a significant difference as compared to the 1st day of the Exp2G (p<0.001); Exp1G, experiment 1 group; Exp2G, experiment 2 group. Data are given as mean ± SD. (B) Intergroup comparison of the time to find the hidden platform. a, indicates a significant difference as compared to the control group (p=0.015); b, indicates a significant difference as compared to the Exp2G (p<0.001). Data are given as mean ± SD.
When the groups were compared with each other for each training day, it was seen that on the 5th day, the Exp1G found the hidden platform at longer time than the CG and Exp2G (p<0.05) (Figure 1B).
There was no statistically significant difference between groups in terms of swimming speed, the average distance traveled, time spent in the outer quadrant, distance traveled in the outer quadrant, and swimming speed for the first, 2nd, and 4th training days (p>0.05).
On the 3rd training day, ‘swimming speed in the outer quadrant’ was significantly higher in the Exp1G than in the Exp2G (p=0.011).
When the data on the 5th training day were examined, it was found that there was a significant increase in the ‘distance traveled in the outer quadrant’ in the Exp1G compared to the CG and Exp2G (p<0.05). In addition, ‘swimming speed in the outer quadrant’ and ‘average distance traveled’ were found to increase in the Exp1G compared to the Exp2G (p<0.05). Also, in Exp1G, ‘time spent in the outer quadrant’ was increased compared to CG (p<0.05) (Table 1).
Intergroup comparison of training period parameters in Morris water maze.
| Days | Groups | Time spent in the outer quadrant, s | Distance traveled in the outer quadrant, cm | Swimming speed in the outer quadrant, cm/s | Average distance traveled, cm | Swimming speed, cm/s |
|---|---|---|---|---|---|---|
| Day 1 | Control | 23.01 ± 9.89 | 362.7 ± 137.5 | 16.02 ± 1.58 | 575.3 ± 152.7 | 15.65 ± 1.79 |
| Exp 1 | 24.8 ± 7.29 | 407.9 ± 108.8 | 16.75 ± 2.12 | 620.4 ± 121 | 15.98 ± 2.31 | |
| Exp 2 | 26.86 ± 8.02 | 441.3 ± 147.8 | 16.25 ± 1.95 | 619.1 ± 160.8 | 15.03 ± 1.85 | |
| Day 2 | Control | 5.22 ± 6.05 | 69.64 ± 87.86 | 12.61 ± 2.44 | 231.2 ± 201.5 | 11.44 ± 1.98 |
| Exp 1 | 4.79 ± 5.26 | 69.68 ± 82.14 | 13.67 ± 1.94 | 193.3 ± 105.3 | 12.88 ± 1.46 | |
| Exp 2 | 4.76 ± 4.33 | 58.31 ± 58.97 | 11.77 ± 2.75 | 172.6 ± 92.2 | 11.43 ± 1.7 | |
| Day 3 | Control | 4.69 ± 6 | 67.03 ± 95.79 | 23.47 ± 11.34 | 218.7 ± 187.2 | 12.21 ± 1.95 |
| Exp 1 | 3.83 ± 4.22 | 63.83 ± 66.39 | 44.47 ± 38.27b (p=0.011) | 205.4 ± 111.7 | 14.02 ± 2.23 | |
| Exp 2 | 3.53 ± 4.02 | 36.15 ± 28.19 | 17.3 ± 6.26 | 147.26 ± 59.79 | 12.43 ± 2.26 | |
| Day 4 | Control | 1.77 ± 1.74 | 23.36 ± 24.72 | 17.28 ± 7.39 | 116.7 ± 80.9 | 12.14 ± 1.81 |
| Exp 1 | 2.17 ± 1.51 | 27.28 ± 16.06 | 19.22 ± 5.35 | 123.3 ± 40 | 13.57 ± 2.28 | |
| Exp 2 | 2.56 ± 3.56 | 24.67 ± 22.92 | 15.77 ± 3.65 | 113.4 ± 64.1 | 12.65 ± 2.43 | |
| Day 5 | Control | 1.55 ± 0.85 | 18.84 ± 9.53 | 15.45 ± 3.69 | 102.3 ± 39.7 | 12.06 ± 1.73 |
| Exp 1 | 3.68 ± 3.63a (p=0.048) | 48.24 ± 46.25a,b (p=0.022; 0.014) | 19.24 ± 7.55b (p=0.008) | 152.7 ± 73.6b (p=0.001) | 13.58 ± 2.62 | |
| Exp 2 | 1.95 ± 2.09 | 16.98 ± 6.46 | 12.74 ± 3.92 | 78.83 ± 20.52 | 12.41 ± 3.01 |
-
aExpresses a statistically significant difference compared to the control group in terms of the parameters specified in the columns (p<0.05); bexpresses a statistically significant difference compared to the Exp 2 group in terms of the parameters specified in the columns (p<0.05); Exp 1, experiment 1; Exp 2, experiment 2. Data are given as mean ± SD.
In the ‘Probe test’, in which the learned information is tested, the groups were evaluated, and no statistically significant difference was found between groups (p>0.05) (Table 2).
Intergroup comparison of probe and visible test parameters in Morris water maze.
| Groups | Control | Exp 1 | Exp 2 |
|---|---|---|---|
| Time spent in target quadrant, s | 20.52 ± 4.48 | 22.4 ± 4.8 | 21.63 ± 5.7 |
| Swim speed in the probe trial, cm/s | 15.63 ± 1.93 | 15.96 ± 3.1 | 14.8 ± 1.91 |
| Distance covered in target quadrant, cm | 937.8 ± 116.2 | 957.1 ± 186.4 | 887 ± 115 |
| Latency to locate the visible platform, s | 7.54 ± 2.5 | 13.42 ± 8.27 a | 10.82 ± 5.7 |
| Distance covered to locate the visible platform, cm | 103.2 ± 33 | 165.8 ± 78.3 a | 142.1 ± 66.2 |
-
aIndicates a significant difference compared to the control group (p<0.05); Exp 1, experiment 1; Exp 2, experiment 2. Data are given as mean ± SD.
In the ‘visible platform test’, the ‘time spent to find the visible platform’ and ‘traveled distance to locate the visible platform’ were increased in the Exp1G compared to CG (p=0.039, p=0.033, respectively).
Open field test
A comparison of each parameter in the open field test showed no significant difference between groups (p>0.05) (Table 3).
Intergroup comparison of open field test data.
| Groups | Control | Exp 1 | Exp 2 |
|---|---|---|---|
| Number of line crosses | 20.57 ± 9.25 | 21.43 ± 8.14 | 21.36 ± 11.73 |
| Number of walling | 14.57 ± 6.81 | 13.78 ± 3.59 | 14.71 ± 5.73 |
| Number of rearing | 2.71 ± 3.45 | 3.64 ± 3.95 | 3.92 ± 3.49 |
| Entrance number of the center zone | 2.14 ± 2.80 | 2.14 ± 2.28 | 2.36 ± 2.59 |
| Number of center crosses | 0.79 ± 1.19 | 0.43 ± 0.76 | 0.21 ± 0.43 |
| Time in the outer zone, s | 297.5 ± 4 | 297.2 ± 3.3 | 296.9 ± 3.2 |
| Time in inner zone, s | 1.91 ± 3.11 | 2.46 ± 3.00 | 2.77 ± 2.84 |
| Time in the central zone, s | 0.57 ± 1.04 | 0.33 ± 0.59 | 0.26 ± 0.52 |
| Number of urinate | 4.85 ± 2.79 | 3.85 ± 1.87 | 3.85 ± 2.95 |
| Number of defecate | 4.42 ± 1.74 | 5.35 ± 2.97 | 4.64 ± 1.64 |
-
Exp 1, experiment 1; Exp 2, experiment 2. Data are given as mean ± SD.
Western blot
No statistically significant difference was found in the concentration of NR1, NR2A, and nAChR α7 receptors when compared between groups (p>0.05). However, a significant increase of 25.37% was observed in the NR2B receptor concentration in the Exp2G compared to the CG (p<0.001) (Figure 2).

Representative images of Western blot analysis for each receptor and comparison of % expression levels between groups. β-Actin and the receptors on each membrane are denoted with an arrow. *Indicates a significant difference compared to the CG (p<0.001). M, prestained marker; C, control; CG, control group, Exp 1, experiment 1; Exp 2, experiment 2. Data are given as mean ± SEM.
Relative mRNA expression analysis by RT-PCR
No significant difference was found in the relative mRNA levels of NR2A and nAChR α7 receptors in the comparison between groups (p>0.05). But the mRNA level of NR2B in the Exp2G group increased significantly compared to the CG and Exp1G (p<0.05) (Figure 3).
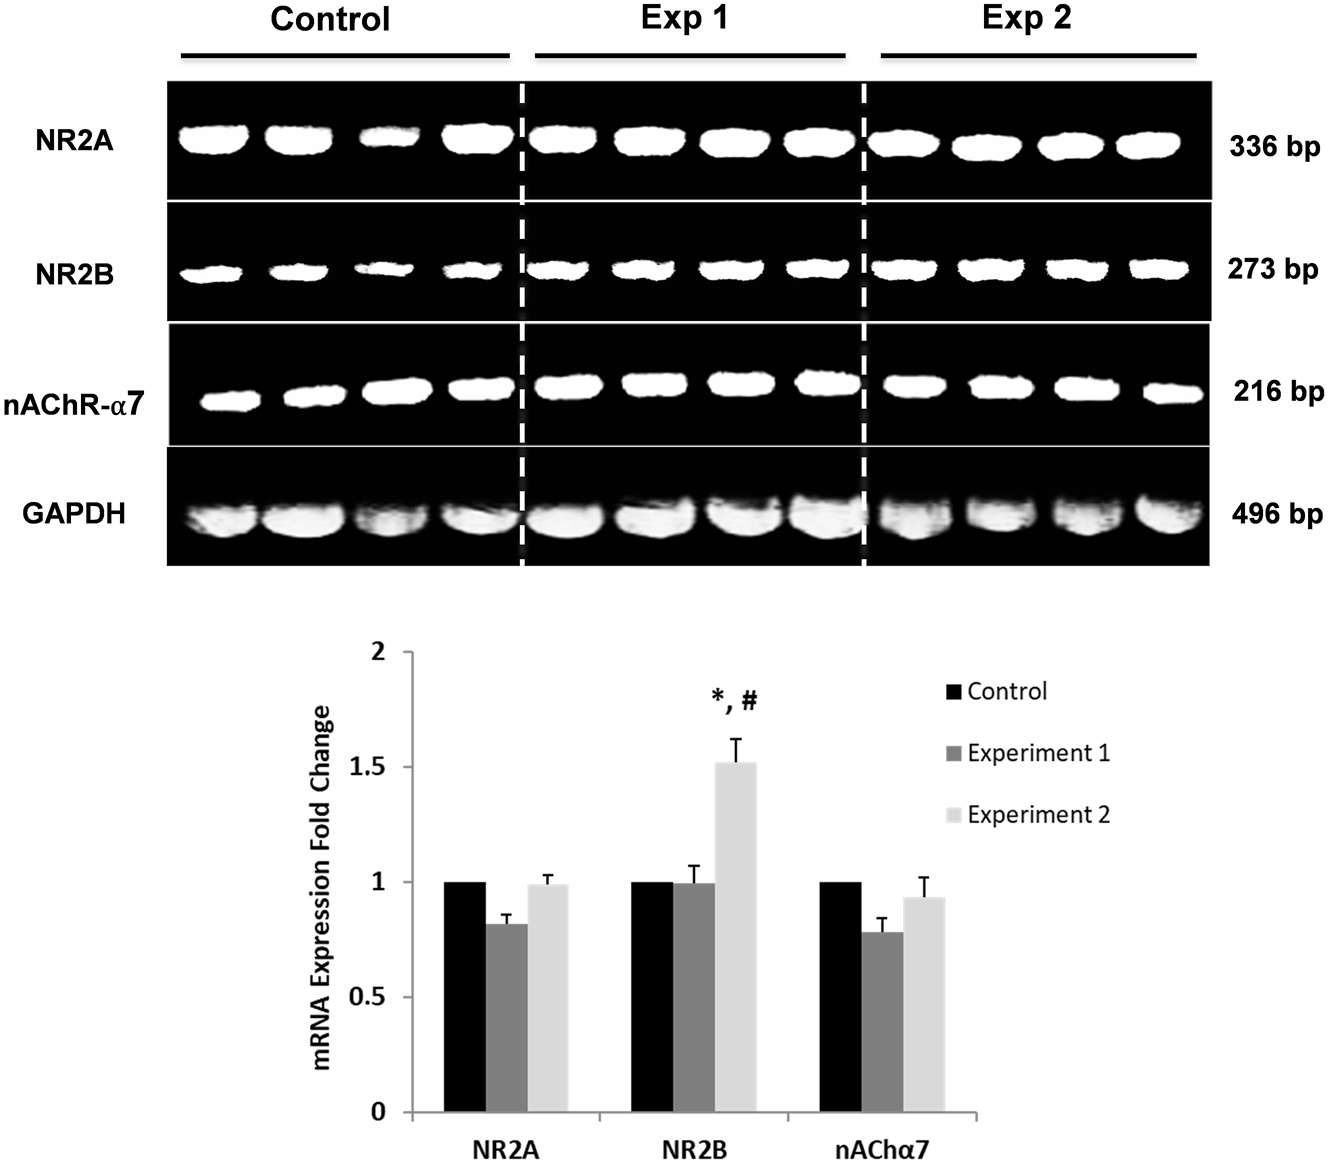
Representative images of mRNA expressions of NR2A, NR2B, and nAChα7 receptors and comparison of results between groups. *Indicates a significant difference compared to the CG (p<0.05); # indicates a significant difference compared to the Exp1G (p<0.05); CG, control group; Exp1G, experiment 1 group. Data are given as mean ± SEM.
Discussion
NaB is a more commonly consumed additive than expected and is commonly found in market products consumed a lot in childhood. A study conducted in Australia and New Zealand, reported that NaB consumption was the highest in the 2–12 age group, and the ADI value was exceeded, especially in the 2–5 age group. In addition, it has been stated that NaB consumption is higher in boys and adolescents [21]. Also, according to another study in Austria, NaB consumption exceeded the ADI in all population groups, including preschool children [22].
In our study, NaB was administered to male rats to simulate a period covering the entire prepubertal period [17]. The effects of this substance on rats in terms of learning, memory, and motor activity were evaluated by the Morris water maze and open field test. Then, changes in the concentration of several NMDAR subunits and nAChRα7 in the hippocampus were investigated.
Although all rats learned the task in the Morris water maze training period, on the 5th day, the ‘time to find the hidden platform’ of the Exp1G was significantly longer than the CG and Exp2G. In addition, on the 3rd and 5th training days, ‘swimming speed in the outer quadrant’, on the 5th training day, ‘distance traveled in the outer quadrant’, ‘time spent in the outer quadrant’, and ‘average distance traveled’ increased significantly in the Exp1G which may reflect increased anxiety. In the ‘Visible Platform’ test, it was determined that Exp1G found the visible platform in a longer time than the CG and covered more distance as well. According to our data, especially on the 5th day, we could suggest that there was increased anxiety and loss of motivation and attention in the ADI dose applied rats. Although the learning process continued, there was a delay in reaching the goal.
There are some clinical and experimental studies in the literature examining the effects of NaB. In a clinical study involving 277 (3-year-old) children, Bateman et al. administered drinks containing a mixture of 45 mg of NaB and food colorings daily for one week. Then, a placebo drink was given for one week, and hyperactivity was evaluated during these periods. As a result, behavioral changes could not be detected by clinical tests, but increased hyperactivity was found in the evaluation reports of families [23]. In the study of McCann et al., three and 8-year-old children were given A and B drinks containing 45 mg NaB and different food coloring mixtures for one week, followed by a placebo drink for one week, and this process was repeated two times. Later, in these periods, hyperactivity score was obtained using some clinical tests and criteria such as family evaluation and class performance for hyperactivity scoring. As a result, in both age groups, an increase in the hyperactivity score was found when NaB and artificial food colorants were given, compared to when a placebo drink was given [10]. Beezhold et al. in their study on university students, stated that hyperactivity and attention deficit symptoms were more common in students consuming NaB-rich beverages [24]. Although our study was an experimental study and the evaluation tests were different, similar findings were obtained in terms of attention deficit and loss of motivation.
In animal studies, Noorafshan et al. applied NaB to male adult rats at a dose of 200 mg/kg/day by oral gavage for four weeks. At the end of the experiment, the rats were evaluated with neurobehavioral tests, and an increase in anxiety was detected in the experimental group. Also, in another study, the administration of 50, 300, and 600 mg/kg NaB induced anxiety in adult rats [25]. In our study, several data are consistent with those studies, such as loss of motivation and increased anxiety obtained in the group of ADI dose, but these effects were not seen in the NOAEL dose group. This difference may be due to the application duration, besides in our study experiment was performed in the prepubertal period of rats.
Most chemicals show a standard dose-dependent monotonic response curve (a response curve that increases with dose), but some chemicals may show a non-monotonic response curve (a response that could be seen in low dose) and are called endocrine disrupting chemicals (EDC) [26]. Benzoic acid is an EDC member, and some EDCs are associated with ADHD symptoms [16]. In our study, while findings supporting increased anxiety and attention deficiency were observed with the ADI dose (5 mg/kg/day), the absence of these findings at the NOAEL dose (500 mg/kg/day) may be attributed to the endocrine disrupting role of NaB in the ADI dose [2].
In the molecular step of our study, we examined the effect of NaB application on nAChRα7 and NR1, NR2A, and NR2B levels, which are associated with learning and memory formation. As a result of our analysis, there was no change in NR1, NR2A, and nAChRa7 receptor concentrations and NR2A and nAChRa7 receptor mRNA levels in the NOAEL dose group compared to the control group, while a significant increase was observed in phospho-Tyr1472 NR2B receptor concentration and NR2B mRNA level. Decreased NMDARs, particularly NR2B subunits, are thought to contribute to memory impairment [27]. On the other hand, increased expression of the NR2B subunit has been shown to enhance spatial learning and memory [28]. Especially phospho-Tyr1472 NR2B could increase in the hippocampus after induction of long-term potentiation [29]. NaB is also an inhibitor of D-amino acid oxidase (DAAO), which oxidatively deaminates D-amino acids. D-serine is one of the D-amino acids found in the CNS and is a coagonist of NMDARs. Also, it is involved in NMDAR activation [30]. So decreased D-serine levels may be associated with down-regulated NMDAR levels [31]. In addition, D-serine itself could increase the expression of NMDARs [32]. Therefore, in our study, NaB may have upregulated NR2B expression via increasing D-serine levels. Also, NaB is being tested as a drug in the early stage of AD because it increases NMDAR activity and improves cognitive function [33]. Moreover, in an animal AD model, Modi et al. showed that NaB may decrease hippocampal oxidative stress and protect memory and learning [13].
But in healthy mice, administration of NaB at dosages of 0.56, 1.125, and 2.25 mg/mL for four weeks, elevated oxidative stress in the brain and impaired memory and motor functions [34]. Also, increased activation of NMDARs is involved in the etiopathology of epileptic seizures, neuronal damage, and excitotoxic cell death [35]. Therefore, NaB may have beneficial effects in the case of AD but may show unexpected and/or harmful effects in the healthy condition.
Conclusions
In light of our findings, exposure to NaB in childhood may affect neurobehavior and the learning process. According to the evaluations of neuro-behavioral tests, it was found that increased anxiety and decreased motivation and attention in prepubertal rats with the ADI dosage of NaB. This may be remarkable considering that the dose of ADI can be consumed daily by children.
In addition, an increase in NR2B receptor expression was detected in the NOAEL group. Although this finding is remarkable, we do not know whether this change will have a positive or negative impact on learning and memory processes. However, since children have a sensitive neurological system, limiting NaB-containing foods and beverages may be reasonable, especially in children with neurological disorders.
Funding source: Suleyman Demirel University
Award Identifier / Grant number: 4501-TU2-15
-
Research funding: This study was supported by the Scientific Research Projects Coordination Unit of Suleyman Demirel University with project no. 4501-TU2-15.
-
Author contributions: All authors have accepted responsibility for the entire content of this manuscript and approved its submission.
-
Competing interests: Authors state no conflict of interest.
-
Informed consent: There is no need to get informed consent within the scope of this study.
-
Ethical approval: The animal experiments were approved by the local animal ethics committee of Suleyman Demirel University (Ethic No: 18.06.2015/06–14). The experiment was conducted according to the recommendations for animal care and experimentation of the relevant European Communities Council Directive (86/609/EEC).
References
1. EFSA. Scientific Opinion on the re-evaluation of benzoic acid (E 210), sodium benzoate (E 211), potassium benzoate (E 212), and calcium benzoate (E 213) as food additives: European Food Safety Authority. Available from: https://efsa.onlinelibrary.wiley.com/doi/epdf/10.2903/j.efsa.2016.4433 [Accessed 8 Jul 2022].Search in Google Scholar
2. Walczak-Nowicka, ŁJ, Herbet, M. Sodium Benzoate—harmfulness and potential use in therapies for disorders eelated to the nervous system: a review. Nutrients 2022;14:1497. https://doi.org/10.3390/nu14071497.Search in Google Scholar PubMed PubMed Central
3. Olmo, AD, Calzada, J, Nuñez, M. Benzoic acid and its derivatives as naturally occurring compounds in foods and as additives: uses, exposure, and controversy. Crit Rev Food Sci Nutr 2017;57:3084–103. https://doi.org/10.1080/10408398.2015.1087964.Search in Google Scholar PubMed
4. Maines, E, Urru, S, Burri, E, Piccoli, G, Pedrolli, A, Pasqualini, A, et al.. Formulation and clinical evaluation of sodium benzoate oral solution for the treatment of urea cycle disorders in pediatric patients. AAPS PharmSciTech 2020;21:1–8. https://doi.org/10.1208/s12249-020-01642-y.Search in Google Scholar PubMed
5. Vandevijvere, S, Andjelkovic, M, Wil, MD, Vinkx, C, Huybrechts, I, Van Loco, J, et al.. Estimate of intake of benzoic acid in the Belgian adult population. Food Addit Contam Part A Chem Anal Control Expo Risk Assess 2009;26:958–68. https://doi.org/10.1080/02652030902858939.Search in Google Scholar PubMed
6. Darch, M, Martyn, D, Ngo, K, Jack, MM. An updated estimate of benzoate intakes from non-alcoholic beverages in Canada and the United States. Food Addit Contam Part A Chem Anal Control Expo Risk Assess 2021;38:701–17. https://doi.org/10.1080/19440049.2020.1859624.Search in Google Scholar PubMed
7. Acar, A. Therapeutic effects of royal jelly against sodium benzoate–induced toxicity: cytotoxic, genotoxic, and biochemical assessment. Environ Sci Pollut Res Int 2021;28:34410–25. https://doi.org/10.1007/s11356-021-13172-6.Search in Google Scholar PubMed
8. Piper, JD, Piper, PW. Benzoate and sorbate salts: a systematic review of the potential hazards of these invaluable preservatives and the expanding spectrum of clinical uses for sodium benzoate. Compr Rev Food Sci Food Saf 2017;16:868–80. https://doi.org/10.1111/1541-4337.12284.Search in Google Scholar PubMed
9. Stevens, LJ, Kuczek, T, Burgess, JR, Hurt, E, Arnold, LE. Dietary sensitivities and ADHD symptoms: thirty-five years of research. Clin Pediatr 2011;50:279–93. https://doi.org/10.1177/0009922810384728.Search in Google Scholar PubMed
10. McCann, D, Barrett, A, Cooper, A, Crumpler, D, Dalen, L, Grimshaw, K, et al.. Food additives and hyperactive behaviour in 3-year-old and 8/9-year-old children in the community: a randomised, double-blinded, placebo-controlled trial. Lancet 2007;370:1560–7. https://doi.org/10.1016/s0140-6736(07)61306-3.Search in Google Scholar PubMed
11. Tsay, HJ, Wang, YH, Chen, WL, Huang, MY, Chen, YH. Treatment with sodium benzoate leads to malformation of zebrafish larvae. Neurotoxicol Teratol 2007;29:562–9. https://doi.org/10.1016/j.ntt.2007.05.001.Search in Google Scholar PubMed
12. Jana, A, Modi, KK, Roy, A, Anderson, JA, van Breemen, RB, Pahan, K. Up-regulation of neurotrophic factors by cinnamon and its metabolite sodium benzoate: therapeutic implications for neurodegenerative disorders. J Neuroimmune Pharmacol 2013;8:739–55, https://doi.org/10.1007/s11481-013-9447-7.Search in Google Scholar PubMed PubMed Central
13. Modi, KK, Roy, A, Brahmachari, S, Rangasamy, SB, Pahan, K. Cinnamon and its metabolite sodium benzoate attenuate the activation of p21rac and protect memory and learning in an animal model of Alzheimer’s disease. PLoS One 2015;10:e0130398. https://doi.org/10.1371/journal.pone.0130398.Search in Google Scholar PubMed PubMed Central
14. Pfeifer, JH, Allen, NB. Puberty initiates cascading relationships between neurodevelopmental, social, and internalizing processes across adolescence. Biol Psychiatr 2021;89:99–108. https://doi.org/10.1016/j.biopsych.2020.09.002.Search in Google Scholar PubMed PubMed Central
15. Botteron, KN. It’s complicated: adrenarcheal and pubertal hormonal influence on brain development. J Am Acad Child Adolesc Psychiatry 2020;59:699–700. https://doi.org/10.1016/j.jaac.2020.04.007.Search in Google Scholar PubMed
16. Shoaff, JR, Coull, B, Weuve, J, Bellinger, DC, Calafat, AM, Schantz, SL, et al.. Association of exposure to endocrine-disrupting chemicals during adolescence with attention-deficit/hyperactivity disorder–related behaviors. JAMA Netw Open 2020;3:e2015041. https://doi.org/10.1001/jamanetworkopen.2020.15041.Search in Google Scholar PubMed PubMed Central
17. Sengupta, P. The laboratory rat: relating its age with human’s. Int J Prev Med 2013;4:624–30.Search in Google Scholar
18. Morris, R. Developments of a water-maze procedure for studying spatial learning in the rat. J Neurosci Methods 1984;11:47–60. https://doi.org/10.1016/0165-0270(84)90007-4.Search in Google Scholar PubMed
19. Doguc, DK, Deniz, F, İlhan, İ, Ergonul, E, Gultekin, F. Prenatal exposure to artificial food colorings alters NMDA receptor subunit concentrations in rat hippocampus. Nutr Neurosci 2021;24:784–94. https://doi.org/10.1080/1028415x.2019.1681065.Search in Google Scholar
20. Doguc, DK, Aylak, F, Ilhan, I, Kulac, E, Gultekin, F. Are there any remarkable effects of prenatal exposure to food colourings on neurobehaviour and learning process in rat offspring? Nutr Neurosci 2015;18:12–21. https://doi.org/10.1179/1476830513y.0000000095.Search in Google Scholar
21. FSAN. The 21st Australian total diet study. A total diet study of sulphites, benzoates and sorbates: Food Standards Australia New Zealand. Available from: https://www.foodstandards.gov.au/publications/documents/21st%20ATD%20Study%20report-Aug051.pdf [Accessed 8 Jul 2022].Search in Google Scholar
22. Mischek, D, Krapfenbauer-Cermak, C. Exposure assessment of food preservatives (sulphites, benzoic and sorbic acid) in Austria. Food Addit Contam Part A Chem Anal Control Expo Risk Assess 2012;29:371–82. https://doi.org/10.1080/19440049.2011.643415.Search in Google Scholar PubMed
23. Bateman, B, Warner, JO, Hutchinson, E, Dean, T, Rowlandson, P, Gant, C, et al.. The effects of a double blind, placebo controlled, artificial food colourings and benzoate preservative challenge on hyperactivity in a general population sample of preschool children. Arch Dis Child 2004;89:506–11. https://doi.org/10.1136/adc.2003.031435.Search in Google Scholar PubMed PubMed Central
24. Beezhold, BL, Johnston, CS, Nochta, KA. Sodium benzoate–rich beverage consumption is associated with increased reporting of ADHD symptoms in college students: a pilot investigation. J Atten Disord 2014;18:236–41. https://doi.org/10.1177/1087054712443156.Search in Google Scholar PubMed
25. Noorafshan, A, Erfanizadeh, M, Karbalay-Doust, S. Sodium benzoate, a food preservative, induces anxiety and motor impairment in rats. Neurosciences 2014;19:24–8.Search in Google Scholar
26. Vandenberg, LN, Colborn, T, Hayes, TB, Heindel, JJ, Jacobs, DRJr, Lee, DH, et al.. Hormones and endocrine-disrupting chemicals: low-dose effects and nonmonotonic dose responses. Endocr Rev 2012;33:378–455. https://doi.org/10.1210/er.2011-1050.Search in Google Scholar PubMed PubMed Central
27. Ieraci, A, Herrera, DG. Early postnatal ethanol exposure in mice induces sex-dependent memory impairment and reduction of hippocampal NMDA-R2B expression in adulthood. Neuroscience 2020;427:105–15. https://doi.org/10.1016/j.neuroscience.2019.11.045.Search in Google Scholar PubMed
28. Zhu, L, Yang, L, Zhao, X, Liu, D, Guo, X, Liu, P, et al.. Xanthoceraside modulates NR2B-containing NMDA receptors at synapses and rescues learning-memory deficits in APP/PS1 transgenic mice. Psychopharmacology 2018;235:337–49. https://doi.org/10.1007/s00213-017-4775-6.Search in Google Scholar PubMed
29. Nakazawa, T, Komai, S, Tezuka, T, Hisatsune, C, Umemori, H, Semba, K, et al.. Characterization of Fyn-mediated tyrosine phosphorylation sites on GluRε2 (NR2B) subunit of the N-methyl-D-aspartate receptor. J Biol Chem 2001;276:693–9. https://doi.org/10.1074/jbc.m008085200.Search in Google Scholar PubMed
30. Lin, CH, Chen, PK, Chang, YC, Chuo, LJ, Chen, YS, Tsai, GE, et al.. Benzoate, a D-amino acid oxidase inhibitor, for the treatment of early-phase Alzheimer disease: a randomized, double-blind, placebo-controlled trial. Biol Psychiatr 2014;75:678–85. https://doi.org/10.1016/j.biopsych.2013.08.010.Search in Google Scholar PubMed
31. Wang, Y, Yang, X, Yu, H, Wang, H, Qi, Y, Geng, M. Effects of arsenic exposure on d-serine metabolism in the hippocampus of offspring mice at different developmental stages. Arch Toxicol 2020;94:77–87. https://doi.org/10.1007/s00204-019-02616-1.Search in Google Scholar PubMed
32. Gustafson, EC, Morgans, CW, Tekmen, M, Sullivan, SJ, Esguerra, M, Konno, R, et al.. Retinal NMDA receptor function and expression are altered in a mouse lacking D-amino acid oxidase. J Neurophysiol 2013;110:2718–26. https://doi.org/10.1152/jn.00310.2013.Search in Google Scholar PubMed PubMed Central
33. Lin, CH, Chen, PK, Wang, SH, Lane, HY. Effect of sodium benzoate on cognitive function among patients with behavioral and psychological symptoms of dementia: secondary analysis of a randomized clinical trial. JAMA Netw Open 2021;4:e216156. https://doi.org/10.1001/jamanetworkopen.2021.6156.Search in Google Scholar PubMed PubMed Central
34. Khoshnoud, MJ, Siavashpour, A, Bakhshizadeh, M, Rashedinia, M. Effects of sodium benzoate, a commonly used food preservative, on learning, memory, and oxidative stress in brain of mice. J Biochem Mol Toxicol 2018;32:e22022. https://doi.org/10.1002/jbt.22022.Search in Google Scholar PubMed
35. Zhou, M, Baudry, M. Developmental changes in NMDA neurotoxicity reflect developmental changes in subunit composition of NMDA receptors. J Neurosci 2006;26:2956–63. https://doi.org/10.1523/jneurosci.4299-05.2006.Search in Google Scholar
© 2022 the author(s), published by De Gruyter, Berlin/Boston
This work is licensed under the Creative Commons Attribution 4.0 International License.
Articles in the same Issue
- Frontmatter
- Opinion Paper
- Ischemia – modified albumin by albumin cobalt binding test: a false myth or reality
- Research Articles
- Machine learning models can predict the presence of variants in hemoglobin: artificial neural network-based recognition of human hemoglobin variants by HPLC
- Investigation of the preanalytical process practices in primary care in Istanbul regarding the newborn screening tests
- Cell counting chamber vs. Sysmex XN-1000 for determining white blood cell count and differentiation for body fluids
- Synthesis of PEITC-loaded gold nanoparticles and evaluation of the hepatoprotective effect on CCl4-induced damage through Nrf2 pathway
- Concentrations of B cell-activating factor, aquaporin-4 antibody and brain-derived neurotrophic factor in neuromyelitis optica spectrum disorder
- Macula, choroid and retinal nerve fiber layer optical coherence tomography biomarkers in liver dysfunction
- Direct-acting antiviral therapy may help restore HCV-induced impaired redox balance and liver fibrosis process
- Are VEGF and SCUBE1 gene expressions increased in diabetic retinopathy?
- Biochemical analysis of microbiotas obtained from healthy, prediabetic, type 2 diabetes, and obese individuals
- Inflammation parameters, monocyte subgroups and toll-like receptor expression before and after dialysis in patients with chronic kidney disease
- Matrix metalloproteinase 9 gene-MMP9-DNA methylation status in Turkish schizophrenia patients
- HLA DRB1 alleles, IFN-γ and TGF-β Gene Variants in childhood ALL patients
- Epithelial-mesenchymal transition as a potential route for DAPT resistance in breast cancer cells
- Comparison with molecular effects of ukrain, tamoxifen, and docetaxel on human breast cancer cell lines
- In vitro evaluation of 2-pyrazoline derivatives as DPP-4 inhibitors
- Effects of polyphenolic-rich extracts from Citrus hystrix on proliferation and oxidative stress in breast and colorectal cancer
- The effects of sodium benzoate exposure on learning and neurobehavior during the prepubertal period in rats
- The association between βeta 2-microglobulin and bronchopulmonary dysplasia