Neutralizing antibody response and associated factors in Coronavirus-19 disease (COVID-19) up to one month
-
Aliye Bastug
 ,
Hurrem Bodur
,
Urartu Ozgur Safak Seker
,
Nazlican Filazi
,
Omer Aydos
,
Ebru Sahin Kehribar
,
Ali Reza Hanifehnezhad
,
Sumeyye Kazancioglu
,
Recep Erdem Ahan
,
Volkan Aslan
,
Banu Cakir
,
Ahmet Sertcelik
and
Aykut Ozkul
,
Hurrem Bodur
,
Urartu Ozgur Safak Seker
,
Nazlican Filazi
,
Omer Aydos
,
Ebru Sahin Kehribar
,
Ali Reza Hanifehnezhad
,
Sumeyye Kazancioglu
,
Recep Erdem Ahan
,
Volkan Aslan
,
Banu Cakir
,
Ahmet Sertcelik
and
Aykut Ozkul

Abstract
Background
There is a knowledge gap about the characteristics of neutralizing antibody (NAb) response in patients who recovered COVID-19. In this study, it is aimed to elucidate the factors affecting the presence and titers of antibodies up to 30-days after onset.
Material and methods
A total of 129 laboratory-confirmed COVID-19 patients were enrolled. Clinical data were obtained retrospectively. SARS-CoV-2 specific NAb, IgM, and IgG antibody responses were analyzed.
Results
SARS-CoV-2 specific NAb, IgM and IgG, were detected at the time of hospital discharge in 60.5%, 30.2%, and 51.9% of the patients, respectively. The median time for obtaining serum samples for antibody tests after symptoms’ onset was 11 days. The median titer of neutralizing antibody (SN50) was significantly higher in severe patients (25 vs. 7.5, p=0.009). Of the 23 severe patients, 52.2% (n=12) had higher NAb titers (i.e., SN50≥1:25) when compared to that in non-severe patients (OR=2.89; 95%CI=1.15–7.28, p=0.021), yet, the potential effect of follow-up time on NAb status and titers could not be ruled out.
Conclusions
The presence of antibody response is not the only determinative factor for recovery. The presence and higher titers of NAb were detected more in severe patients than their non-severe counterparts. Survival analysis suggested that this difference could at least be partially explained by the length of follow-up through antibody testing (at discharge) after symptoms’ onset.
Öz
Amaç
COVID-19’ dan iyileşen hastalarda nötralize edici antikor (NAb) yanıtının karakteristikleri hakkında bilgi eksikliği bulunmaktadır. Bu çalışmada, hastalık başlangıcından 30 gün sonrasına kadar geçen dönemde, antikor yanıtı ve antikor titresi üzerine etkili olabilecek faktörlerin belirlenmesi amaçlandı.
Gereç ve Yöntem
Çalışmaya laboratuvar tarafından kanıtlanmış toplam 129 COVID-19 hastası dahil edildi. Klinik veriler retrospektif olarak elde edildi. SARS-CoV-2 spesifik NAb, IgM, ve IgG antikor yanıtları analiz edildi.
Bulgular
Hastaneden taburculuk sırasında, hastaların sırasıyla %60,5’i, %30,2’si ve %51.9’unda SARS-CoV-2’ye özgü NAb, IgM ve IgG tespit edildi. Semptomların başlangıcından sonra, antikor testleri için serum numunelerinin alınmasına kadar geçen ortanca süre 11 gün idi. Nötralize edici antikor (SN50) ortanca titresi, şiddetli hastalığa sahip hastalarda anlamlı derecede daha yüksek saptandı (7.5’e karşı 25, p = 0.009). Şiddetli hastalığa sahip 23 hastanın %52.2’si (n = 12), şiddetli hastalığa sahip olmayanlara kıyasla daha yüksek NAb titresine (SN50 ≥ 1:25) sahipti (OR = 2.89; %95 CI = 1.15–7.28, p = 0.021), ancak takip süresinin NAb yanıtı ve titresi üzerine potansiyel etkisi göz ardı edilemez.
Sonuç
Antikor yanıtının varlığı, iyileşme için tek belirleyici faktör değildir. Şiddetli hastalığa sahip olan hastalarda NAb yanıtı ve titresi diğerlerine kıyasla daha yüksek saptandı. Sağkalım analizi, bu farkın en azından kısmen, semptom başlangıcından sonra antikor test zamanına (taburculuk) kadar geçen sürenin etkisi ile açıklanabileceğini düşündürmektedir.
Introduction
COVID-19 pandemic threatens global public health with heavy economic/social impacts. The protective immune response elicited by primary infection is crucial to prevent re-infection. Limited information is available about the elicited protective immunity by SARS-CoV-2. In an animal study, acquired immunity due to primary infection with SARS-CoV-2 presented protection against subsequent infections [1]. Although humoral antibodies in recovered COVID-19 patients have been reported, the titers were very low in some patients [2, 3].
Neutralizing antibodies (NAbs) are crucial components of protective immunity. The S-protein is the main determinant of SARS-CoV-2 infection, responsible for viral attachment, fusion, and entry into host cells [4]. Conventional virus-neutralizing assay (VNA) is the gold standard for determining NAbs [5].
The dynamics of NAb titers in COVID-19 and its association with clinical severity may have a significant impact on predictions about protective use of convalescent serum, implementation of plasma therapies, and effectiveness of vaccines. A case series of 129 laboratory-confirmed COVID-19 patients, subsequently hospitalized between March 15 and April 30, 2020, were investigated retrospectively in a tertiary care university hospital. Indirect enzyme-linked immunosorbent assay (ELISA) and VNA results at the time of hospital discharge were used in the analyses. The primary aim of the present study was to determine the factors affecting the presence and titers of antibodies up to 30-days after the onset of symptoms. The secondary aim was to compare in-house ELISA test results and VNA results and determine the ELISA kit’s sensitivity and specificity.
Materials and methods
Ethical statement
Official permission was obtained from the Ministry of Health, and the Ethical Committee approved the study protocol of Ankara City Hospital (E1-20-532,7.5.2020).
Study design and participants
Data from 129 adult COVID-19 patients admitted to Ankara City Hospital. All participants met the diagnostic criteria according to WHO interim guidance [6] (Figure 1).
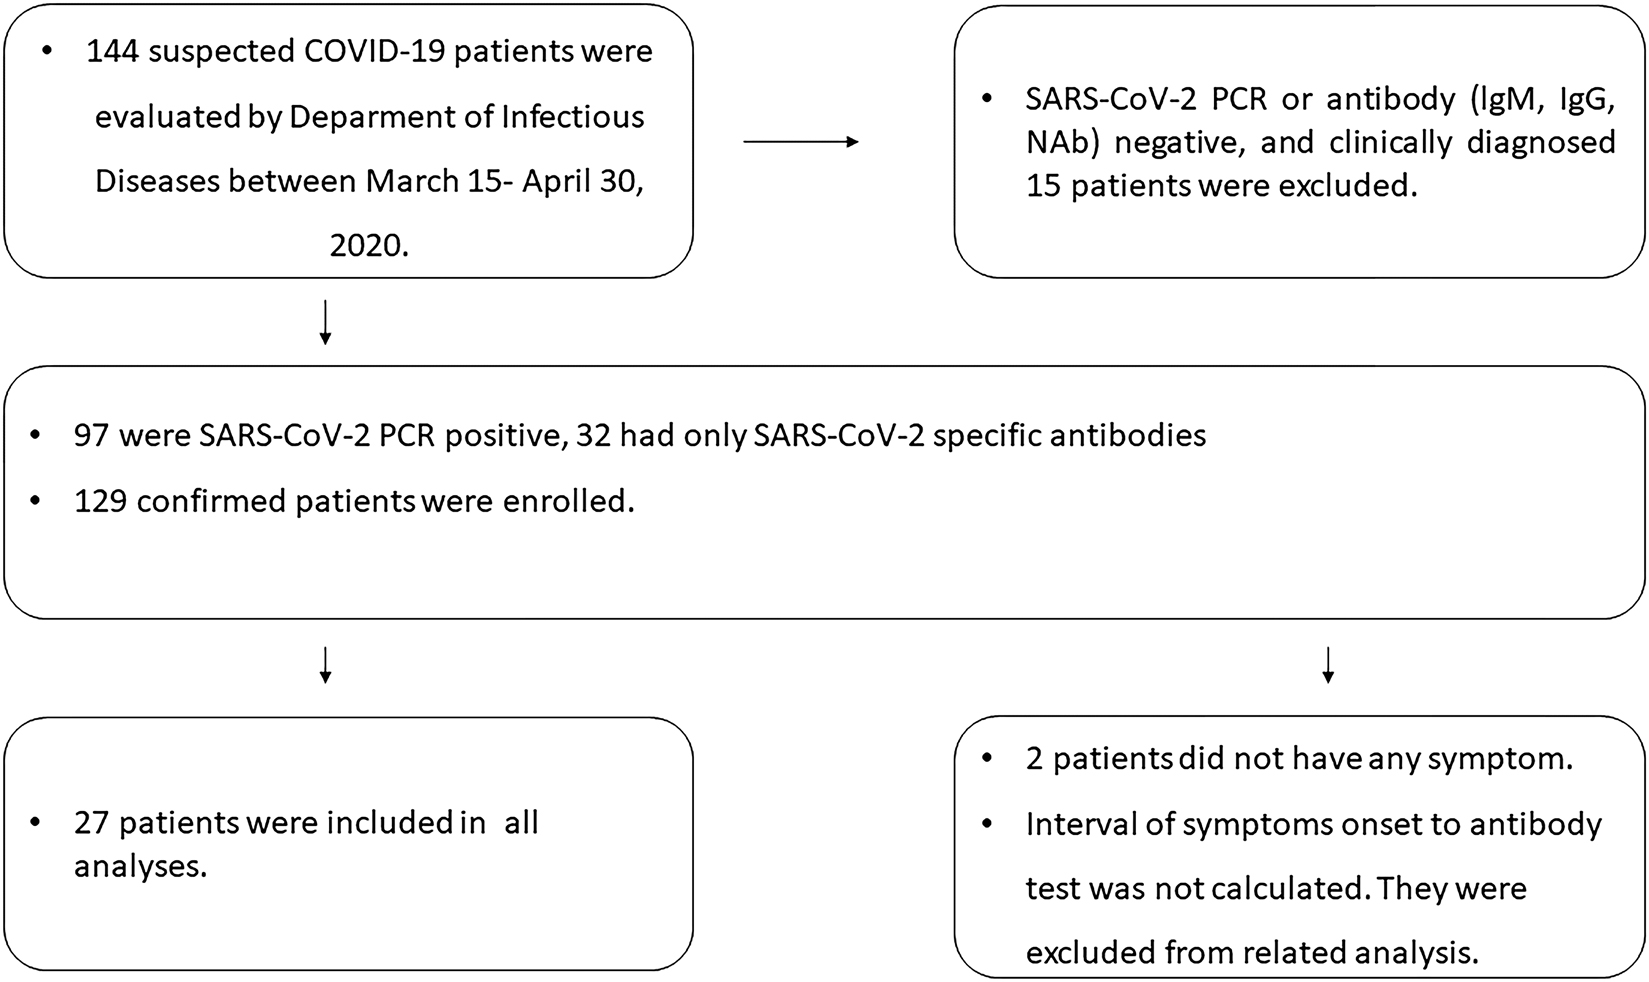
Flowchart of the study.
Demographic, clinical, chest computer tomography (CT) findings, oro/nasopharyngeal swab sample RT-PCR results for SARS-CoV-2 were extracted from electronic medical records and case follow-up forms.
Two patients were asymptomatic at admission and were excluded in analyses based on the time from symptoms to testing. Patients were classified as severe and non-severe cases according to the National Institutes of Health (NIH) classification, in assessing whether severity was associated with immunological response [7].
Serum samples were obtained from patients on the day of hospital discharge to analyze antibody response. SARS-CoV-2 IgG was analyzed in sera samples using ELISA. The presence and titers of NAbs were analyzed with VNA. The cut-off for NAb positivity was 1:5, and it was used for comparing NAb positive and negative patients. The median NAb titer detected in this study (1:25) was used to compare patients with higher and lower titers (patients with 1:25 or higher vs. lower titers) to determine the potential factors that may elicit higher NAb titers.
The time from symptoms onset to collection of serum samples was recorded for each patient for statistical analyses. Before performing the tests, the serum samples were heat inactivated at 56 °C for 30 min and stored at −20 °C until used.
To determine the factors affecting the presence of antibodies in the early convalescent period, NAbs-positive patients were compared with NAbs-negative ones. Additionally, patients with higher and lower titers of NAbs were compared to elucidate the factors that may have an impact on eliciting higher NAb titers.
Production of in-house ELISA for detection of SARS-CoV-2 IgG and IgM
The receptor-binding domain (RBD) of SARS-CoV-2 (MN908947) spike protein was expressed in the HEK-293T cells (ATCC® CRL-3216), purified, and used as the ELISA antigen. The details about the production method of recombinant RBD-antigen for in-house ELISA tests are summarized in Supplementary file 1 [8]. For negative controls (NCs) in tests, serum samples from nine healthy volunteers were randomized into 3 groups and pooled to obtain 3 different NC samples. Each patient sample and the NC material were assayed in triplicates, and means of absorbance values were used for interpretation. The samples with mean optical densities (ODs) equal to or greater than 0.22 were evaluated positive, and negative were equal to or less than 0.18. OD values between these values were deemed indeterminate.
Virus neutralization assay (VNA)
VNA was performed in microtiter plates as described by Hanifehnezhad et al. [9]. Briefly, two-fold diluted serum samples, starting from 1:5 (the threshold dilution for positivity), were mixed with an equal volume of 100TCID50 SARS-CoV-2 Ank1 isolate (1:10,000) in quadruplicates and incubated for 1h at 37 °C for neutralization. The serum–virus mixtures were subsequently inoculated onto 90% confluent Vero E6 cells grown in 96-well plates. VNA was evaluated via an inverted microscope when 100% cytopathic effect (CPE) was observed in virus control wells. Seroconversion detected in 1:5 dilution of test serums was accepted as the threshold. The positive serum samples were subsequently five-fold diluted starting from 1:10 dilution. The mean NAb titer was taken as the dilution factor in which 50% of the infection of the 100TCID50 virus was blocked. For instance, if the virus-neutralization was recorded 0/4 in 1:5 dilution and 4/4 in 1:10 dilution, the mean NAb titer (SN50) of the given virus was accepted as 1:7.5.
Statistically calculated median NAb titer of the patients detected in this study (1:25) was used in the comparison of the patients. To determine the “median” NAb titer, NAb titers of the individuals were ranked from the lowest to the highest. The value of the middle observation was taken in cases for odd number of observations, and the arithmetic average of the two observations in the middle was taken for an even number of observations.
VNA was accepted as a reference test for validity analysis. Sensitivities and specificities of lgM and lgG ELISA tests were calculated with the following formulas: sensitivity=(number of lgG or IgM, and NAbs positives)/number of NAbs positives with VNA) × 100, specificity=(number of lgG or IgM, and NAbs negatives/number of NAbs positives with VNA) × 100.
Statistical analysis
Statistical analyses were performed using SPSS v.21.0 (Armonk, NY, USA). The Kolmogorov–Smirnov test was performed to check the normality of the variables. Descriptive analysis was presented using mean ± SD for normally distributed variables and median (minimum–maximum) for non-normally distributed variables. Demographic and laboratory data were compared with the student’s t-test for parametric and the Mann–Whitney U test for non-parametric variables. Comparisons for categorical variables were executed using the Chi-square test or Fisher’s exact test. Kruskal Wallis test was used for comparisons of more than two groups.
The odds ratio is defined as the odd that an outcome may occur given a particular exposure compared to the odds of the outcome occurring in the absence of that exposure.
The rate ratios and confidence intervals were calculated using the “rate ratio. test” package in the R software (version 3.6.1).
Potential associations between disease severity and the NAb status were studied using the Kaplan–Meier analysis via the time through the date of hospital discharge (i.e., time of testing).
Distributions of NAb titers among different patient sub-categories were analyzed with Mann–Whitney U test and plotted by GraphPad Prism version 9 (GraphPad Software, San Diego, California, USA). Statistical significance was defined as p<0.05.
Results
Clinical and radiological characteristics of COVID-19 patients
All patients had chest CT findings and/or concordant symptoms for SARS-CoV-2 infection, in addition to laboratory confirmation with a positive PCR (n=97, 75.2%) and/or antibody tests (n=111, 86%). The mean age of the patients was 46.4 ± 15.8 years, and 54.3% of them were male. The median length of hospital stay was 7 days (min–max: 1–24 days). NAb positivity was significantly higher on admission in patients with fever (69.5%, Chi-Square test, p=0.05) and dyspnea (74.3%, chi-square test, p=0.05) (Table1).
Demographic, clinical, and radiologic characteristics of the patients with COVID-19.
| Total n=129 (%)## | NAbs positive patients n=78 (%)# | NAbs negative patients n=51 (%)# | P value& | SN50≥1:25 n=41 (%)# | SN50 < 1:25 n = 88 (%)# | P value&& | |
|---|---|---|---|---|---|---|---|
| Age, mean ± SD, years | 46.4 ± 15.8 | 48.1 ± 14.7 | 44 ± 17.5 | >0.05 | 49.7 ± 16.4 | 44.9 ± 16.4 | 0.076 |
| Male gender | 70 (54.3) | 45 (64.3) | 25 (35.7) | >0.05 | 27 (38.6) | 43 (61.4) | 0.07 |
| Healthcare professional | 10 (7.8) | 5 (50.0) | 5 (50.0) | >0.05 | 2 (20.0) | 8 (80.0) | >0.05 |
| PCR confirmation | 97 (75.2) | 55 (56.7) | 42 (43.3) | >0.05 | 25 (25.8) | 72 (74.2) | 0.011 |
|
|
|||||||
| IgG antibody | |||||||
|
|
|||||||
| Positive | 67 (51.9) | 53 (79.1) | 14 (20.9) | <0.001 | 37 (55.2) | 30 (44.8) | <0.001 |
| Negative | 59 (45.7) | 22 (37.3) | 37 (62.7) | 2 (3.4) | 57 (96.6) | ||
| Indeterminate | 3 (2.3) | 3 (100.0) | — | 2 (66.7) | 1 (33.3) | ||
|
|
|||||||
| IgM antibody | |||||||
|
|
|||||||
| Positive | 39 (30.2) | 37 (94.9) | 2 (5.1) | <0.001 | 28 (71.8) | 11 (28.2) | <0.001 |
| Negative | 88 (68.2) | 39 (44.3) | 49 (55.7) | 13 (14.8) | 75 (85.2) | ||
| Indeterminate | 2 (1.6) | 2 (100.0) | — | — | 2 (100.0) | ||
| NAbs titer (SN50), median (min–max) | 7.5 (0–1250) | 25 (5–1250) | — | 25 (25–1250) | 0 (0–10) | <0.001 | |
| Severe patients | 23 (100.0) | 18 (78.3) | 5 (21.7) | 0.05 | 12 (52.2) | 11 (47.8) | 0.021 |
| Non-severe patients | 106 (100.0) | 60 (56.6) | 46 (43.4) | 29 (27.4) | 77 (72.6) | ||
| Onset of symptoms to antibody test*, median day (min–max) | 11 (5–28) | 12 (5–28) | 8 (5–22) | <0.001 | 12 (7–28) | 9 (5–23) | <0.001 |
| Abnormalities on chest CT | 111 (86) | 74 (66.7) | 37 (33.3) | <0.001 | 41 (36.9) | 70 (43.1) | <0.001 |
| Early stage** | 75 (58.1) | 46 (61.3) | 29 (38.7) | 0.012 | 23 (30.7) | 52 (69.3) | 0.012 |
| Advanced stage*** | 36 (35.2) | 28 (77.8) | 8 (22.2) | 18 (50.0) | 18 (50.0) | ||
| The onset of symptom to hospital admission*, median day (min-max) | 5 (0–15) | 5 (1–15) | 4 (0–14) | 0.05 | 6 (1–15) | 5 (0–15) | >0.05 |
| Length of hospital stay, median day (min-max) | 7 (1–24) | 8 (3–24) | 7 (1–15) | 0.012 | 8 (3–24) | 7 (1–16) | 0.046 |
| ICU requirement (n=9) | 9 (7) | 8 (88.9) | 1 (11.1) | 0.087 | 5 (55.6) | 4 (44.4) | >0.05 |
| APACHE II score, median (min–max) | 6 (3–40) | 8 (3–40) | 3 | >0.05 | 10 (3–11) | 4.5 (3–40) | >0.05 |
| Comorbidity | 40 (31.0) | 24 (60.0) | 16 (40.0) | >0.05 | 12 (30.0) | 28 (70.0) | >0.05 |
| Diabetes | 11 (8.5) | 8 (72.7) | 3 (27.3) | >0.05 | 4 (36.4) | 7 (63.6) | >0.05 |
| Hypertension | 26 (20.2) | 16 (61.5) | 10 (38.5) | >0.05 | 9 (34.6) | 17 (65.4) | >0.05 |
| COPD | 10 (7.8) | 5 (50.0) | 5 (50.0) | >0.05 | 2 (20.0) | 8 (80.0) | >0.05 |
| Cardiovascular disease | 7 (5.4) | 4 (57.1) | 3 (42.9) | >0.05 | 2 (28.6) | 5 (71.4) | >0.05 |
| Respiratory rate (/min), median (min–max) | 22 (16–36) | 22 (16–28) | 22 (16–36) | >0.05 | 22 (18–36) | 22 (16–28) | <0.001 |
|
|
|||||||
| Sign and symptoms on hospital admission | |||||||
|
|
|||||||
| Asymptomatic | 2 (1.6) | 2 (100.0) | – | NA | 1 (50.0) | 1 (50.0) | NA |
| Fever | 59 (45.7) | 41 (69.5) | 18 (30.5) | 0.05 | 20 (33.9) | 39 (66.1) | >0.05 |
| Dry cough | 83(64.8) | 49 (59.0) | 34 (41.0) | >0.05 | 26 (31.3) | 57 (68.7) | >0.05 |
| Dyspnea | 35 (27.1) | 26 (74.3) | 9 (25.7) | 0.05 | 18 (51.4) | 17 (48.6) | 0.003 |
| Diarrhea | 7 (5.4) | 5 (71.4) | 2 (28.6) | >0.05 | 1 (14.3) | 6 (85.7) | >0.05 |
|
|
|||||||
| Oxygen support | |||||||
|
|
|||||||
| Nasal cannula | 28 (21.7) | 20 (71.4) | 8 (28.6) | >0.05 | 13 (46.4) | 15 (53.6) | 0.027 |
| High-flow nasal cannula | 1 (0.7) | 1 (100.0) | 0 | NA | 0 | 1 (100.0) | 0.035 |
| MV | 1 (0.7) | 1 (100.0) | 0 | NA | 1 (100.0) | 0 | – |
|
|
|||||||
| Treatment (single or combined) | |||||||
|
|
|||||||
| Chloroquine | 121 (93.8) | 75 (62.0) | 46 (38.0) | >0.05 | 39 (32.2) | 82 (67.8) | >0.05 |
| Favipiravir | 20 (15.5) | 13 (65.0) | 7 (35.0) | >0.05 | 8 (40.0) | 12 (60.0) | >0.05 |
| Oseltamivir | 29 (22.5) | 23 (79.3) | 6 (20.7) | >0.05 | 12 (41.4) | 17 (58.6) | >0.05 |
| Death | 1 (0.8) | 1 (100.0) | 0 | NA | 0 | 1 (100.0) | – |
-
Data are median (minimum value–maximum value) or n (%). #Row percentage, ##Line percentage, P values& comparing patients with NAbs positive and negative. P values&& comparing higher NAbs titers and lower NAbs titers. NA, non-applicable; NAbs, neutralizing antibodies; ICU, intensive care unit; COPD, chronic obstructive pulmonary disease; MV, mechanical ventilation; SN50, median NAbs titers. *Two asymptomatic patients could not be included in this analysis. **Single or multiple patchy ground glass opacities predominantly in the peripheral areas of the lungs, ***bilateral multi-lobar ground glass opacities, and consolidation.
Serum samples were obtained to test for antibodies against SARS-CoV-2. Patients were grouped for analyses into three, as 5–9, 10–14, and 15–28 days after symptom onset. The median time from onset of symptoms to antibody test was 11 days (5–28 days). It was median 9 days (5–23; min–max) in mild patients and median 15 days (7–28; min-max) in severe ones (Table2).
Comparison of demographic, clinical, and radiologic characteristics of the severe and non-severe patients with COVID-19.
| Total n=129 (%) | Severe n=23 (%) | Non-severe patients n=106 (%) | P value& | |
|---|---|---|---|---|
| Age, mean ± SD, years | 46.4 ± 15.8 | 60.9 ± 13.5 | 43.4 ± 14.7 | <0.001 |
| Male gender | 70 (54.3) | 13 (56.5) | 57 (53.8) | >0.05 |
| Healthcare professional | 10 (7.8) | 1 (4.3) | 9 (8.5) | >0.05 |
| PCR confirmation | 97 (75.2) | 18 (78.3) | 79 (74.5) | >0.05 |
| NAbs positivity | 78 (60.5) | 18 (78.3) | 60 (56.6) | 0.054 |
| NAbs titer (SN50), median (min–max) | 7.5 (0–1250) | 25 (0–1250) | 7.5 (0–1250) | 0.009 |
|
|
||||
| IgG antibody | ||||
|
|
||||
| Positive | 67 (51.9) | 19 (82.6) | 48 (45.3) | 0.006 |
| Negative | 59 (45.7) | 4 (17.4) | 55 (51.9) | |
| Indeterminate | 3 (2.3) | 0 | 3 (2.8) | |
| lgM antibody | ||||
| Positive | 39 (30.2) | 9 (39.1) | 30 (28.3) | 0.25 |
| Negative | 88 (68.2) | 13 (56.5) | 75 (70.8) | >0.05 |
| Indeterminate | 2 (1.6) | 1 (4.3) | 1 (0.9) | |
| The onset of symptoms to antibody test*, median day (min–max) | 11(5–28) | 15 (7–28) | 9 (5–23) | <0.001 |
NAb positivity was significantly higher in patients with abnormalities on chest CT (66.7% vs. 33.3%, chi-square test, p<0.001). Bilateral multi-lobar ground-glass opacities and consolidation on admission were determined in 35.2% of the patients. Patients with advanced stage abnormalities on chest CT (such as bilateral multi-lobar ground glass opacities and consolidation) had significantly higher NAb titers at hospital discharge (chi-square test, p=0.012) (Table1).
The distribution of NAb titers obtained in the discharge serum of the patients were plotted by age, gender, disease severity, and chest CT findings at the time of admission (Figure 2). Age and gender had no significant impact on NAb titers (Figure 2A and B). The median NAb titer (SN50) was 1:25 (interquartile range (IQR) 1:42.5) in severe patients and 1:7.5 (IQR 1:25) in non-severe counterparts (Mann–Whitney U test, p=0.008) (Figure 2C). The median NAb titers were 1:17.5 (IQR 1:20) and 1:7.5 (IQR 1:17.5) in patients with advanced and early stage findings on thorax CT, respectively (Figure 2D).
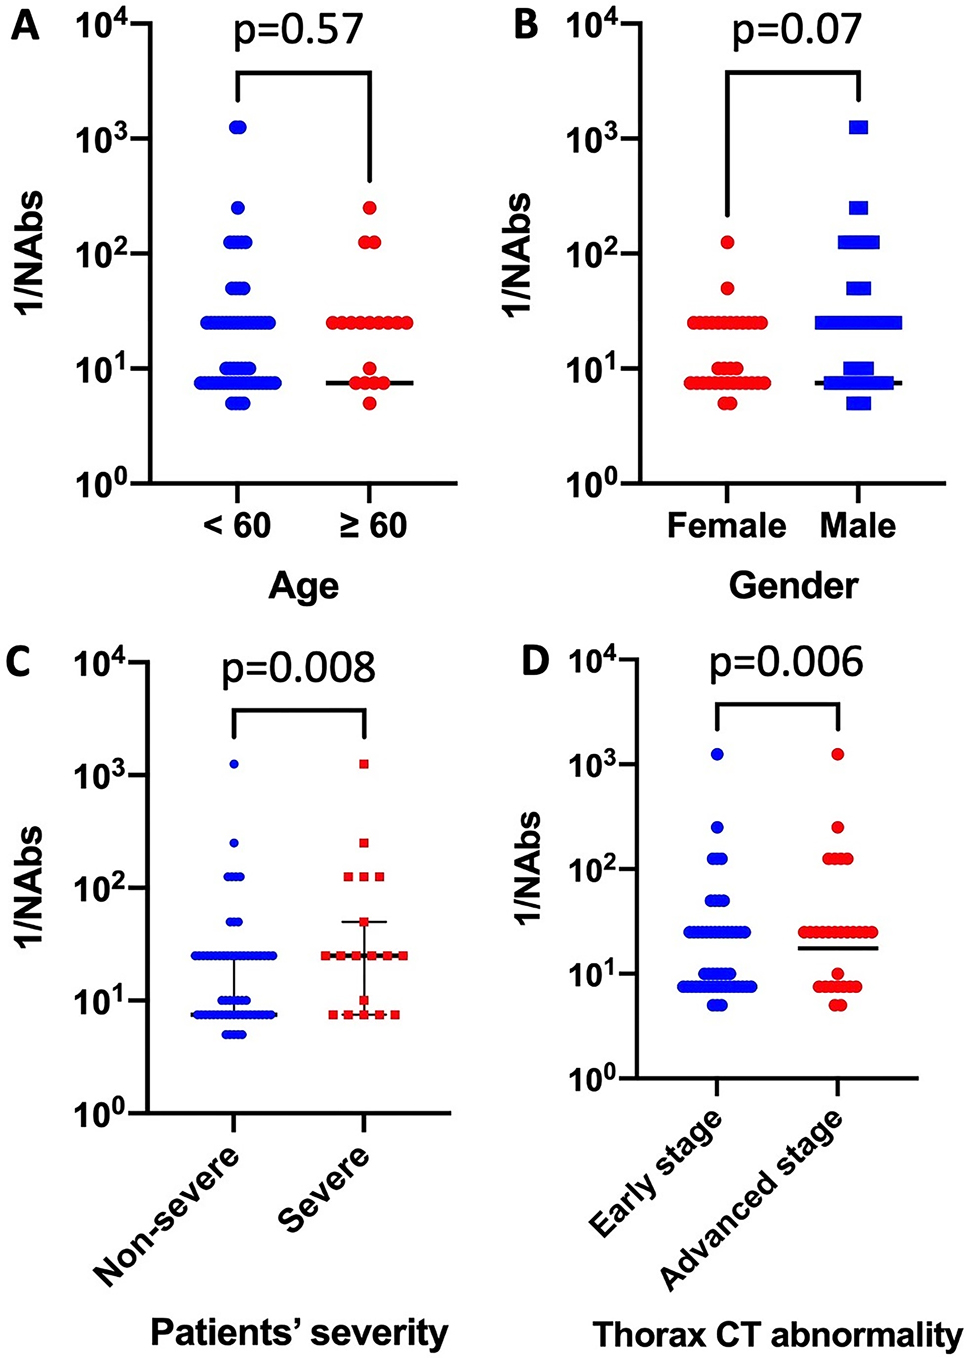
Distribution of neutralizing antibody titers against severe acute respiratory syndrome-Coronavirus-2 in different patient groups.
CT, computed tomography, NAb: neutralizing antibody.
Severe patients constituted 17.8% (n=23) of the total patients, of whom nine (39.1%) required ICU support during the follow up. The mean age of the severe and non-severe patients was 60.9 ± 13.5 and 43.4 ± 14.7 years, respectively (Student’s t-test, p<0.001) (Table2).
Seroconversion characteristics of NAbs, lgM, and IgG against SARS-CoV-2
The seroconversion rates at the time of hospital discharge were 60.5%, 30.2%, and 51.9% for NAb, lgM, and IgG, respectively. Using the VNA as the reference test, the sensitivity and the specificity of the IgG test was determined to be 67.9% and 72.5%, respectively. The median time to testing (discharge) were longer (12 vs. 8 days, Mann–Whitney U test, p<0.001) in the group with NAb positivity at discharge (Table 1). NAb positivity was significantly higher in samples obtained after ten days from symptom onset (10–14 days and 15–28 days were combined) than in samples obtained within ten days after onset (75% vs. 42.4%, respectively. chi-square test, p<0.001).NAb positivity was the highest (79.5%) among those who were tested 10–14 days after symptom onset (chi-Square test, p<0.001) (Figure 3).
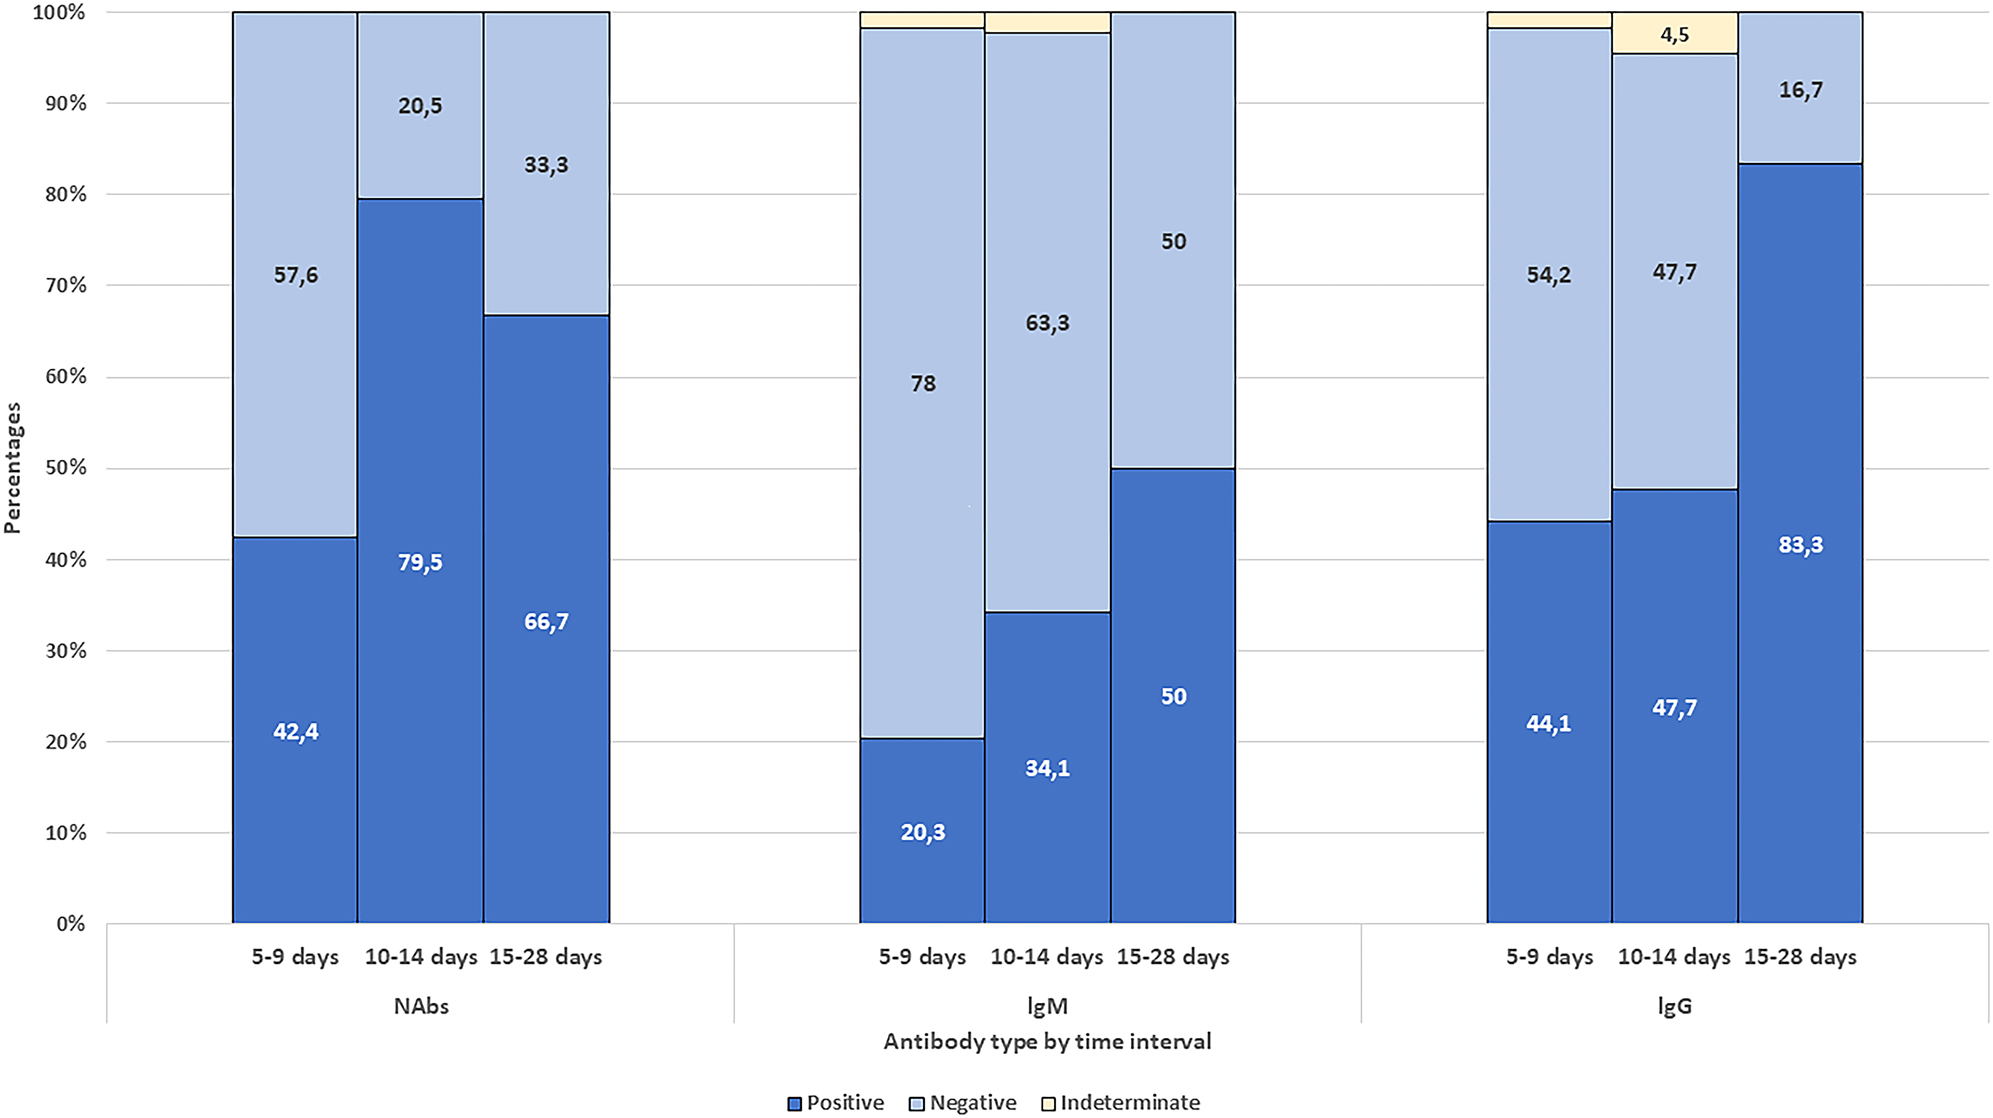
Seroconversion characteristics of severe acute respiratory syndrome-Coronavirus-2 specific neutralizing antibody (NAb), immunoglobulin M (lgM), and immunoglobulin G (lgG).
IgM and IgG antibody response were 20.3% and 44.1% among patients who were sampled on days 5–9 since onset, 34.1% and 47.7% on days 10–14; 50% and 83.3% among patients who were sampled on days 15–28 since onset (Figure 3).
IgG response was determined in 82.6% of the severe patients and 45.3% of the non-severe patients as of their hospital discharge (chi square test, p=0.006) (Table2). NAbs occurred in eight of the nine patients (88.9%) who needed ICU care (Table 1). The median SN50 level was determined as 1:25 in severe patients and it was 1:7.5 in the non-severe group (Mann–Whitney U test, p=0.009) (Table2). Only two male patients had the highest (>1:1250) titers of NAb; one of them was 36 years old with non-severe SARS-CoV-2 infection and tested on day 12 after symptom onset. The other was 50 years old, with severe COVID-19, and was tested on day 28.
Comparison of the VNA and ELISA
A total of 129 discharged serum samples of the patients were analyzed with both in-house ELISA kit and VNA assay. We found that 39 (30.2%), 67 (51.9%), and 78 (60.5%) samples were IgM, IgG, and VNA positive, respectively. In addition, out of all 129 serum samples of the patients, 53 (53/129: 41.1%) samples were positive, and 37 (37/129: 28.7%) were negative in both IgG ELISA and VNA assays. Fourteen samples were VNA-negative but IgG ELISA positive, whilst 22 samples were VNA-positive but IgG ELISA negative. Three samples were indeterminate in IgG ELISA while positive with VNA (Table1). Accordingly, sensitivity and specificity values for IgG ELISA were 67.9% and 72.5% and 47.4% and 96.1% for IgM ELISA, respectively.
Subgroup analyses of patients sampled at least ten days after symptom onset showed that both sensitivity and specificity values for IgG ELISA were 70.6%. These values were 49.0% and 88.2% for lgM ELISA, respectively.
Association of disease severity with NAb presence and higher titers of NAb
In the study, the length of hospital stays of the patients varied largely, and so were the timing of antibody testing after the detection of the first symptoms. To adjust for follow-up times, incidence rate and rate ratios were calculated for individual groups and group comparisons. Incidence rate corresponded to the number of patients with NAbs positivity at hospital discharge divided by person-days. The rate ratio equals the relative incidence rate of the risk group of interest vs. the control group’s. The rate ratios for the presence of NAb (any vs. none) at hospital discharge were 1.16 (95% CI=0.67–2.01, p=0.68) and 0.66 (95% CI=0.33–1.27, p=0.24), comparing patients with discharge at days 10–14 and 15–28 after symptoms onset, respectively, considering the patients discharged within 10 days after symptoms onset as the reference group. In Kaplan–Meier analyses, the presence of NAb seems to get positive earlier in the follow-up compared to that in severe cases. Yet, NAb positivity among severe cases surpasses that in the non-severe cases as the length of stay increases. The study design hinders our ability to detect the initial time for NAb production; instead, NAbs were assessed only once in each patient at discharge. To control for the potential confounding effect of the timing of NAb measurement, Kaplan–Meier curves were further stratified on follow-up time periods, such as days 5–9, 10–14, and 15–28 after symptom-onset. These analyses revealed no statistically significant difference between severe and non-severe cases regarding time-to-NAb presence in any of the time periods (log rank test p-values were 0.32, 0.31 and 0.60, for days 5–9, 10–14, and 15–28 after symptom-onset, respectively) (Figure 4A–C). Overall, a significant difference was obtained for higher NAb titers (i.e., 1:25 or higher vs. lower titers) favoring severe cases (OR=2.89, 95% CI=1.15–7.28, chi square test, p=0.021) (Table 1). This difference disappeared in survival analysis when time-to-event (i.e., testing) was adjusted (log rank test p=0.15) (Figure 4D).
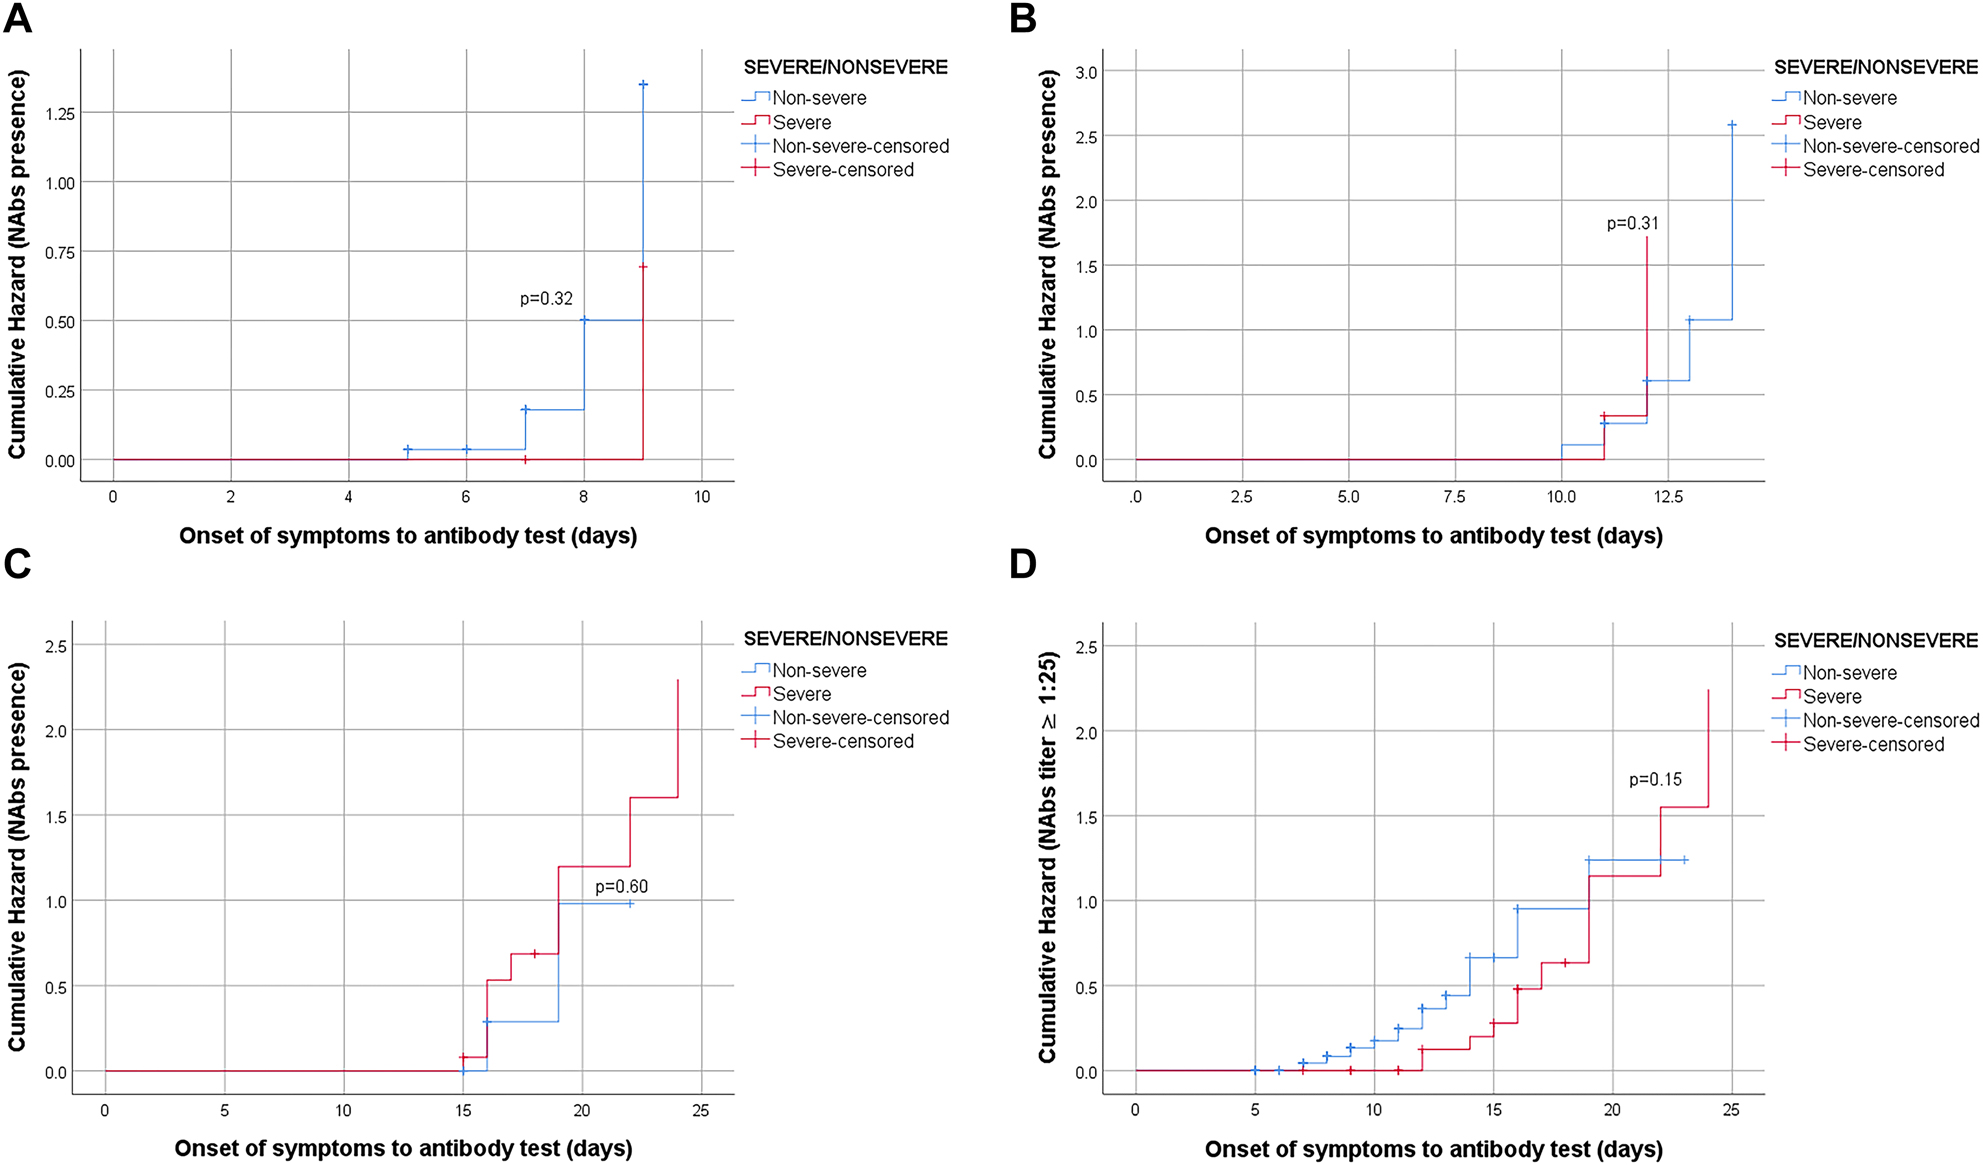
Hazard curves of NAbs by the severity of patients.
(A) Association between NAbs presence and severity of disease was not statistically significant log rank test p-value=0.32 (strata 1=5–9 days). (B). Association between NAbs presence and severity of disease was not statistically significant log rank test p-value=0.31 (strata 2=10–14 days). (C). Association between NAbs presence and severity of disease was not statistically significant log rank test p-value=0.60 (strata 3=14–28 days). (D). Association between NAb titer (≥1:25 vs. <1:25) and severity of disease was not statistically significant log rank test p-value=0.15.
Discussion
The characteristics and dynamics of NAb response to SARS-CoV-2 infection remain poorly understood. There are many questions to be explained, including the percentage of patients eliciting NAb after primary infection in protective titer, and whether there is a correlation between the clinical course of COVID-19 and the NAb response.
In this study, we investigated IgM, IgG, and NAb response in sera of confirmed COVID-19 patients at the time of hospital discharge. Proportional prevalence of IgM was reported lower than IgG prevalence in a study aiming to investigate acute antibody responses in a cohort having various clinical aspects of COVID-19 [10]. In addition, the initial occurrence of IgM and IgG antibodies was found different in various patients. Wang et al. also reported two patients with confirmed COVID-19 pneumonia failed to produce either IgM or IgG even 40 to 50 days after their symptom onset [11]. Similarly, IgM was found under the detection limit in 69.8% of the patients in our study. It was expected that there would be more patients with IgM responses during this time. Opposing to NAb prevalence over 60%, the low IgM positivity may indicate the limited performance of the ELISA protocol in detecting RBD-specific IgM antibodies. This limitation needs to be confirmed by re-testing the samples using ELISA protocols targeting antibody responses specific to N-protein [12]. In the present study, antibody testing was conducted at the time of hospital discharge to maximize the time interval between testing and the onset of symptoms. Given that patients varied in clinical severity at admission, the period of hospitalization varied, as well. The median time to antibody test were 11 days (ranged 5–28 days) after the onset of symptoms. It was significantly shorter in patients with mild clinical disease (9 vs. 15 days). This limitation in the study leads to varying durations between the onset of symptoms and time for testing, which might have hindered our ability to detect NAb presence among those discharged from the hospital early.
Yuchun et al. reported that 85.9% of the patients with SARS-CoV infection had positive NAb responses, which was first detectable from day 5 after the onset of symptoms and reached a peak level in days 20–30 [13]. NAb was detected in 60.5% of the patients in our study population. The highest NAb positivity was seen in patients discharged at 10–14 days after symptom onset, while lower levels were detected in those hospitalized longer than 15 days. The inability to present a dose-response effect (if any) could be linked to the detection bias in the study, given that these tests were not longitudinal measurements in the same cohort. Furthermore, the antibody response may be different due to variations in patient profiles, which could be a direct predictor of hospital stay. Future cohorts of adequate size and serial sampling are clearly required to reveal the exact pattern(s) of antibody levels over time, extending to months and even years, following COVID-19 infection.
Previous studies have shown that some recovered COVID-19 patients had very low NAb titers against SARS-CoV-2 [3, 14]. In our study, more than two-thirds of the patients (88/129) had low titers (SN50<1:25) of NAbs, although all (except one) recovered successfully. This may be due to the insufficient time for antibody development during sample collection for testing. These results may also suggest that cellular immunity may impact the recovery of the patients in the absence of detectable protective humoral immune response. T cell-mediated immunity’s important role in controlling infection was reported previously [15]. Similarly, Yazici et al. also reported that nearly one-fifth of the patients had no or low titers of NAbs against SARS CoV-2. They also concluded that recovery was not only dependent on high titers of NAbs [14].
On the other hand, in the present study, two male patients had remarkably high SN50 levels (>1:1250). One of them was 36 years old with non-severe SARS-CoV-2 infection; tested on day-12 after symptom onset. The other was 50 years old, with severe COVID-19, and was tested on day 28 after symptom onset. Both were discharged healthy.
Previous studies have reported a significant correlation between disease severity and NAb titers [14, 16]. Zhao et al. reported that antibody titers could be an independent factor predicting the clinical severity of SARS-CoV-2 infection [16]. Moreover, it was reported earlier that lung damage and worsening in clinical course by the second week of SARS-CoV infection may be due to the exaggerated immune response rather than uncontrolled viral replication [13, 17]. Moderbacher et al. also reported no significant associations between SARS-CoV-2 antibodies and disease severity, while associations were found between strong specific T cell responses and low COVID-19 disease severity [15]. In our study, out of 23 severe patients, 52.2% (n=12) had higher NAb titers (SN50≥1:25), the odds ratio of high NAbs was 2.89 among severe patients compared to non-severe patients (95% CI=1.15–7.28, chi square test, p=0.021). However, when time-to-event was controlled, NAb presence was not statistically significantly associated with disease severity. In this study, the variation in the timing of NAb testing after symptom onset among patients, which is mainly dependent on the fact that length of the hospital stay is subject to disease severity, and patients are tested for their NAb levels right before hospital discharge, might have systematically biased the actual potential for NAb formation. Furthermore, variations in the definition of severity (with or without control for potential confounders, including patient characteristics and the time elapsed between symptom onset and sampling for antibody test) may lead to inconsistent findings in different studies. Future studies are clearly required to elucidate the mechanisms underlying NAb response in COVID-19 patients.
Wu et al. reported that the NAb titers were positively correlated with age [3]. There was no significant association between age and the NAb titers in our study. Chen et al. reported that patients with more profound lung involvement had higher titers of NAbs [18]. In line with this report, our patients with advanced stage CT findings had significantly higher NAb titers.
The relationship between VNA and ELISA results was also evaluated in the present study. The positive results of IgG ELISA were found similar to the VNA results (51.9% vs. 60.5%). In patients sampled at least ten days after symptom onset, both sensitivity and specificity values for IgG ELISA were increased to 70.6%. These values were determined as 49.0% and 88.2% for lgM ELISA, respectively. On the other hand, there were 14 patients with positive IgG ELISA results but negative NAb results. These results indicate that not all produced antibodies are capable to neutralize the growth of the virus in vitro, as reported previously [14], in line with the fact that the neutralizing capacity of an antibody is related not only to its epitope specificity but also to its maturation.
As seen in Figure 3, the IgM negativity detected within 10 days after onset was quite higher than the IgM negativity detected in the samples taken 10 days after onset, and also a decrease was detected in the IgG negativity between these two periods. This finding indicates that either IgM and IgG antibody response occurred almost simultaneously during the first 10–12 days as described before [19] or the ELISA system was not fully capable of differentiating IgM and IgG immune responses.
There are some limitations to our study. Studying the potential association between the time of testing and the onset of symptoms might have obscured the dose-response effect (if any), given that convalescent sera were obtained only once.
In addition, the “high NAb titer” was determined in the study based on the median SN50 level (1:25) in the study population. Further studies are needed to assess the accuracy of predictors of higher titers of NAbs such as SN50 levels≥1:250.
Despite its limitations, our study revealed significant associations between clinical findings on admission and higher NAb titers, suggesting that such factors should be considered in future studies on the immune response to COVID-19. Finding of non-significant association between disease severity and NAb presence/titers deserves special attention in developing alternative pathophysiological explanations. Time dependent analysis of NAbs among COVID-19 patients is required for the valid investigation of the nature of immunological response and its implications on various therapeutic interventions and herd immunity. Large, heterogeneous cohorts of COVID-19 patients are clearly required to investigate immune response after recovery.
-
Author contributions: All authors have accepted responsibility for the entire content of this manuscript and approved its submission.
-
Competing interests: Authors state no conflict of interest.
-
Informed consent: Informed consent was obtained from all individuals included in this study.
-
Ethical approval: The study was approved by the local Institutional Review Board. Official permission was obtained from the Ministry of Health, and the study protocol was approved by the Ethical Committee of Ankara City Hospital(E1-20-532,7.5.2020).
References
1. Ota, M. Will we see protection or reinfection in COVID-19? Nat Rev Immunol 2020;20:351, https://doi.org/10.1038/s41577-020-0316-3.Search in Google Scholar
2. To, KK-W, Tsang, OT-Y, Leung, W-S, Tam, AR, Wu, T-C, Lung, DC, et al.. Temporal profiles of viral load in posterior oropharyngeal saliva samples and serum antibody responses during infection by SARS-CoV-2: an observational cohort study. Lancet Infect. Dis. 2020;20:565–574, https://doi.org/10.1016/s1473-3099(20)30196-1.Search in Google Scholar
3. Wu, F, Wang, A, Liu, M, Wang, Q, Chen, J, Xia, S, et al.. Neutralizing antibody responses to SARS-CoV-2 in a COVID-19 recovered patient cohort and their implications; 2020, https://doi.org/10.1101/2020.03.30.20047365.Search in Google Scholar
4. Pillay, TS. Gene of the month: the 2019-nCoV/SARS-CoV-2 novel coronavirus spike protein. J Clin Pathol 2020;73:366–9, https://doi.org/10.1136/jclinpath-2020-206658.Search in Google Scholar PubMed
5. Okba, NM, Muller, MA, Li, W, Wang, C, GeurtsvanKessel, CH, Corman, VM, et al.. SARS-CoV-2 specific antibody responses in COVID-19 patients. medRxiv; 2020.10.1101/2020.03.18.20038059Search in Google Scholar
6. World Health Organization. Clinical Management of Severe Acute Respiratory Infection (SARI) Ehen COVID-19 Disease is Suspected: Interim Guidance, 13 March 2020. World Health Organization; 2020.10.15557/PiMR.2020.0003Search in Google Scholar
7. Health NIo. COVID-19 Treatment Guidelines Panel. Coronavirus Disease 2019. (COVID-19) Treatment Guidelines [cited 2020 29.05]; 2020.Search in Google Scholar
8. Taylor, MJ, Perrais, D, and Merrifield, CJ. A high precision survey of the molecular dynamics of mammalian clathrin-mediated endocytosis. PLoS Biol 2011;9:e1000604, https://doi.org/10.1371/journal.pbio.1000604.Search in Google Scholar PubMed PubMed Central
9. Hanifehnezhad, A, Kehribar, EŞ, Öztop, S, Sheraz, A, Kasırga, S, Ergünay, K, et al.. Characterization of local SARS-CoV-2 isolatesand pathogenicity in IFNAR–/-mice. Heliyon 2020;6:e05116, https://doi.org/10.1016/j.heliyon.2020.e05116.Search in Google Scholar PubMed PubMed Central
10. Long, Q-X, Liu, B-Z, Deng, H-J, Wu, G-C, Deng, K, Chen, Y-K, et al.. Antibody responses to SARS-CoV-2 in patients with COVID-19. Nat Med 2020:1–4.10.1038/s41591-020-0897-1Search in Google Scholar PubMed
11. Wang, J, Chen, C, Li, Q, Cai, P, Wang, Z, and Wang, L. COVID-19 confirmed patients with negative antibodies results. BMC Infect Dis 2020;20:1–4, https://doi.org/10.1186/s12879-020-05419-3.Search in Google Scholar PubMed PubMed Central
12. Leung, H. Can you be Re-infected after recovering from coronavirus? Here’s what we know about COVID-19 immunity, 2020. Available from: https://time.com/5810454/coronavirus-immunity-reinfection/.Search in Google Scholar
13. Yuchun, N, Guangwen, W, Xuanling, S, Hong, Z, Yan, Q, Zhongping, H, et al.. Neutralizing antibodies in patients with severe acute respiratory syndrome-associated coronavirus infection. J Infect Dis 2004;190:1119, https://doi.org/10.1086/423286.Search in Google Scholar
14. Kalkan, M, Koç, M, Çetin, N, Karaaslan, E, Okay, G, Durdu, B, et al.. Discordance between serum neutralizing antibody titers and the recovery from COVID-19. J. Immunol. 2020;205:2719–25, https://doi.org/10.4049/jimmunol.2000840.Search in Google Scholar
15. Moderbacher, CR, Ramirez, SI, Dan, JM, Grifoni, A, Hastie, KM, Weiskopf, D, et al.. Antigen-specific adaptive immunity to SARS-CoV-2 in acute COVID-19 and associations with age and disease severity. Cell 2020;183:996–1012, https://doi.org/10.1016/j.cell.2020.09.038.Search in Google Scholar
16. Zhao, J, Yuan, Q, Wang, H, Liu, W, Liao, X, Su, Y, et al.. Antibody responses to SARS-CoV-2 in patients of novel coronavirus disease 2019. Clin. Infect. Dis. 2020;71:2027–34, https://doi.org/10.1093/cid/ciaa344.Search in Google Scholar
17. Peiris, JSM, Chu, C-M, Cheng, VC-C, Chan, K, Hung, I, Poon, LL, et al.. Clinical progression and viral load in a community outbreak of coronavirus-associated SARS pneumonia: a prospective study. Lancet 2003;361:1767–72, https://doi.org/10.1016/s0140-6736(03)13412-5.Search in Google Scholar
18. Chen, W, Zhang, J, Qin, X, Wang, W, Xu, M, Wang, L-F, et al.. SARS-CoV-2 neutralizing antibody levels are correlated with the severity of COVID-19 pneumonia. Biomed Pharmacother 2020;130:110629, https://doi.org/10.1016/j.biopha.2020.110629.Search in Google Scholar PubMed PubMed Central
19. Qu, J, Wu, C, Li, X, Zhang, G, Jiang, Z, Li, X, et al.. Profile of immunoglobulin G and IgM antibodies against severe acute respiratory syndrome coronavirus 2 (SARS-CoV-2). Clin Infect Dis 2020;71:2255–8, https://doi.org/10.1093/cid/ciaa489.Search in Google Scholar PubMed PubMed Central
Supplementary Material
The online version of this article offers supplementary material (https://doi.org/10.1515/tjb-2021-0200).
© 2022 Aliye Bastug et al., published by De Gruyter, Berlin/Boston
This work is licensed under the Creative Commons Attribution 4.0 International License.
Articles in the same Issue
- Frontmatter
- Review Article
- Is carnosine effective to alleviate lung injury: a systematic review
- Research Article
- Neutralizing antibody response and associated factors in Coronavirus-19 disease (COVID-19) up to one month
- Technical Note
- Comparison of enzyme-linked fluorescent assay and electrochemiluminescence immune assay in procalcitonin measurement
- Research Articles
- Pretreatment of diabetic aged rats with combination of ginsenoside-Mc1 and silibinin protects liver from ischemia-reperfusion injury through an AMPK-dependent mechanism
- Effects of exercise and quercetin on muscle energy charge in metabolic syndrome model of rats
- Effects of peroxisome proliferator activated receptor gamma (PPARγ) agonist on fasting model applied neuron cultures
- Combined effect of midostaurin and sphingosine kinase-1 inhibitor on FMS-like tyrosine kinase 3 (FLT3) wild type acute myeloid leukemia cells
- Association between systemic immune inflammation index and newly diagnosed adult celiac disease
- Total cholesterol/HDL cholesterol ratio and monocyte/HDL cholesterol ratio are related with subclinical hypothyroidism in polycystic ovary syndrome
- Effects of different exercise loads on serum betatrophin (ANGPTL-8/lipasin) and cartonectin (CTRP-3) levels in metabolic syndrome
- Impact of serum 25 hydroxyvitamin D deficiency on lipid biomarkers in established coronary artery disease
- The effect of temozolomide on Hsp60 and Hsp70 expression in extracellular vesicles derived from U87MG glioma cells
- Investigation of RASSF4 gene in head and neck cancers
- The role of A268V exon-7 polymorphism of PPARA in development of axial spondyloarthritis
- Analysis of beta globin gene mutations in Diyarbakir
- Education Section
- Mobile learning in a flipped classroom: findings from a “5-lecture-5” blended learning design for large classes
- Flipped learning in faculty development programs: opportunities for greater faculty engagement, self-learning, collaboration and discussion
- Medical interns’ attitudes towards One Health approach
- Coexisting of interprofessional education and organizational culture
- A snapshot of the coaching practices in undergraduate nursing education: evaluation of stakeholders’ perceptions and program costs