What kind of phonation causes the strongest vocal fold collision? – A hemi-larynx phonation contact pressure study
-
Florian Scheible studied physics at the Leopold Franzens University in Innsbruck. After his bachelor thesis in mass spectrometry, he decided to deepen his knowledge in the practical and hardware area with a master program in mechatronics & smart technologies at the Management Center Innsbruck. As his master's thesis he developed a pressure sensor based sensory system for the suspension of off-road motorcycles at KTM AG. Since 09/2019 he is a Junior Scientist at UMIT TIROL in the group of Prof. Sutor, where he gained knowledge in vibrometer based elastography and mechanical sensors.

 ,
,
in vivo studies as well as ex vivo experiments on excised larynges and silicone models.
and

Abstract
This paper presents a measurement setup which is able to measure the distribution of small scale pressure on an area of 15.2 mm × 30.4 mm with a sample rate up to 1.2 kHz. It was used to investigate the contact pressures of vocal folds during phonation. This was performed in ex vivo experiments of 11 porcine larynges. The contact pressure at the medial surface and other phonation parameters, as the glottal resistance and the closing velocity of the vocal fold, were measured at different adduction and elongation levels and air flow rates. A statistical analysis was carried out. It could be shown that the contact pressure rises, when the vocal fold is manipulated or when the flow rate is increased.
Zusammenfassung
In diesem Artikel wird ein Messaufbau vorgestellt, mit dem die Verteilung von geringen Drücken auf einer Fläche von 15.2 mm × 30.4 mm mit einer Abtastrate von bis zu 1.2 kHz gemessen werden kann. Dieser Aufbau wurde verwendet, um die Kontaktdrücke der Stimmlippen während der Phonation zu untersuchen. Dazu wurden 11 Schweinekehlköpfe in ex vivo Experimenten untersucht. Die Kontaktdrücke entlang der medialen Stimmlippenoberfläche und andere Phonationsparameter wie der glottale Widerstand und die Geschwindigkeit beim Schließen der Stimmlippe wurden für verschiedene Adduktions- und Elongationsstufen sowie Luftflussraten gemessen. Es wurde eine statistische Analyse durchgeführt. Dadurch konnte statistisch signifikant gezeigt werden, dass der Kontaktdruck ansteigt, wenn die Stimmlippe manipuliert wird oder wenn die Flussrate erhöht wird.
1 Introduction
The spoken language is a fast and efficient way of communication, but many suffer from voice disorders [1]. The primary sound of the human voice is produced by the vocal folds (VFs) inside the larynx [2]. Intensive use of the voice can result in high impact forces between the VFs, this increases the chance of injuries of the VF tissue [3]. To understand the process of speaking it is important to study material properties of the tissue itself, which is done by different approaches like optical coherence tomography [4], ultrasound elastography [5, 6], optical measurement techniques [7–9] or pipette aspiration [10]. But beside of that, it is also of high interest to understand the interplay between the VFs and the air pressure from the lungs. During speech the phonation is changed through muscles acting in and on the larynx. The main manipulations are, on the one hand, elongation, which stretches the VFs, resulting in an increase of the fundamental frequency of vibration. On the other hand, adduction forces the VFs to close the glottis and press against each other [11]. Both manipulations are used in voice production to change acoustic parameters rapidly [12]. Another dominant role of our speech production plays the loudness of the voice, which is controlled by the laryngeal muscles but also by the airflow through the VFs. It can be distinguished between different types of phonation; mostly this is differentiated acoustically but it can also be done by some phonation parameters [13].
The contact pressure between phonating VFs was investigated previously on synthetic VFs by using a miniature pressure probe [14] or in hemi-larynx experiments [15]. In vivo measurements are mainly done by image-based approaches, where the contact pressure is estimated indirectly by videoendoscopy [16] or color doppler ultrasound [7]. Other in vivo approaches utilize a piezoresistive transducer [17] or a piezoelectric film [3].
The main challenges in measuring the contact pressure are the difficult accessibility, the small dimension, the low contact pressures, the variations of boundary conditions during the measurement process and the fast movement of the VFs.
We have developed a pressure sensing matrix readout unit, which is easily integrated to hemi-larynx experiments and is capable to measure the pressure two-dimensionally. In our series of hemi-larynx experiments with variations in VF manipulation, we hope to shed some light on understanding the variation in contact pressure between VFs during different types of phonation.
2 Methods
2.1 Sensor and read out unit
A commercial pressure mapping sensor (4201, Tekscan Inc., South Boston, MA, USA) with a piezoresistive sensing area of 21.1 × 45.7 mm2 and a density of 27.6 sensels cm−2 is chosen to measure the occurring pressure during phonation [18]. The manufacturer specifies the measurable pressure range up to 34 kPa. In order to fulfil the needs for the application, a custom read out unit was developed and a circuit board was designed [19].
The read out unit can be seen in Figure 1. It is based on two multiplexers switching between a reduced number of sensels, so the measured area was reduced to 15.2 mm × 30.4 mm and the sample rate could be increased. The setup is described in detail by Scheible et al. [19]. It was calibrated to pressures up to 17.6 kPa with a sample rate up to 1.2 kHz.
2.2 Anatomy & physiology of the larynx and vocal folds
The VFs are located inside the larynx and have a length of 10 mm–20 mm in anterior-posterior direction and a width of 8 mm–12 mm in medial-lateral direction [20]. The air from the lungs which flows through the VFs, forces them to vibrate. This vibration, also known as phonation, produces a pressure signal which is the sound source of the human voice. The main frequency of the vibration is called the fundamental frequency f0. To change the sound, this vibration can be manipulated with laryngeal muscles.
In the human speech different types of phonation exist, Sundberg [13] distinguished between them with the help of the glottal resistance, where a low glottal resistance indicates a “breathy” and a high glottal resistance a “pressed” voice. Further a “breathy” voice is indicated by the failure of the VFs to make contact. Therefore a “breathy” phonation will not be measured in this investigation. So when the denominations are used it should be understood as a phonation trending towards one of those types.
2.3 Larynx preparation
At the local slaughterhouse eleven larynges were gathered and immediately quick-frozen with 2-methylbutane (−150 °C). Shortly before the measurement they were unfrozen at 4 °C and later put in a NaCl solution for 15 min at room temperature. Superfluous tissue and the vestibular folds were removed to enable a straight view on the VF during phonation. In order to place the contact plate with the sensor along the original glottal midline the left VF was removed. The preparation was done according to Döllinger et al. [21].
The plate and the larynx were placed in the holder and mounted by screws to secure its position. The remaining holes and gaps between larynx and plate, where the air from the sub-glottal space could escape, is closed with protefix, an adhesive paste for dentures prosthesis.
Figures 2 and 6 show the larynx mounted in the holder. If the vestibular folds are removed, the quality of the phonation suffers due to the lost weight of the removed tissue. In previous phonation studies a stabilization weight of 10 g is added and could produce good results [22].

Pressure sensing matrix and the custom made read out unit.

Snapshot of the highspeed camera. The marker points can be seen. On the right side the pressure sensor matrix is illustrated.
2.4 Image recognition
Subsequently to the larynx preparation the VF is tattooed with marker points. In Figure 2 the inked markers as well as the measured length
2.5 Experimental setup
The setup is similar to the one described in a publication of our group where the sensor was already integrated in a hemi-larynx phonation experiment [19]. The prepared larynx is positioned in the holder which sits over the artificial trachea, where the remaining part of the porcine trachea is connected to. On the side of the removed VF the sensor, mounted on a plate, was positioned with a slight contact to the remaining VF. This can be seen in Figure 2. A mass flow controller then regulates the flow rate through the larynx. In order to prevent the biological tissue from drying out a humidifier was installed. The onset flow rate was found by increasing the flow until a clear sustained phonation was audible.
During the measurement series with four equidistant flow steps the sub-glottal pressure, the audio signal (96 kS/s) as well as the contact pressure (1.2 kS/s) were recorded with National Instruments-measurement cards. The movement of the VF was recorded with a high-speed camera (4 kS/s) from above. All flow rates were maintained for 5 s. After a settle-time the recording was started for 0.5 s. The setup is shown in Figure 3.
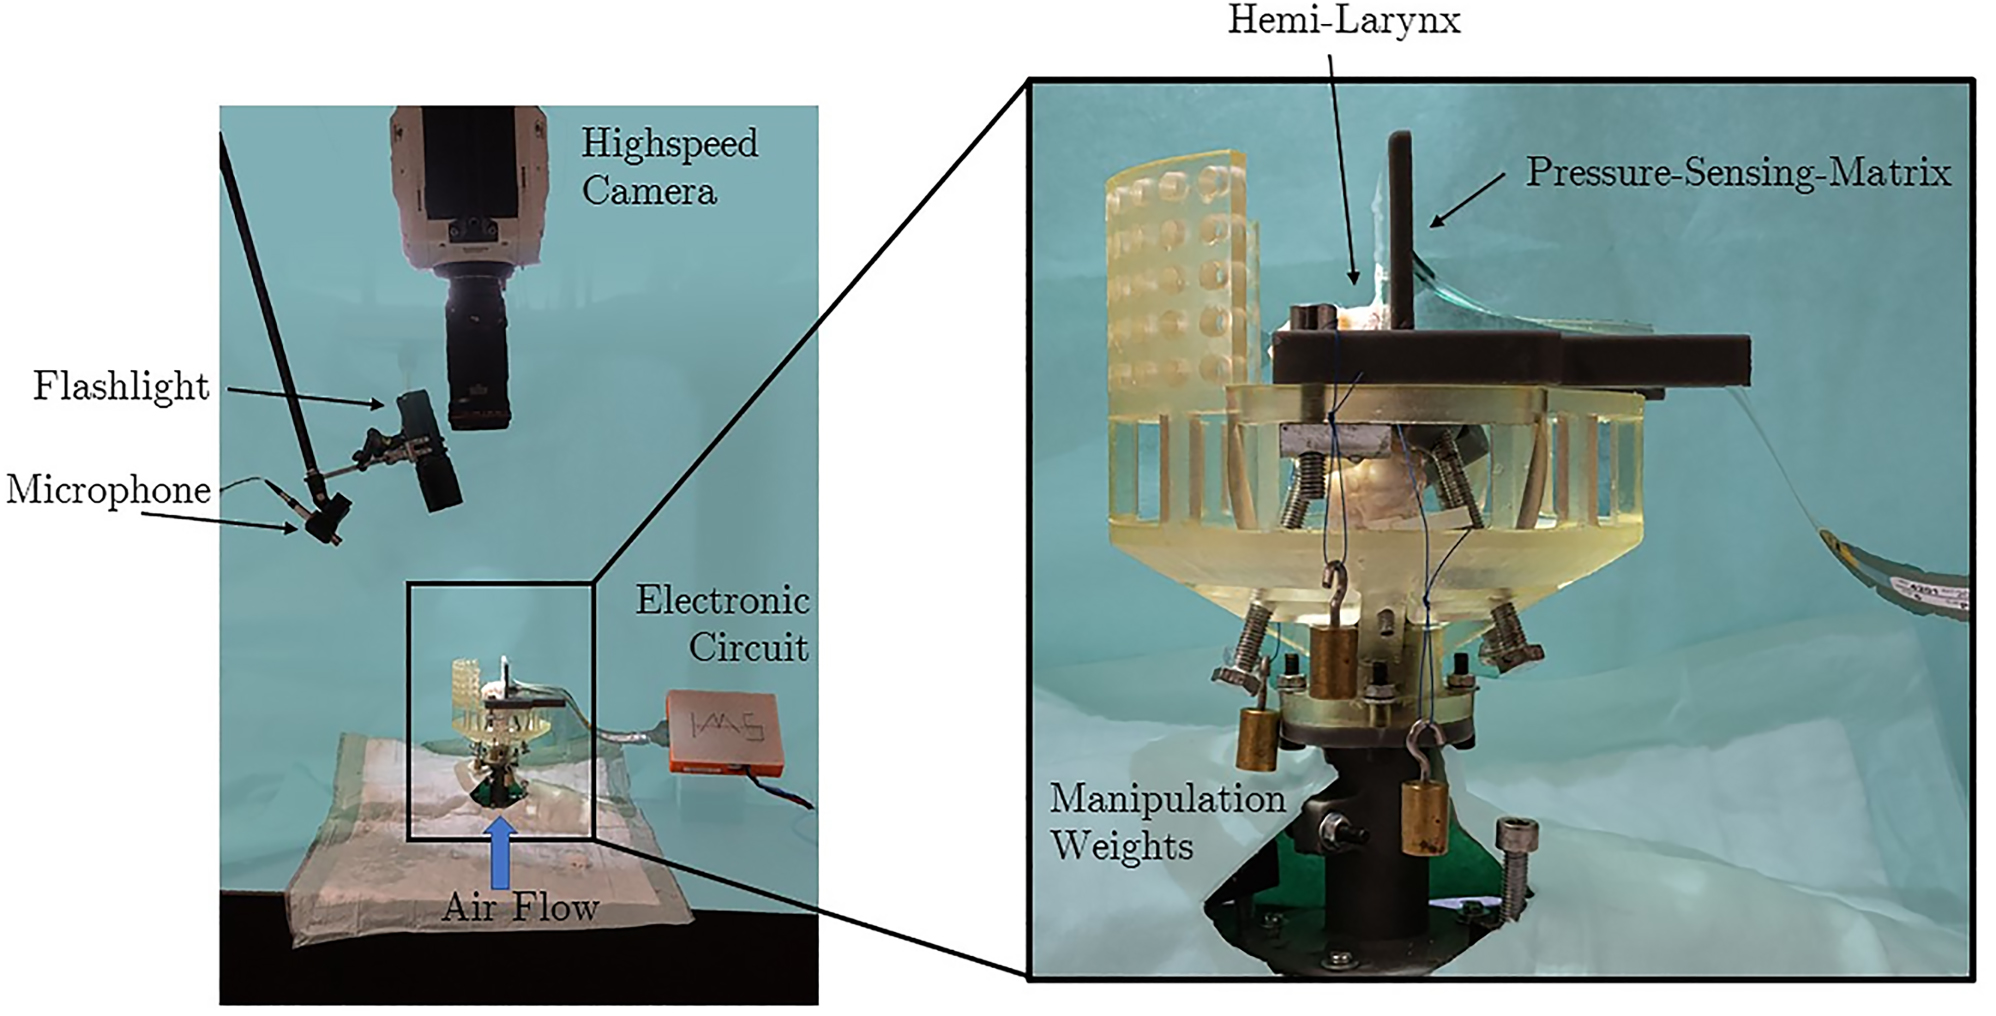
The experimental setup: the hemi-larynx is mounted on the artificial trachea inside the holder. The medial surface of the VF is oscillating against the pressure-sensing matrix mounted on a planar surface. From above, the high-speed camera records the movement and the microphone the sound of the vibrating VF.
2.6 Manipulations
During speech, the VFs undergo continuous manipulations. Important manipulations are adduction and elongation [11]. In a living species, these manipulations are performed by laryngeal muscles. An adduction is managed by an outer rotation of the arytenoid cartilage forced by the lateral cricoarytenoid muscle. An elongation is caused by a forward rotation of the thyroid cartilage caused by the contraction of the cricothyroid muscle [11]. To mimic these muscle activities, threads have been stitched in the arytenoid cartilage and thyroid cartilage. On the end of those threads weights apply force in order to adduct or elongate the VF, similar as it was done in previous studies [22].
Every larynx is manipulated in the same order, see Figure 4. It starts with a reference measurement Ref1, followed by adductions with 30 g (A30) and 50 g weights (A50). Then a second reference measurement Ref2 is made, before the larynx is elongated with 30 g (E30), 50 g (E50) and 70 g (E70). Lastly a third reference measurement Ref3 is made, this enables an observation of a potential hysteresis. All of those reference measurements were made with 10 g adduction.

Cyclic order of manipulations.
2.7 Data
2.7.1 Max. contact pressure at 50 % glottal line
Every larynx has a different size, therefore the position in relation to the sensor is documented by the camera from a vantage point above. The corresponding sensels to the 50 % glottal midline are then observed visually.
The maximal contact pressure is calculated as a difference between the highest and the lowest value of the contact pressure signal peaks, by doing so a potential air pressure is taken into account and subtracted.
2.7.2 Phonation parameters
The high-speed camera recording of the phonation was analyzed with an in-house developed software tool (Glottis Analysis Tools 2020, Erlangen, Germany) [23]. This tool registers the contour of the open glottis and calculates the pixels distance to the glottal midline. So the distance between the VF and the glottal midline at 50 % in anterior-posterior direction is calculated, the so called glottal amplitude GA. With the help of that tool and other sensor data following parameters are determined:
The fundamental frequency f0 is determined through a spectral analysis of the subglottal pressure. The peak with the lowest frequency value relates to the fundamental frequency f0.
The instantaneous value of glottal velocity v calculated by the Glottis Analysis Tool by deriving the glottal amplitude GA,
(1)The glottal resistance RB is an indicator for the power transfer between the glottal flow into the movement of the VF, the phonation efficiency so to say. It is an experimental parameter and is calculated of the ratio of the sub-glottal pressure psub to the given flow-rate Q by
(2)
During the time of one phonation sequence the mean of both parameters was calculated [24, 25].
3 Results
3.1 Exemplary data of a single measurement
The contact pressures of two sensels (compare Figure 6), the sub-glottal pressure and the glottal amplitude are plotted in Figure 5. The moment of a complete glottis closure is indicated by a sudden pressure drop followed by a quick rise as can be seen in the sub-glottal pressure data. These instances are illustrated with dashed lines. All frequency domain data show peaks at 128 Hz, where the sub-glottal pressure and the glottal amplitude also shows higher spectral components, which are multiples of 128 Hz. These data were already shown in a former publication by our group [19]. Regarding the contact pressure wave forms, it can be seen, that a first plateau is followed by a high contact peak, subsequently the VF opens again. Similar curves can be found in literature gathered by measurements but also simulation [11, 15, 26].

In the upper plot, the contact pressure of two sensels are drawn over a time range of 0.1 s, the middle one shows the subglottal pressure and in the lower one the glottal amplitude is plotted. Black dashed vertical lines mark the closing of the VF which is indicated by a sudden pressure drop followed by a quick rise. As one can observe it is also the moment of the contact pressure peak. On the right side the frequency domain of the whole measurement duration of 0.5 s are shown.

Two sensels of the eighth row, one in the fifth column (5/8) and next to it in the sixth (6/8) are selected for further demonstration. The eighth row is the bottom most and is hidden in behind the VF.
3.2 Statistical analysis
Out of eleven prepared larynges only seven delivered data for all measurements and could be used for evaluation. The others did not show a clear phonation or a phonation was not possible within all manipulations.
The larynges did have a different onset flowrate, due to their size differences, the mean value of the onset flow rate was 15.4 slm (standard liter per minute).
3.2.1 Deformation of the VF
The position of the marker points gives insight how the manipulation effects the VF. In Figure 7 the change of the tissue normalized to the initial measurement can be seen. For the adduction it seems that the VF gets 3.0 % shorter but the lateral surface strain increases about 6.0 %. The following elongation thins the VFs width about 3.2 % and length increases due to the stretching of 6.0 % of the VF.

This boxplot shows the change VF of the length in blue and the width in green. The measurements are normalized on the first reference. The boxes indicate the 25th and 75th percentiles, whiskers show the most extreme data points that are included. The horizontal bar in the box indicates the median, excluded outliers are marked with a red ‘+’.
3.2.2 Effect of manipulations on the fundamental frequency
In Figure 8 the fundamental frequencies can be seen. The frequency starts initially for the first reference measurement Ref1 at a median value of 258.9 Hz. The manipulations do change the frequency. It can be stated, that the obtained adduction levels do show a higher effect on the frequency and do also lead to higher “frequencies” 366.9 Hz compared to the applied elongation where the highest frequency was measured to 300.3 Hz at an elongation with 50 g. The frequency then falls to 200.8 Hz for the last reference measurement.

Effect of manipulations on the fundamental frequency f0.
3.2.3 Glottal resistance
Analogous to the frequency the glottal resistance rises stronger for the adduction. In Figure 9 can be seen that it starts with a median of 123.0 kPa slm−1 to increase subsequently to a maximum of 143.5 kPa slm−1 with an adduction of 50 g. Applying the elongation the glottal resistance stays around the value of the second reference measurement of 113.6 kPa slm−1 and finally drops to 86.2 kPa slm−1 for the last unmanipulated reference measurement.

Boxplot of the glottal resistance for each manipulation.
3.2.4 Closing velocity
In Figure 10 the velocity of the VF for each manipulation can be seen. The values do show a strong trend for different flow rates, but do not react so strongly due to the manipulations. To demonstrate this, the flow rates have been illustrated separately. But one can see that the glottal velocity shows lower values for the adduction and then slightly higher values for the elongation.

Boxplot of the max. closing velocity for different manipulations, grouped by the flow steps.
3.2.5 Contact pressures
The contact pressure at 50 % of the glottal midline is evaluated and the maximum values are plotted for all manipulations, flow rates and larynges in Figure 11. It can be seen, that with some exceptions, a higher flow rate results in a higher contact pressure in general. The highest median value of 0.34 kPa is reached with an elongation of 50 g. Further it is to notice that the last reference value does not fall back to the initial values of the two other reference measurements.

Boxplot of the maximum contact pressures for different manipulations, grouped by the flow steps.
3.3 Correlation between different measured parameters
A data set of seven larynges, with eight manipulations and four flowsteps could be collected, which results in 224 single measurements. This made a statistical evaluation to find correlations underneath different parameters possible. A Pearson-correlation was applied on the data set. As one can see in Figure 12, the contact pressure correlates weakly (0.3 < r < 0.5) with the closing velocity as well as with the flow rate, and it shows a negative correlation with the glottal resistance (r = −0.29). Furthermore it can be seen that the closing velocity correlates strongly with the flowrate (r > 0.61). The extensive experimental setup delivers even more parameters; only the most significant are chosen for demonstrations and those that do not show correlations, were not plotted.

The four parameters contact pressure, closing velocity, glottal resistance and flow rate are plotted against each other and a Pearson-correlation among each other is investigated. The p value to neglect the null hypothesis was set to p = 0.05.
4 Discussion
The measurement of the contact pressure between VFs while phonation, even if it is obtained ex vivo, is challenged by the size of the VFs of about 10 mm2–20 mm2, the small contact pressures between 0.5 kPa and 87.6 kPa and their high oscillation frequency of 100 Hz–300 Hz [11, 20]. Due to the thin and flexible dimension of the film sensor it was possible to include it into the hemi-larynx phonation experiments and gather a data-set of 224 single measurements. The developed read-out unit was able to measure the small acting contact pressures on an area of 15.2 × 30.4 mm2 with a high sample rate of 1.2 kfps. Investigating the phonation of seven larynges under eight manipulations with four different flow rates, we could come to the following findings:
Stretch: As seen in Figure 7, the manipulations do affect the VF dimensions. By applying the adductions it gets shorter but thicker, and then it is stretched and gets thinner when elongated.
Frequency: The obtained adductions show a higher effect on the frequency and do also lead to higher frequencies compared to the applied elongation, which is against the expectation that mainly the elongation pitches the frequency, it can be seen that both manipulations are increasing the frequency and the adduction even more so. In literature an increase of frequency while the VFs are adducted is described by a rise of the sub-glottal pressure. Further it is stated that an increase of 1 kPa rises the phonation about 20 Hz–40 Hz [11]. When regarding the dimension change of the VF in Figure 7 one can see that an elongation even produced an overstretching of the tissue and the third reference measurement Ref3 does not fall back to the initial value. This points to an hysteresis of the tissue.
Glottal resistance: Also, the glottal resistance shows higher values for the adduction, in comparison to the elongation.
Contact pressure: Compared to other in vivo investigation, like Hess et al. [27], or Verdolini et al. [28] who measured values between 1 kPa and 87.6 kPa we measured quite low contact pressures. This may be also a result of the hemi-larynx setup, in literature maximum contact-pressure values of 1.96 kPa were measured by Jiang & Titze [15] during hemi-larynx experiments. To assure the airflow through the glottis and prevent any loss underneath, the larynx had to be mounted quite close to the plate. So, compared to full-larynx experiments the larynx can not move so freely to the manipulations.
Closing velocity: The contact pressure results by a deceleration of the vocal fold and therefore results out of the kinetic momentum of the VF. So to say the velocity and the mass of the VF should relate to the contact pressure. By looking at the correlation in Figure 12, one can also see a correlation between those parameters.
Glottal resistance: A negative correlation between the glottal resistance and the contact pressure could be found.
It could be clearly shown that a high flow rate results in high contact pressures. This underlines the already known fact, that intense and loud speaking over a longer time can lead to speech problems as hoarseness, which could be traced back to higher contact pressures between the VFs [20]. To come back to our initial research question which was, what type of phonation results in high contact pressures. Beside of loud speaking, through high flow rates, we could show that the glottal resistance correlates negatively to the contact pressure. This could lead to the conclusion that a phonation towards a “pressed” voice tends to have lower contact pressure and a phonation towards a “breathy” one higher pressures. This may sound counterintuitive, but it has to be admitted that the phonations types produced by the manipulations in this study do not represent the whole spectrum of phonation. They are rather an excerpt between the endpoints marked by a “breathy” or “pressed” voice. So, what we can see in the data is, that a phonation during adduction, leads to a higher glottal resistance as can be seen in Figure 9 and to a lower contact pressure compared to an elongation. This might be traced back to the reduced distance between the VF, due to the adduction, resulting in a smaller vibration amplitude. So, the VF cannot reach high closing velocities, which based on the law of impulse conservation lead to lower contact pressures [11].
In future studies it would be interesting to produce more different types of phonation to investigate the effect on the contact pressure in more detail. Furthermore the development of a faster and more sensitive measurement setup would be desirable, too.
Funding source: Austrian Science Fund
Award Identifier / Grant number: I 3806-B28
Funding source: Deutsche Forschungsgemeinschaft
Award Identifier / Grant number: DO1247/9-1
About the authors

Florian Scheible studied physics at the Leopold Franzens University in Innsbruck. After his bachelor thesis in mass spectrometry, he decided to deepen his knowledge in the practical and hardware area with a master program in mechatronics & smart technologies at the Management Center Innsbruck. As his master's thesis he developed a pressure sensor based sensory system for the suspension of off-road motorcycles at KTM AG. Since 09/2019 he is a Junior Scientist at UMIT TIROL in the group of Prof. Sutor, where he gained knowledge in vibrometer based elastography and mechanical sensors.

Raphael Lamprecht studied Physics and History (teacher training program) at the Leopold Franzens University in Innsbruck and graduated in 06/2015 (supervisor assoz. Prof. Mag. Dr. Wolfgang Dür). He has been a Junior Scientist at UMIT TIROL in the group of Prof. Sutor since 02/2018, working on ultrasound elastography and material characterization of the vocal folds.

Casey Schaan studied Medical Engineering at the Friedrich-Alexander University in Erlangen with specialization in medical device technology, production technology and prosthetics and graduated in 04/2022. During her master's thesis she validated a new manipulation technique using ex vivo experiments on full- and hemi-laryngeal.

Reinhard Veltrup is a PhD student at the Division for Phoniatrics and Pediatric Audiology at the Department of Otorhinolaryngology, Head and Neck Surgery of the University Hospital Erlangen. He received his M. Sc. in medical engineering from the Friedrich-Alexander-Universität Erlangen-Nürnberg. His research includes 3D modeling and analysis of human vocal folds, the development of test stands for the analysis of ex vivo larynges as well as the quantification of aerosol particles during typical ENT examinations.

Marion Semmler, PhD, is a Senior Scientist at the Division for Phoniatrics and Pediatric Audiology at the Department of Otorhinolaryngology, Head and Neck Surgery of the University Hospital Erlangen. She received her M. Sc. in physics and her doctoral degree in engineering from the Friedrich-Alexander- Universität Erlangen-Nürnberg. Her research interests include 3D imaging of the vocal folds, high-speed videoendoscopy as well as the experimental investigation of the biomechanics of vocal folds. She designs, supervises and evaluates clinical in vivo studies as well as ex vivo experiments on excised larynges and silicone models.

Alexander Sutor graduated with a Dipl.-Ing. degree in electrical engineering from Friedrich-Alexander- University Erlangen/Nuremberg (FAU) in Germany with focus on electronics. He received a PhD degree at the same university in 2004 in the field of multidimensional semiconductor force and stress sensors. After that, he worked in a Postdoc position at the Chair of Sensor Technology (LSE) in the position of an Academic Assistant, leading the measurement and technology lab. In 2011, he was appointed Senior Academic Assistant (Akademischer Oberrat). In order to broaden his experience, he took the position as Head of Research and Development at Corscience, a medium-sized enterprise in medical technology development in 2016. Corscience’s expertise lies in the field of OEM products for medical measurement and sensor technologies, especially pulse oximeters, ECG and EEG instruments and oxygen and carbon dioxide breathing gas sensors. The following year, he has been appointed full professor at the newly founded Institute of Measurement and Sensor Technology at UMIT TIROL. He is now teaching in the bachelor and master study programs in electrical engineering and mechatronics and in the PhD program Dr. techn. (doctor technicae). At his institute he established the research fields of sensors and electronics, ecological measurement systems and medical and sports medical measurement technology. His scientific work has been published in 76 peer reviewed journal articles (Google Scholar h-index 18) and more than 70 conference contributions.
-
Author contributions: All the authors have accepted responsibility for the entire content of this submitted manuscript and approved submission.
-
Research funding: This research was funded by the Austrian Science Fund Grant No. I 3806-B28 and by the German Research Foundation (DFG) No. DO1247/9-1.
-
Conflict of interest statement: The authors declare no conflicts of interest regarding this article.
References
[1] L. O. Ramig and K. Verdolini, “Treatment efficacy: voice disorders,” J. Speech Lang. Hear. Res., vol. 41, no. 1, pp. S101–S116, 1998. https://doi.org/10.1044/jslhr.4101.s101.Search in Google Scholar PubMed
[2] I. R. Titze and D. W. Martin, “Principles of voice production,” J. Acoust. Soc. Am., vol. 104, no. 3, p. 1148, 1998. https://doi.org/10.1121/1.424266.Search in Google Scholar
[3] H. E. Gunter, R. D. Howe, S. M. Zeitels, J. B. Kobler, and R. E. Hillman, “Measurement of vocal fold collision forces during phonation,” J. Speech Lang. Hear. Res., vol. 48, no. 3, pp. 567–576, 2005. https://doi.org/10.1044/1092-4388(2005/039).Search in Google Scholar PubMed
[4] Y.-P. Huang, Y.-P. Zheng, S.-Z. Wang, Z.-P. Chen, Q.-H. Huang, and Y.-H. He, “An optical coherence tomography based air jet indentation system for measuring the mechanical properties of soft tissues,” Meas. Sci. Technol., vol. 20, no. 1, pp. 1–11, 2009. https://doi.org/10.1088/0957-0233/20/1/015805.Search in Google Scholar PubMed PubMed Central
[5] R. Lamprecht, F. Scheible, M. Semmler, and A. Sutor, “A quasi-static quantitative ultrasound elastography algorithm using optical flow,” Sensors, vol. 21, no. 9, p. 3010, 2021. https://doi.org/10.3390/s21093010.Search in Google Scholar PubMed PubMed Central
[6] R. Lamprecht, F. Scheible, R. Veltrup, et al.., “Quasi-static ultrasound elastography of ex-vivo porcine vocal folds during passive elongation and adduction,” J. Voice, 2022. https://doi.org/10.1016/j.jvoice.2022.11.033.Search in Google Scholar PubMed
[7] T.-Y. Hsiao, C.-L. Wang, C.-N. Chen, F.-J. Hsieh, and Y.-W. Shau, “Elasticity of human vocal folds measured in vivo using color Doppler imaging,” Ultrasound Med. Biol., vol. 28, no. 9, pp. 1145–1152, 2002. https://doi.org/10.1016/S0301-5629(02)00559-8.Search in Google Scholar PubMed
[8] S. Kazemirad, H. Bakhshaee, L. Mongeau, and K. Kost, “Non-invasive in vivo measurement of the shear modulus of human vocal fold tissue,” J. Biomech., vol. 47, no. 5, pp. 1173–1179, 2014. https://doi.org/10.1016/j.jbiomech.2013.11.034.Search in Google Scholar PubMed PubMed Central
[9] G. K. Sharma, L. Y. Chen, L. Chou, et al.., “Surface kinematic and depth-resolved analysis of human vocal folds in vivo during phonation using optical coherence tomography,” J. Biomed. Opt., vol. 26, no. 8, p. 086005, 2021. https://doi.org/10.1117/1.JBO.26.8.086005.Search in Google Scholar PubMed PubMed Central
[10] F. Scheible, R. Lamprecht, M. Semmler, and A. Sutor, “Dynamic biomechanical analysis of vocal folds using pipette aspiration technique,” Sensors, vol. 21, no. 9, p. 2923, 2021. https://doi.org/10.3390/s21092923.Search in Google Scholar PubMed PubMed Central
[11] A. Behrman, Speech and Voice Science, 3rd ed. San Diego, CA, Plural Publishing, Incorporated, 2017.Search in Google Scholar
[12] J. Sundberg, The Acoustics of the Singing Voice, US, Scientific American Offprints. Scientific American, 1977.10.1038/scientificamerican0377-82Search in Google Scholar PubMed
[13] J. Sundberg, The Science of the Singing Voice, Dekalb, Ill., Northern Illinois Univ. Pr, 1988.Search in Google Scholar
[14] M. Motie-Shirazi, M. Zañartu, S. D. Peterson, et al.., “Toward development of a vocal fold contact pressure probe: sensor characterization and validation using synthetic vocal fold models,” Appl. Sci., vol. 9, no. 15, p. 3002, 2019. https://doi.org/10.3390/app9153002.Search in Google Scholar PubMed PubMed Central
[15] J. J. Jiang and I. R. Titze, “Measurement of vocal fold intraglottal pressure and impact stress,” J. Voice, vol. 8, no. 2, pp. 132–144, 1994. https://doi.org/10.1016/S0892-1997(05)80305-4.Search in Google Scholar
[16] M. E. Díaz-Cádiz, S. D. Peterson, G. E. Galindo, et al.., “Estimating vocal fold contact pressure from raw laryngeal high-speed videoendoscopy using a hertz contact model,” Appl. Sci., vol. 9, no. 11, p. 2384, 2019. https://doi.org/10.3390/app9112384.Search in Google Scholar PubMed PubMed Central
[17] K. Verdolini, R. Chan, I. R. Titze, M. Hess, and W. Bierhals, “Correspondence of electroglottographic closed quotient to vocal fold impact stress in excised canine larynges,” J. Voice, vol. 12, no. 4, pp. 415–423, 1998. https://doi.org/10.1016/s0892-1997(98)80050-7.Search in Google Scholar PubMed
[18] Tekscan, “Pressure-mapping-sensor 4201 datasheet,” Available at: https://www.tekscan.com/sites/default/files/resources/IDL-Pressure-Mapping-Sensor-4201-Datasheet.pdf [accessed: May. 30, 2023].Search in Google Scholar
[19] F. Scheible, R. Veltrup, C. Schaan, et al.., “Measuring contact pressures of phonating vocal fold using a pressure-sensing-matrix during hemi-larynx experiments,” in Proceedings of Meetings on Acoustics, ASA, 2021.10.1121/2.0001548Search in Google Scholar
[20] A. K. Miri, “Mechanical characterization of vocal fold tissue: a review study,” J. Voice, vol. 28, no. 6, pp. 657–667, 2014. https://doi.org/10.1016/j.jvoice.2014.03.001.Search in Google Scholar PubMed
[21] M. Döllinger, D. A. Berry, and S. Kniesburges, “Dynamic vocal fold parameters with changing adduction in ex-vivo hemilarynx experiments,” J. Acoust. Soc. Am., vol. 139, no. 5, pp. 2372–2385, 2016. https://doi.org/10.1121/1.4947044.Search in Google Scholar PubMed PubMed Central
[22] F. Scheible, R. Lamprecht, C. Schaan, et al.., “Behind the complex interplay of phonation: investigating elasticity of vocal folds with pipette aspiration technique during ex vivo phonation experiments,” J. Voice, 2023. https://doi.org/10.1016/j.jvoice.2023.03.001.Search in Google Scholar PubMed
[23] A. M. Kist, P. Gómez, D. Dubrovskiy, et al.., “A deep learning enhanced novel software tool for laryngeal dynamics analysis,” J. Speech Lang. Hear. Res., vol. 64, no. 6, pp. 1889–1903, 2021. https://doi.org/10.1044/2021_JSLHR-20-00498.Search in Google Scholar PubMed
[24] M. Semmler, D. A. Berry, A. Schützenberger, and M. Döllinger, “Fluid-structure-acoustic interactions in an ex vivo porcine phonation model,” J. Acoust. Soc. Am., vol. 149, no. 3, pp. 1657–1673, 2021. https://doi.org/10.1121/10.0003602.Search in Google Scholar PubMed PubMed Central
[25] J. van den Berg, J. T. Zantema, and P. Doornenbal, “On the air resistance and the Bernoulli effect of the human larynx,” J. Acoust. Soc. Am., vol. 29, no. 5, pp. 626–631, 1957. https://doi.org/10.1121/1.1908987.Search in Google Scholar
[26] Z. Zhang, “Vocal fold contact pressure in a three-dimensional body-cover phonation model,” J. Acoust. Soc. Am., vol. 146, no. 1, pp. 256–265, 2019. https://doi.org/10.1121/1.5116138.Search in Google Scholar PubMed PubMed Central
[27] M. M. Hess, K. Verdolini, W. Bierhals, U. Mansmann, and M. Gross, “Endolaryngeal contact pressures,” J. Voice, vol. 12, no. 1, pp. 50–67, 1998. https://doi.org/10.1016/S0892-1997(98)80075-1.Search in Google Scholar
[28] K. Verdolini, M. M. Hess, I. R. Titze, W. Bierhals, and M. Gross, “Investigation of vocal fold impact stress in human subjects,” J. Voice, vol. 13, no. 2, pp. 184–202, 1999. https://doi.org/10.1016/S0892-1997(99)80022-8.Search in Google Scholar
© 2023 the author(s), published by De Gruyter, Berlin/Boston
This work is licensed under the Creative Commons Attribution 4.0 International License.
Articles in the same Issue
- Frontmatter
- Editorial
- Editorial
- Research Articles
- Textile-based piezoelectric impact sensors for fibre-reinforced plastic composites
- Textile-based strain sensors for fiber-reinforced composites under tension, compression and bending
- Distributed fiber optic sensors for structural health monitoring of composite pressure vessels
- Temperature-dependent calibration and temperature compensation of elastic shape-memory alloy strain sensors for fiber-reinforced composite applications
- Gesture and force sensing based on dielectric elastomers for intelligent gloves in the digital production
- What kind of phonation causes the strongest vocal fold collision? – A hemi-larynx phonation contact pressure study
- Concept studies and application development of textile integrated dielectric elastomer sensors for smart shoe technologies