Synthesis, thermal and magnetic behavior of iron oxide-polymer nanocomposites
-
A. Suhasini
 and
T. Maiyalagan
and
T. Maiyalagan

Abstract
Polymer nanocomposites of various concentrations were prepared using iron oxide (Fe2O3) nanoparticles as filler in an 80:20 ratio of the polyurethane diol and polycaprolactone hybrid. Fourier transformed infrared spectroscopy studies were performed to find out the interaction of the nanoparticles with the polymer blend. Fe2O3 in the polymer composites was in the nanoscale and uniform dispersion was achieved, as revealed by X-ray diffraction. The thermal stability of the blend was assessed through thermogravimetry analysis and dynamic mechanical analysis. High-resolution scanning electron microscopy and transmission electron microscopy images ensured the development of the polymer hybrid around Fe2O3 nanoparticles and the prepared composites were indeed in the nanoscale. The magnetic behavior of the prepared nanocomposites is superparamagnetic with high magnetization values, as assessed by vibrating sample magnetometry analysis.
1 Introduction
The blending of polymers is one of the important techniques to develop new polymeric materials with properties that are different from those of individual polymers. It has been reported that polymer blend electrolytes exhibit higher conductivity [1], [2] and better mechanical strength [3], [4] compared to that of pure blend. Polycaprolactone (PCL) is one of the important synthetic, biocompatible, and biodegradable aliphatic polyesters that are nontoxic for all living organisms. Shape memory property is obtained when PCL is introduced into polyurethane (PU), and together they are used in radiotherapy patient immobilization, orthopedic splinting or casting, plastic and reconstructive surgery splinting, and orthotic or prosthetic socket cone production [5], [6], [7]. PU, on the contrary, is a synthetic, biodegradable polymer [8], [9], [10], [11] and is derived from the condensation of isocyanates and polyalcohols. It has been already reported that PU-PCL blend has a shape memory effect for the potential development of cardiovascular implants in a rheological study [12], [13]. PU-PCL blend is used in medical procedures, including radiotherapy patient immobilization, orthopedic splinting or casting, plastic and reconstructive surgery, and prosthetic socket cone production [14]. PU diol (PUD) is a member of the PU family, which is a synthetic biodegradable [15] polymer and is used as a modifier for water-soluble resins and emulsions in wood, appliances, and auto coatings.
Adding inorganic materials, mainly nanosized [16] materials, to the polymer matrix improves the physical properties of polymers [17]. The transition metal iron oxide (Fe2O3) nanoparticles in crystalline and amorphous forms have been widely used in magnetic liquids, biological separation, during delivery, magnetic storage media, solar energy transformation, magnetic storage media, electronic industry, and catalysis [18], [19], [20]. The most common Fe2O3 forms available in nature are magnetite (Fe3O4), maghemite (γ-Fe2O3), and hematite (α-Fe2O3). Among the various forms, hematite and maghemite are important in technological and industrial applications [21]. Maghemite has abundant applications in recording, memory devices, magnetic resonance imaging (MRI), drug delivery, coatings, lithium batteries, lithium ion phosphate batteries, and cell targeting [22]. Maghemite is the ferromagnetic form of Fe(III)oxide; at room temperature, maghemite turns into a hematite crystalline structure. Maghemite is biocompatible [23]; therefore, it is one of the most widely used biomaterials for different applications such as cell separation, drug delivery in cancer therapy, magnetic-induced hyperthermia, MRI contrast agent, immune magnetic separation, and other applications, such as recording, memory devices, MRI, drug delivery, or cell targeting [24], [25]. The magnetic properties of maghemite play an important role in different applications of health care.
2 Materials and methods
2.1 Materials
PUD (Sigma-Aldrich; Code: 446084) was used after dehydration at 100°C for 12 h in vacuum oven. PCL (Sigma-Aldrich; Code: 704105) was dried under vacuum at 60°C for 4 h. 4,4′-Diaminodiphenylmethane (DDM), hexamethylene diisocyanate (HDI; Fluka), a catalyst [dibutyltindilaurate (DBTDL; Sigma-Aldrich)], and Fe2O3 nanoparticles (Sigma-Aldrich) were received and used without further purification.
2.2 Synthesis of PUD/PCL-Fe2O3 nanocomposite
Dehydrated PUD (40 g) was melted at about 90°C in a preheated mixer. Then, 10 g PCL was added to the melt and the resulting mixture was subjected to 415 rpm rotor speed for 30 min to obtain an 80:20 ratio of polymer blend (PUD/PCL). The temperature of the blend was increased to 120°C and 0.5 g Fe2O3 nanomaterial was added slowly and carefully, and the blend was stirred vigorously for 45 min. This is followed by sonication for 1 h to disperse the nanoparticles homogeneously throughout the blend. To this mixture, 2 ml DBTDL was added and stirred for 15 min. Then, heating was stopped and 12 ml curing agent, HDI, and DDM were added and stirred. The prepared nanocomposite was transferred to the mold and dried in a vacuum air oven at 100°C for 1 h and kept overnight at room temperature.
2.3 Characterization methods
The prepared nanocomposites were characterized by the following techniques: Fourier transformed infrared (FTIR) spectroscopy recordings were made using a JASCO-FTIR 4100/Japan spectrometer within the spectral range of 4000 to 400 cm−1 and spectral resolution of 4 cm−1 using KBr pellets. X-ray diffraction (XRD) experiments were performed directly on the samples using a PANalytical X’Pert Powder X’Celerator Diffractometer between the measurement ranges of 10° and 80° in 2θ. Thermogravimetry analysis (TGA) was carried out with Perkin Elmer STA 6000 thermoanalyzer instrument. In each case, about 5 mg specimens were heated from 20°C to 750°C using a linear heating rate of 5°C/min under nitrogen flow. Dynamic mechanical analysis (DMA) measurements were conducted using a DMA Q800 V20.6 Build 24 dynamic mechanical analyzer at a frequency of about 1 Hz over the temperature range 10°C–80°C to room temperature. The scanning rate was 3°C/min and the thickness of film specimen for measurement was 3–5 mm. High-resolution scanning electron microscopy (HR-SEM) images of the gold-coated samples were obtained using FEI Quanta FEG 200 microscope. Transmission electron microscopy (TEM) and selected area electron diffraction (SAED) images were obtained using a Philips model CM 200 microscope at the operating voltage of 20–200 kV. The magnetization measurements of all synthesized samples were carried out using a vibrating sample magnetometer (VSM; Lakeshore VSM 7410 model) at room temperature in the magnetic field range of ±15 kG.
3 Results and discussion
3.1 FTIR analysis
The FTIR spectra (Figure 1) of Fe2O3 nanoparticle-filled PUD/PCL composite have revealed the characteristic absorption band at 3320, 3330, 3331, 3332, and 3321 cm−1 corresponding to the N-H stretching of urethane bonds (NH-COO) [26]. Bands at 2925, 2924, 2926, and 2928 cm−1 and 2856, 2857, 2858, and 2859 cm−1 [27] correspond to the asymmetric and symmetric stretching vibration of the methylene group of PU and PCL polymers in the blend. Bands at 1691, 1692, and 1693 cm−1 are observed for blend and nanocomposites, which reflect the presence of the urethane carbonyl group [28]. No band is found at about 2255 cm−1 for composites [29], which reveals that the isocyanate of HDI is completely involved in the curing reaction. The absorption peak at about 849 and 864 cm−1 [30] also appears in the nanocomposites alone, but this peak is absent for the pure blend. The presence of these absorption bands is due to the nanoparticle in the pure polymer blend. As there is no change in the position and presence of the absorption bands of the nanoparticles, it is obvious that there is no physical and chemical interaction between the blend and nanoparticles in the composites. Hence, it is very clear that the prepared materials are complete composites.

FT-IR spectra of (A) pure blend (B) blend+0.5 wt% Fe2O3 nanoparticle (C) blend+1 wt% Fe2O3 nanoparticle (D) blend+1.5 wt% Fe2O3 nanoparticle (E) blend+2 wt% Fe2O3 nanoparticle (F) blend+2.5 wt% Fe2O3 nanoparticle.
3.2 XRD analysis
The XRD patterns of Fe2O3-filled PUD/PCL nanocomposites and Fe2O3 nanoparticles alone are shown in Figure 2A–G. The diffracted intensities were recorded from 10°C to 80°C. Figure 2 shows sharp crystalline peaks for 2θ at 30.272°, 35.684°, 43.34°, 53.852°, 57.4°, and 63.011° and the planes are identified as (220), (311), (400), (422), (511), and (440), respectively, for nanoparticle alone and polymer nanocomposites [31]. These values correspond to the diffraction of γ-Fe2O3 (JCPDS 25-1402), indicating that nanoparticles are single phase with tetragonal structure [32], [33]. These values match the various Fe2O3-filled nanocomposites prepared, which reveal that Fe2O3 nanoparticles exist in the same size as the prepared composites.

XRD pattern of (A) pure blend (B) blend+0.5 wt% Fe2O3 nanoparticle (C) blend+1 wt% Fe2O3 nanoparticle (D) blend+1.5 wt% Fe2O3 nanoparticle (E) blend+2 wt% Fe2O3 nanoparticle (F) blend+2.5 wt% Fe2O3 nanoparticle (G) Fe2O3 nanoparticle.
3.3 TGA analysis
The thermal analysis and the thermal stability of the nanocomposites and pure PUD/PCL were carried out from room temperature to 800°C and are shown in Figure 3. The thermogram obviously depicts the three to five weight loss during the course of the experiment for the pure blend and nanocomposites. The first weight loss temperature at about 117°C and 132°C is attributed to the evaporation of moisture present in the material. From the literature, the PU thermal degradation starts at about 230°C, corresponding to the degradation of hard segments formed by urethane [34], [35]. However, these nanocomposites have weight loss individually at 266°C, 273°C, 274°C, and 284°C, which is attributed to the degradation of hard segments. This increase in degradation temperature is due to the interaction of PU hard segment with the increasing amount of nanomaterial and with PCL. The thermogram also reveals a weight loss at about 316°C, 332°C, 341°C, 343°C, and 354°C for different nanocomposites; this is due to the degradation temperature for PCL in the blend. These values are almost comparable to the reported pure PCL degradation temperature [36]. The weight loss temperature at about 451°C–458°C is due to the complete decomposition of blend and various nanocomposites prepared.

TG-DTG thermograms of (A) pure blend (B) blend+0.5 wt% Fe2O3 nanoparticle (C) blend+1 wt% Fe2O3 nanoparticle (D) blend+1.5 wt% Fe2O3 nanoparticle (E) blend+2 wt% Fe2O3 nanoparticle (F) blend+2.5 wt% Fe2O3 nanoparticle.
3.4 DMA
DMA is used to investigate the dynamic mechanical properties of the pure PUD/PCL blend and Fe2O3 nanoparticle-filled polymer nanocomposites. Figure 4A–C represents the storage modulus (EI), loss modulus (EII), and damping factor (tan δ) of the blend and nanocomposites as a function of temperature at 1 Hz. Figure 4A shows that 2.5 wt% Fe2O3 nanocomposites have higher storage modulus than the other nanocomposites and pure blend. The storage modulus at higher temperature drops due to the loss in stiffness of the blend. The EI for pure blend at 28.1°C is 169.7 MPa; however, as the concentration of nanoparticles increases in the blend, the storage modulus increases to 165.2, 220.8, 388.47, 695, and 870.7 MPa, respectively. This increase in storage modulus is attributed to the reinforcement of metallic nanoparticles in the blend [37].

Storage modulus (A), loss modulus (B) and Tanδ (C) of polymer nanocomposites (a) blend (b) blend +0.5 wt% Fe2O3 nanoparticle (c) blend +1 wt% Fe2O3 nanoparticle (d) blend +1.5 wt% Fe2O3 nanoparticle (e) blend +2 wt% Fe2O3 nanoparticle (f) blend +2.5 wt% Fe2O3 nanoparticle.
Figure 4B shows the variation of loss modulus for pure PUD/PCL blend and for various nanocomposites. The maximum loss modulus value of a material corresponds to its glass transition temperature (Tg) value. When compared to the pure blend, EII shows an increasing trend with the addition of nanoparticles to the blend. From the figure, the loss modulus values of the nanocomposites are higher than that of the pure blend, but after the Tg the EII values are comparable, reflecting the characteristic resemblance of the nanocomposites and blend in the rubbery region [38]. The obtained (Tg) from loss modulus is given in Table 1.
Peak height of tan δ curve and Tg from tan δ curve and EII curve.
| Fe2O3 content (wt%) | Peak height of tan δ curve | Tg from tan δ curve (°C) | Tg from EII curve (°C) |
|---|---|---|---|
| Blend | 2.0967 | 41.2 | 27.4 |
| 0.5 | 1.8989 | 42.2 | 27.9 |
| 1 | 2.0739 | 42.3 | 28.4 |
| 1.5 | 1.5739 | 42.7 | 28.5 |
| 2 | 1.3739 | 42.6 | 28.5 |
| 2.5 | 1.2957 | 47.6 | 28.8 |
Tg corresponds to the temperature at the peak of tan δ curves. Moreover, it is known to estimate the damping behavior of the material. The tan δ values of the pure blend and various nanocomposites are given in Table 1 and illustrated in Figure 4C. When the nanoparticle concentration to the blend increases, the movement of molecular chains at the interface decreases and a reduction in damping factor occurs. The incorporation of Fe2O3 nanoparticles to the blend weakens the interfacial bonding interaction between the polymer chains, which results in minimum tan δ peak [39]. The maximum tan δ value corresponds to the Tg of the material and then the composite moves to the rubbery region. In this region, the molecular segments are reasonably free to move and result in the low tan δ value. Hence, it is clear from the investigation that nanoparticle-incorporated polymer blend has better stability than the pure polymer blend.
3.5 TEM and HR-SEM analyses
The surface morphology of Fe2O3 nanoparticle-filled polymer composites investigated by TEM and HR-SEM is shown in Figure 5A–E. The TEM bright-field image with corresponding SAED patterns of the Fe2O3 nanoparticle-filled polymer blend is shown in Figure 5A–E. All the micrographs showed very high dispersion of Fe2O3 nanoparticles within the blend. The average particle size of the TEM image is measured to be ~50 nm [40], which is again a confirmation for the XRD investigation. The SAED pattern (inset) of the samples shows clear diffraction spots, which indicates the high crystallinity of Fe2O3 nanoparticles inside the blend.

HR-SEM & TEM (inset SAED) images of (A) blend +0.5 wt% Fe2O3 nanoparticle (B) blend +1 wt% Fe2O3 nanoparticle (C) blend +1.5 wt% Fe2O3 nanoparticle (D) blend +2 wt% Fe2O3 nanoparticle (E) blend +2.5 wt% Fe2O3 nanoparticle.
The HR-SEM images reveal that PUD and PCL are extremely miscible with each other and therefore form a uniform blend. For the preparation of the composite, Fe2O3 nanoparticles of size <50 nm was used. From the picture, it is observed that nanoparticles are present as granules with small and big spherical particles. The particles are found to exist as single, double, and triple and rarely as quadruple. This clearly indicates that when the concentration of nanoparticles to the hybrid increases the size of the particle also rises. The drying of nanocomposites through heating also aids particle agglomeration in magnetic nanoparticle systems [41]. However, most of the nanoparticles exist as single and are found to be in the nanoscale; hence, the prepared materials are nanocomposites only as supported by XRD analysis as well.
3.6 VSM analysis
The magnetic characteristics of Fe2O3-filled PUD/PCL blend of various compositions are obtained by measuring the magnetization with respect to the applied field from −15,000 to +15,000 Oe at room temperature (Table 2). Figure 6 shows the hysteresis curves obtained for the prepared composites. Coercivity (Hc) is an important physical parameter to differentiate hard (>100 Oe) and soft (<100 Oe) magnetic materials [42]. From the graph, it is observed that the coercivity of pure blend is 60.91 Oe and therefore termed as a soft material. When Fe2O3 nanoparticle concentrations are increased in the blend, their coercivity values increase from 382.0 to 2920.2 Oe. This indicates that Fe2O3 nanoparticles are observed to be magnetically harder after dispersion in the polymer matrix [43]. The magnetic remanence for the blend is 12×10−6 emu/g, whereas for the prepared nanocomposites the values substantially increase to 46×10−6 emu/g. Therefore, a greater magnetic moment is left behind even after the removal of external magnetic field for composites, which will help to bind the nanoparticles with the blend. The magnetization saturation (Ms) of the composites has significantly changed from the blend, which has improved the magnetic properties of the composites. This will also assist the magnetic detectability of the composites [44]. The SQR values from 0.5 wt% nanoparticle-loaded blend is found to be 0.0126, which can be attributed to the superparamagnetic character [45], [46]. As the nanoparticle loading is increased in the blend, SQR values tend to increase, which will deviate from the superparamagnetic behavior.
Magnetic parameters of PUD/PCL-Fe2O3 nanocomposites.
| Materials | Coercivity (Hc) | Retentivity (Mr; 10−6 emu/g) | Magnetization (Ms; 10−6 emu/g) | SQR=Mr/Ms (emu/g) |
|---|---|---|---|---|
| Blend | 60.9 | 12.41 | 263.67 | 0.047 |
| 0.5 | 382 | 7.72 | 609.36 | 0.012 |
| 1 | 704.30 | 12.57 | 775.01 | 0.016 |
| 1.5 | 1893.1 | 24.09 | 275.47 | 0.087 |
| 2 | 2049.2 | 25.50 | 321.55 | 0.079 |
| 2.5 | 2920.2 | 46.28 | 215.29 | 0.215 |
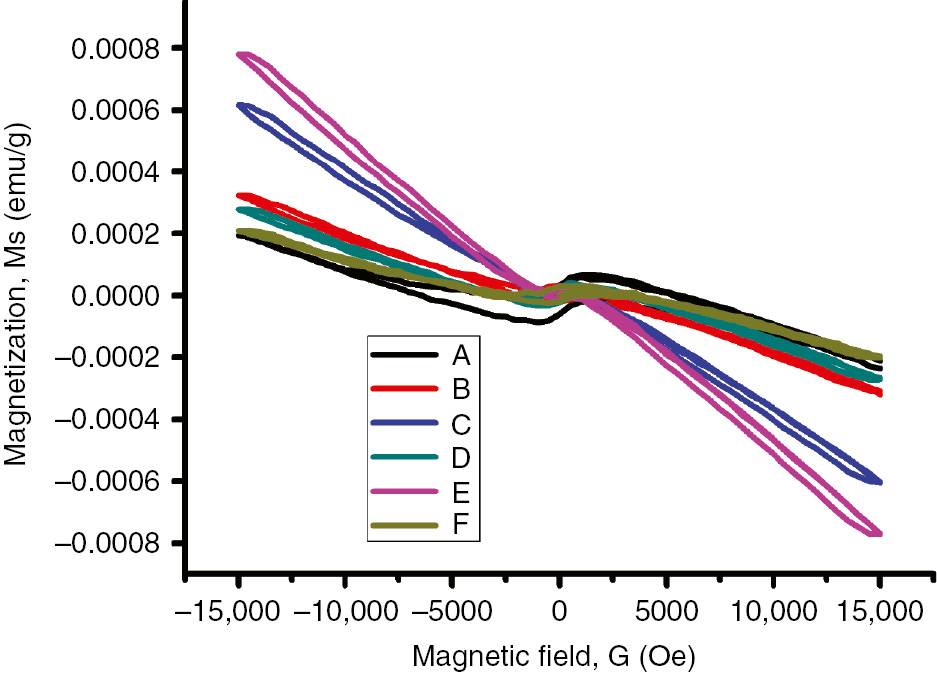
VSM for (A) pure blend (B) blend+0.5 wt% Fe2O3 nanoparticle (C) blend+1 wt% Fe2O3 nanoparticle (D) blend+1.5 wt% Fe2O3 nanoparticle (E) blend+2 wt% Fe2O3 nanoparticle (F) blend+2.5 wt% Fe2O3 nanoparticle.
4 Conclusions
A series of PUD/PCL-Fe2O3 nanocomposites were prepared. Infrared investigation reveals that the prepared materials are nanocomposites, as there is no chemical interaction between the blend and the nanoparticles in the composites. XRD, HR-SEM, and TEM images confirm that the prepared materials are nanocomposites with a tetragonal structure. TGA studies show that the overall thermal stability of the blend has been increased due to the presence of nanoparticles in the matrix. The prepared nanocomposites have good stress transfer and storage modulus and adhesion imparts toughening effect as revealed by DMA. The assessed magnetic properties revealed that the prepared nanocomposites are superparamagnetic and can be employed in electronic devices.
Acknowledgments
We would like to acknowledge IIT Madras, IIT Bombay, and Cochin University for their technical support.
References
[1] Baskaran R, Selvasekarapandian S, Kuwata N, Kawamura J, Hattori T. Mater. Chem. Phys. 2006, 98, 55–56.10.1016/j.matchemphys.2005.08.063Search in Google Scholar
[2] Sivakumar M, Subadevi R, Rajendran S, Wu H-C, Wu N-L. Eur. Polym. J. 2007, 43, 4466–4473.10.1016/j.eurpolymj.2007.08.001Search in Google Scholar
[3] Fan LZ, Dang ZM, Nan CW, Li M. J. Electrochim. Acta 2002, 48, 205–209.10.1016/S0013-4686(02)00603-5Search in Google Scholar
[4] Ramesh S, Winie T, Arof AK. Eur. Polym. J. 2007, 43, 1963–1968.10.1016/j.eurpolymj.2007.02.006Search in Google Scholar
[5] Zhu G, Liang G, Xu Q, Yu Q. J. Appl. Polym. Sci. 2003, 90, 1589–1595.10.1002/app.12736Search in Google Scholar
[6] Ping P, Wang W, Chen X, Jing X. Biomacromolecules 2005, 6, 587–592.10.1021/bm049477jSearch in Google Scholar PubMed
[7] Meng Q, Hu J. Polym. Adv. Technol. 2008, 19, 131–136.10.1002/pat.985Search in Google Scholar
[8] Nair LS, Laurencin CT. Prog. Polym. Sci. 2007, 32, 762–798.10.1016/j.progpolymsci.2007.05.017Search in Google Scholar
[9] Sunija AJ, Sivailango S, Vinodkumar KP. Bull. Mater. Sci. 2014, 37, 735–741.10.1007/s12034-014-0665-2Search in Google Scholar
[10] Santerre JP, Woodhouse K, Laroche G. Biomaterials 2005, 26, 7457–7470.10.1016/j.biomaterials.2005.05.079Search in Google Scholar PubMed
[11] Khatiwala VK, Shekhar N, Aggarwal S, Mandal UK. J. Polym. Environ. 2008, 16, 61–67.10.1007/s10924-008-0104-9Search in Google Scholar
[12] Bødker F, Hansen MF, Bender Koch C, Morup S. J. Magn. Magn. Mater. 2000, 221, 32–36.10.1016/S0304-8853(00)00392-9Search in Google Scholar
[13] Ajili SH, Ebrahimi NG, Soleimani M. Acta Biomater. 2009, 5, 1519–1530.10.1016/j.actbio.2008.12.014Search in Google Scholar
[14] Ajili SH, Ebrahimi NG, Ansari M. Rheol. Acta 2008, 47, 81–87.10.1007/s00397-007-0213-8Search in Google Scholar
[15] Mukherjee K, Tribedi P, Chowdhury A, Ray T, Joardar A, Giri S, Sil AK. Biodegradation. 2011, 22, 377–388.10.1007/s10532-010-9409-1Search in Google Scholar
[16] Mouritz AP, Gibson AG. Solid Mech. Appl. 2006, 143, 385–401.Search in Google Scholar
[17] Shanmugam S, Viswanathan B, Varadarajan TK. Nanoscale Res. Lett. 2007, 2, 175–183.10.1007/s11671-007-9050-zSearch in Google Scholar
[18] Scott A. Tissue Eng.: Pt. B. 2008, 14, 3–17.10.1089/teb.2007.0133Search in Google Scholar
[19] Storey RF, Wiggins JS, Puckett AD. J. Polym. Sci.: Pt. A: Polym. Chem. 1994, 32, 2345–2363.10.1002/pola.1994.080321216Search in Google Scholar
[20] Jabbari E, Khakpour M. Biomaterials. 2000, 21, 2073–2079.10.1016/S0142-9612(00)00135-6Search in Google Scholar
[21] Huo L, Li W, Lu L, Cui H, Xi S, Wang J, Shen Y, Lu Z. Chem. Mater. 2000, 12, 790–794.10.1021/cm990690+Search in Google Scholar
[22] Laurent S, Forge D, Port M, Roch A, Robic C, Elst LV, Muller RN. Chem. Rev. 2008, 108, 2064–2110.10.1021/cr068445eSearch in Google Scholar PubMed
[23] Arami H, Khandhar A, Liggitt D, Krishnan KM. Chem. Soc. Rev. 2015, 44, 8576–8607.10.1039/C5CS00541HSearch in Google Scholar
[24] Basuki JS, Jacquemin A, Esser L, Li Y, Boyer C, Davis TP.Polym. Chem. 2014, 5, 2611–2620.10.1039/C3PY01778HSearch in Google Scholar
[25] Soenen SJ, Parak WJ, Rejman J, Manshian B.Chem. Rev. 2015,115, 2109–2135.10.1021/cr400714jSearch in Google Scholar PubMed
[26] Seehra MS, Babu VS, Manivannan A, Lynn JW. Phys. Rev. B. 2000, 61, 3513–3518.10.1103/PhysRevB.61.3513Search in Google Scholar
[27] Meng QB, Lee S-I, Nah C, Lee Y-S. Prog. Org. Coat. 2009, 66, 382–386.10.1016/j.porgcoat.2009.08.016Search in Google Scholar
[28] Yen MS, Chen PY, Tsai HC. J. Appl. Polym. Sci. 2003, 90, 2824–2833.10.1002/app.12965Search in Google Scholar
[29] Zia KM, Bhatti IA, Barikani M, Zuber M, Bhatti HN. Carbohydr. Polym. 2009, 76, 183–187.10.1016/j.carbpol.2008.10.005Search in Google Scholar
[30] Cabrera L, Gutierrez S, Menendez N, Morales MP, Herrasti P. Electrochim. Acta. 2008, 53, 3436–3441.10.1016/j.electacta.2007.12.006Search in Google Scholar
[31] Hei S, Jin Y, Zhang F. J. Chem. 2014, 2014, 1–6.10.1155/2014/546956Search in Google Scholar
[32] Zhang L, Wu HB, Xu R, Lou XW. Cryst. Eng. Commun. 2013, 15, 9332–9335.10.1039/c3ce40996aSearch in Google Scholar
[33] Kazeminezhad I, Mosivand S. Acta. Phys. Pol. A. 2014, 125, 1210–1214.10.12693/APhysPolA.125.1210Search in Google Scholar
[34] Liu JY, Reni L, Wei Q, Wu JL, Liu S, Wang YJ, Li GY. eXPRESS Polym. Lett. 2011, 5, 742–752.10.3144/expresspolymlett.2011.72Search in Google Scholar
[35] Jawaid M, Abdul Khalil HPS, Hassan A, Dungani R, Hadiyane A. Compos. Pt. B. 2013, 45, 619–624.10.1016/j.compositesb.2012.04.068Search in Google Scholar
[36] Huang J, Zou JW, Chang PR, Yu JH, Dufresne A. eXPRESS Polym. Lett. 2011, 5, 362–373.10.3144/expresspolymlett.2011.35Search in Google Scholar
[37] Tey JN, Soutar AM, Mhailsalkar SG, Yu H, Hew KM. J. Thin Solid Films. 2006, 504, 384−390.10.1016/j.tsf.2005.09.104Search in Google Scholar
[38] Yoo HJ, Lee YH, Kwon JY, Kim HD. J. Fibers Polym. 2001, 2, 122−128.10.1007/BF02875324Search in Google Scholar
[39] Athawale VD, Kulkarni MA. J. Prog. Org. Coat. 2010, 67, 44−54.10.1016/j.porgcoat.2009.09.015Search in Google Scholar
[40] Khan FN, Manivel P, Prabakaran K, Jin JS, Jeong ED, Kim HJ, Maiyalagan T. Res. Chem. Intermed. 2012, 38, 571–582.10.1007/s11164-011-0372-1Search in Google Scholar
[41] Wei X, Viadero Jr RC. Coll. Surf. A: Physicochem. Eng. Asp. 2007, 294, 280–286.10.1016/j.colsurfa.2006.07.060Search in Google Scholar
[42] Guo Z, Lei K, Li Y, Ng H, Hahn HT. Compos. Sci. Technol. 2008, 68, 1513–1520.10.1016/j.compscitech.2007.10.018Search in Google Scholar
[43] Guo Z, Lee S-E, Kim H, Park S, Hahn HT, Karki AB, Young DP. Acta Mater. 2009, 57, 267–277.10.1016/j.actamat.2008.09.024Search in Google Scholar
[44] Tiar Ong H, Muhd Julkapli N, Bee Abd Hamid S, Boondamnoen O, Foong Tai M. J. Magn. Magn. Mater. 2015, 395, 173–179.10.1016/j.jmmm.2015.07.028Search in Google Scholar
[45] Jung J-S, Malkinski L, Lim J-H, Yu M, O’Connor CJ, Lee H-O, Kim E-M. Bull. Kor. Chem. Soc. 2008, 29, 758–760.10.5012/bkcs.2008.29.4.758Search in Google Scholar
[46] Shanmugam S, Nakanishi T, Osaka T. J. Electrochem. Soc. 2009, 156, K121–K127.10.1149/1.3125767Search in Google Scholar
©2018 Walter de Gruyter GmbH, Berlin/Boston
This article is distributed under the terms of the Creative Commons Attribution Non-Commercial License, which permits unrestricted non-commercial use, distribution, and reproduction in any medium, provided the original work is properly cited.
Articles in the same Issue
- Frontmatter
- Review
- A model on the curved shapes of unsymmetric laminates including tool-part interaction
- Original articles
- Enhanced catalytic performance of β-FeOOH by coupling with single-walled carbon nanotubes in a visible-light-Fenton-like process
- Investigation of the microstructure and properties of W75-Cu/W55-Cu brazed joint with Cu-Mn-Co filler metal
- In situ polymerization approach to poly(arylene ether nitrile)-functionalized multiwalled carbon nanotube composite films: thermal, mechanical, dielectric, and electrical properties
- Fabrication and characterization properties of polypropylene/polycarbonate/clay nanocomposites prepared with twin-screw extruder
- Torsional vibration of functionally graded carbon nanotube reinforced conical shells
- A comparative study performance of cationic organic montmorillonite prepared by different methods
- Design and analysis with different substrate materials of a new metamaterial for satellite applications
- An investigation on dry sliding wear behaviour of pressure infiltrated AA1050-XMg/B4C composites
- Investigation of mechanical performances of composite bolted joints with local reinforcements
- Effect of alkali treatment on the flexural properties of a Luffa cylindrica-reinforced epoxy composite
- Thermal expansion, electrical conductivity and hardness of Mn3Zn0.5Sn0.5N/Al composites
- Effect of modified layered double hydroxide on the flammability and mechanical properties of polypropylene
- A unified formulation for free vibration of functionally graded plates
- Friction-stir welding of aluminum alloy with an iron-based metal as reinforcing material
- Hybridization effect of coir fiber on physico-mechanical properties of polyethylene-banana/coir fiber hybrid composites
- Micromechanical properties of unidirectional composites filled with single and clustered shaped fibers
- Structure and microwave absorbing properties of carbon-filled ultra-high molecular weight polyethylene
- Investigation and optimization of the electro-discharge machining parameters of 2024 aluminum alloy and Al/7.5% Al2O3 particulate-reinforced metal matrix composite
- Structural behavior of load-bearing sandwich wall panels with GFRP skin and a foam-web core
- Synthesis, thermal and magnetic behavior of iron oxide-polymer nanocomposites
- High-temperature damping capacity of fly ash cenosphere/AZ91D Mg alloy composites
- Investigation of penetration into woven fabric specimens impregnated with shear thickening fluid