The effect of an excessive amount of carbon nanotubes on the properties of zinc oxide-carbon nanotube nanocomposites
-
Ömer Güler


Abstract
The effect of the amount of carbon nanotubes on the electrical and optical properties of carbon nanotube (CNT)-zinc oxide nanocomposites was investigated. In this study, carbon nanotubes were prepared by chemical vapor deposition in a fluidized reactor. The diameters and lengths of the carbon nanotubes that were synthesized were determined by high-resolution transmission electron microscopy to be 20–30 nm and a few micrometers, respectively. Then, CNTs were added to commercial zinc oxide powder to prepare the nanocomposite. The structural, optical, and electrical properties of the samples were characterized by various techniques, such as scanning electron microscopy (SEM), UV-vis absorption, and electrical transport measurements. The room temperature conductivity σ25 values of the undoped ZnO and ZnO doped with 0.1% CNTs, 0.2% CNTs, and 5% CNTs were found to be 6.55×10⁻⁵, 5.46×10⁻⁴, 1.23×10⁻³, and 2.83×10⁻² S/cm, respectively. The optical band gaps of the composites were determined by the Kubelka-Munk theory based on the analysis of diffuse reflectance. The results that were obtained indicated that the electrical and optical properties of ZnO semiconductors can be improved by the incorporation of CNTs. However, the ZnO lost some of its distinctive properties when excess amounts of CNTs were used in the ZnO-CNT composites.
1 Introduction
ZnO semiconductors have become very popular for electrical and optical applications. ZnO is a wide band gap semiconductor (3.37 eV), and it has a large binding energy (60 meV) [1, 2], low resistivity, and high transparency in the visible range, as well as high light-trapping characteristics [3]. It is a promising material for many optoelectronic applications, such as ultraviolet lasers, light-emitting diodes, p-n junction devices, thin-film transistors, solar cells, acoustic devices, and chemical and biological sensors. The development of low-resistive ZnO films with high transparency is crucial for applications as transparent and conducting electrodes in solar cells and thin-film transistors [4, 5].
Carbon nanotubes (CNTs) are crystalline graphitic sheets rolled up into a seamless, cylindrical shape [6]. Since their discovery by Iijima [6], it has been found that CNTs have diverse and unique physical properties. They have attracted considerable interest by many scientists due to their extraordinary chemical, electronic, thermal, and mechanical properties. Their special properties make CNTs potential candidates for many applications, such as field emission devices [7], scanning probes, nanoscale electronic devices [8], hydrogen storage, chemical sensors, and composite reinforcing materials [9]. Some CNT-reinforced composites are emerging as an important class of nanostructured materials for fabricating future nanoelectronic devices [10], and one of the most important of these composites is CNT-reinforced ZnO composites. Because of the unusual properties of the CNT/ZnO nanostructures, they have many potential applications, ranging from solar cells and field emission devices to multifunctional nanoelectronic devices [11, 12].
It is obvious that the electrical and optical properties of ZnO were improved by CNT addition to ZnO. But the limit of carbon nanotubes and the property changes of ZnO proportion to the CNT amount are not obvious. The aim of this study is the determination of the effect of excessive carbon nanotube amounts to the properties of ZnO as different from previous works. In this study, we prepared ZnO-CNT nanocomposites to investigate the effects of excessive amounts of CNTs in ZnO-CNT nanocomposites on their electrical and optical properties. The electrical and optical properties of the nanocomposites were investigated by electrical conductivity and optical spectroscopy methods.
2 Materials and methods
The synthesis of the CNTs was performed in a single, fluidized bed reactor (hand made), consisting of a quartz tube that had an inside diameter of 65 mm, an overall length of 1500 mm, and a heating zone length of 800–900 mm. In our experiments, nano-Fe powder was used as a catalyst, and C2H2 gas was used as the source of carbon. Figure 1 shows the schematic diagram of the apparatus used in the experiment. The fluidized bed reactor was heated to 1073 K, after which the reactor was purged with Ar at a flow rate of 0.5–1.0 standard liter per minute (slm) for 5 min. Subsequently, a mixture of C2H2, Ar, and H2 gases (4–5 slm) first was injected into the catalyst box and then into the reactor. The pressure of the injected gases fluidized the nano-Fe powders in the catalyst box. After the reactions in the fluidized bed reactor, the product and any remaining gases exited the reactor and were collected in the product collector box. In this study, the CNTs that were synthesized grew into agglomerate particles, bundles, and arrays. The carbon nanotubes that were obtained were characterized via X-ray diffraction (XRD) (Bruker Advance D8, CuKα, Waltham, MA, USA), HR-TEM (Jeol Jem 2100F, Tokyo, Japan), and FESEM (Jeol Jsm-7001F, Tokyo, Japan).
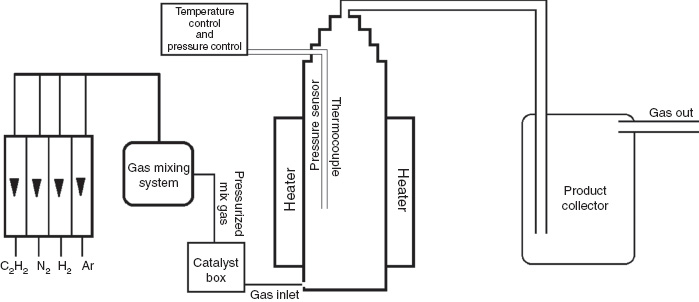
Schematic representation of fluidized bed reactor apparatus.
The ZnO-CNT composites were prepared using CNT-ZnO ratios of 0.1, 0.2, and 5 wt%. In order to disperse the CNTs homogeneously in the matrix, they were weighed to prepare the appropriate ratios and then added to 50 ml of ethanol. To prevent the agglomeration of the CNTs, the CNT-ethanol mixture was homogenized in an Ultrasonic homogenizer (Bandelin Sonopuls Hd3200, Mecklendburg, Germany) at 125 W for 1 h. Then, the ZnO powder was added to the mixtures, and the mixtures were stirred by a magnetic stirrer at 80°C until the alcohol evaporated. The powders that were obtained were milled at 300 rpm in an argon atmosphere in a planetary ball mill (Retsch PM100, Haan, Germany) in order to disperse the CNTs homogenously into the ZnO matrix. A more effective dispersion was obtained during the milling process. The ball-milled powder mixture was compacted at 600 MPa in a compaction die that had a 20-mm diameter. The compacted product was sintered at 600°C for 1 h in an Ar atmosphere. The composites were analyzed by SEM (Jeol Jsm-7001F). The electrical conductivities of the composites were measured using the two-probe method with a Keithley 6517A Electrometer/High Resistance Meter (Cleveland, OH, USA). Optical measurements of the samples were performed using a Shimadzu UV-3600 PC UV-vis spectrophotometer (Kyoto, Japan).
3 Results and discussion
3.1 Structural analysis of the synthesized CNTs and the ZnO-CNT nanocomposites
Figure 2A and B shows the SEM and HR-TEM images of the synthesized CNTs, respectively. Figure 2A shows the SEM image of the CNTs produced by our reactor system, indicating that the structure consisted of dense bundles of CNTs. The HR-TEM image in Figure 2B shows that dense CNTs were formed. The CNTs were multiwalled carbon nanotubes (MWCNTs). The diameters and lengths of the carbon nanotubes were determined to be 20–30 nm and about 3–5 μm, respectively. The carbon nanotubes were formed from the bundles. Amorphous carbon and other graphitic structures were not observed in the composites, indicating that the CNTs were a pure material.

(A) SEM images, (B) HR-TEM images of carbon nanotubes synthesized via CVD method.
Figure 3 shows the SEM images of undoped ZnO and the doped ZnO containing 0.1, 0.2, and 5 wt% CNTs. These images show that the CNTs were distributed homogenously in 0.1 and 0.2 wt% CNT-reinforced samples, but this was not the case for the 5-wt% CNT-reinforced samples. In certain areas of this sample, the CNT bundles were dissolved, so dispersion of CNTs in the matrix was relatively limited. It was apparent that the production method used in this study was insufficient to dissolve 5 wt% CNTs in the composite material.
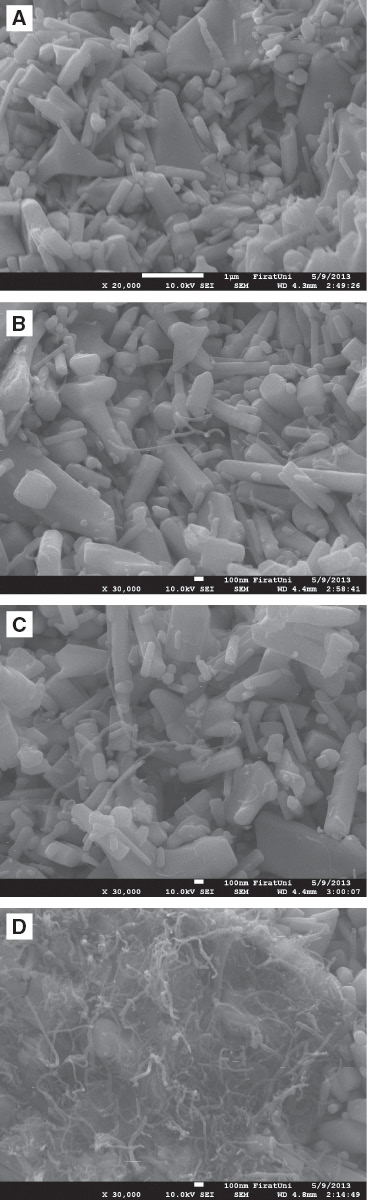
SEM images of the composites (A) undoped ZnO, (B) 0.1 wt% CNT, (C) 0.2 wt% CNT, (D) 5 wt% CNT.
3.2 Electrical conductivity properties of the composites
The electrical conductivities of all samples were measured as a function temperature. Figure 4 shows that the electrical conductivities of all of the samples, except the 5-wt% CNT-reinforced samples, increased as the temperature increased. Although the electrical conductivity change of the undoped sample and 0.1 wt% CNT reinforced sample were clearly seen, the conductivity change of 0.2 wt% CNT reinforced sample slightly increased with increasing temperature. Figure 4 shows that the changes in the electrical conductivity of 0.1 and 0.2 wt% CNT-reinforced samples were the same up to 350 K. The electrical conductivities of the 5-wt% CNT-reinforced samples were essentially unaffected by increases in the temperature. The room temperature conductivity σ25 values of the undoped ZnO, 0.1 wt% CNT, 0.2 wt% CNT, and 5 wt% CNT were found to be 6.55×10⁻⁵, 5.46×10⁻⁴, 1.23×10⁻³, and 2.83×10⁻² S/cm, respectively. It was apparent that the conductivities of the composites increased as the CNT content increased.

Temperature dependent of the electrical conductivity of undoped and CNT-reinforced ZnO composites.
The curves of the undoped ZnO and the 0.1- and 0.2-wt% CNT-reinforced samples can be separated into linear regions (I and II). In each region, the electrical conductivity can be all analyzed by the Arrhenius equation [5, 13]:
where σ0 is the pre-exponential factor, k is the Boltzmann’s constant, and ΔE is the activation energy for the conductivity. The ΔE values for regions I and II were calculated from the linear portions of Figure 4, and they are given in Table 1.
The electronic parameters of the composites.
| Samples | ΔEI (eV) | ΔEII (eV) | σdc (S/cm) |
|---|---|---|---|
| Undoped ZnO | 0.144 | 0.241 | 6.55×10⁻⁵ |
| 0.1% CNT-doped ZnO | 0.085 | 0.324 | 5.46×10⁻⁴ |
| 0.2% CNT-doped ZnO | 0.079 | 0.225 | 1.23×10⁻³ |
| 5% CNT-doped ZnO | – | – | 2.83×10⁻² |
It is well known that many oxygen vacancies exist in ZnO samples and that they cause the formation of defects. The oxygen vacancies that form produce two defects in the donor levels, i.e., deep donor level and the shallow donor level. These levels are located below the conduction band at about 0.3–0.5 eV [14]. It is known that the reason for the electrical conductivity of ZnO at room temperature is the interstitial gaps between the Zn and O atoms that imitate donors [15]. The electron transport of carbon nanotubes occurs on the walls of the nanotubes. The free electrons that can move through the walls of MWCNTs are restrained in the amorphous layer of the MWCNTs [16, 17]. In this study, during the sintering process of the CNT-ZnO composite, the reaction between CNT and ZnO helped to effectively remove the residual amorphous carbon from the surfaces of the nanotubes. The consumption of the amorphous layer by oxygen atoms leads to a decrease in the contact resistance between the MWCNTs, making it easier to form a conducting circuit in the network structure [17]. In addition, oxygen vacancies increase in ZnO during sintering [18]. All of these explained the condition that caused the increase in the electrical conductivity of CNT-ZnO composites for this study.
The room temperature conductivities σ25 values of the 5-wt% CNT-reinforced samples were unusually high, and the electrical conductivities of these samples were almost constant as the temperature was increased. There were several interesting effects associated with the excessive amounts of CNTs, i.e., 1) homogenous dispersion did not occur in the composites; 2) CNTs surrounded the ZnO particles, and the semiconductor characteristics of ZnO were eliminated; 3) the CNTs existed as bundles, and interactions among the CNTs in the bundles were strong, increasing conductivity. Thus, the electrical properties of the 5-wt% CNT-reinforced samples were different from those of the other samples.
3.3 Optical properties of the CNT/ZnO nanocomposites
Figure 5 shows the plots of the diffused reflectance for the undoped ZnO and the CNT-reinforced ZnO composites. Generally, the diffused reflectance of the composites decreased as the CNT content increased. The figure also shows that the diffused reflectance for the undoped ZnO increased as the wavelength increased. The diffused reflectances of the 0.1% and 0.2% CNT-reinforced samples first increased as wavelength increased and then decreased as the wavelength continued to increase. At first, the 5 wt% CNT-diffused reflectances of the reinforced samples increased as wavelength increased to a certain point; after which, further increases in wavelength had very little effect.

Diffused reflectance spectra of samples.
In order to determine the precise value of the optical band gap of undoped and CNT-reinforced ZnO composites, we used the optical absorption method of diffuse reflectance. The reflectance values were converted to absorbance by the application of the Kubelka-Munk function [19–21]. The Kubelka-Munk theory generally is used to analyze the diffuse reflectance spectra obtained from weakly absorbing samples. The Kubelka-Munk formula can be expressed as shown [19–21]:
where R is the diffused reflectance, and F(R) is the Kubelka-Munk function that corresponds to the absorbance. The F(R) values were converted to the linear absorption coefficient by the following relation [21]:
We modified the relation that is used to determine the optical band gap of conventional semiconductors, and it is rewritten as follows:
where A is a constant, Eg is the optical band gap, and n is a constant exponent that determines the type of optical transitions. For indirect allowed transition, n=2; for indirect forbidden transition, n=3; for direct allowed transition, n=0.5; for direct forbidden transition, n=1.5. The optical band gap of the composites was determined from the plots of (F(R)hν)2 versus hν, as shown in Figure 6 and given in Table 2. Table 2 shows that the Eg values of the nano-composites decreased as the CNT content increased.
Optical band gap values of the composites.
| Sample | Eg (eV) |
|---|---|
| Undoped ZnO | 3.26 |
| 0.1% CNT-doped ZnO | 3.24 |
| 0.2% CNT-doped ZnO | 3.23 |
| 5% CNT-doped ZnO | 3.15 |

Plots of (F(R)hν)2 versus the photon energy (hν) of the CNT/ZnO nano-composites.
4 Conclusions
CNTs were prepared successfully by chemical vapor deposition in a fluidized reactor. The CNTs were added to commercial ZnO powder to prepare the nanocomposite. The conductivity σ25 values at room temperature of the undoped ZnO and the 0.1-wt% CNT, 0.2-wt% CNT, and 5-wt% CNT were found to be 6.55×10⁻⁵, 5.46×10⁻⁴, 1.23×10⁻³, and 2.83×10⁻² S/cm, respectively. CNTs in the ZnO matrix increased the electrical conductivity of the ZnO-CNT composites compared to the undoped ZnO; in addition, electrical conductivity increased as the CNT content increased. The electrical conductivities of the 5-wt% CNT-reinforced samples were unusually high compared that of ZnO alone. The reflectance values of the composites decreased as the CNT content increased. The lowest values were obtained for the 5-wt% CNT-reinforced samples. In addition, the optical band gap, Eg, decreased as the CNT content increased. Adding excessive amounts of CNTs significantly improved the electrical properties of the ZnO-CNT nanocomposites, and the optical properties were improved somewhat. However, ZnO lost some of its distinctive properties when excess quantities of CNTs were used in the ZnO-CNT composites. This occurred because it was difficult to disperse the excess CNTs homogenously in the composites.
References
[1] Rao BB. Mater. Chem. Phys. 2000, 64, 62–65.10.1016/S0254-0584(99)00267-9Search in Google Scholar
[2] Ilican S, Caglar M, Caglar Y, Yakuphanoglu F. Appl. Surf. Sci. 2008, 255, 2353–2359.10.1016/j.apsusc.2008.07.111Search in Google Scholar
[3] Caglar Y, Ilican S, Caglar M, Yakuphanoglu F. Spectrochim. Acta A 2007, 67, 1113–1119.10.1016/j.saa.2006.09.035Search in Google Scholar PubMed
[4] Xu HY, Liu YC, Mu R, Shao CL, Lu YM, Shen DZ, Fan XW. Appl. Phys. Lett. 2005, 86, 123107.10.1063/1.1884256Search in Google Scholar
[5] Aydın C, AbdEl-sadek MS, Zheng K, Yahia IS, Yakuphanoglu F. Opt. Laser Technol. 2013, 48, 447–452.10.1016/j.optlastec.2012.11.004Search in Google Scholar
[6] Iijima S. Nature 1991, 354, 56.10.1038/354056a0Search in Google Scholar
[7] Fennimore AM, Cheng LT, Roach DH. Diamond Relat. Mater. 2008, 17, 2005–2009.10.1016/j.diamond.2008.06.009Search in Google Scholar
[8] Pasquini A, Picotto GB, Pisani M. Sens. Actuators A 2005, 123–124, 655–659.10.1016/j.sna.2005.02.036Search in Google Scholar
[9] Gong M, Han T, Cai C, Lu T, Du J. J. Electroanal. Chem. 2008, 623, 8–14.10.1016/j.jelechem.2008.03.020Search in Google Scholar
[10] Sameer I, Bhatia R, Prasad V. Physica B: Condens. Matter 2010, 405, 1709–1714.10.1016/j.physb.2009.12.074Search in Google Scholar
[11] Yan X, Tay BK, Miele P. Carbon 2008, 46, 753–758.10.1016/j.carbon.2008.01.027Search in Google Scholar
[12] Li F, Cho SH, Son DI, Kim TW, Lee S, Cho Y, Jin S. Appl. Phys. Lett. 2009, 94, 11906.10.1063/1.3168411Search in Google Scholar
[13] Tauc J. Amorphous and Liquid Semiconductors, Plenum Press: New York, 1974.10.1007/978-1-4615-8705-7Search in Google Scholar
[14] Fu ZX, Guo CX, Lin BX, Liao GH. Chin. Phys. Lett. 1998, 15, 457–459.10.1088/0256-307X/15/6/025Search in Google Scholar
[15] Ates T, Tatar C, Yakuphanoglu F. Sens. Actuators A 2013, 190, 153–160.10.1016/j.sna.2012.11.031Search in Google Scholar
[16] Song WL, Cao MS, Hou ZL, Fang XY, Shi XL, Yuan J. Appl. Phys. Lett. 2009, 94, 233110–233113.10.1063/1.3152764Search in Google Scholar
[17] Liu Y, Yin X, Kong L, Liu X, Ye F, Zhang L, Cheng L. Carbon 2013, 64, 541–544.10.1016/j.carbon.2013.07.039Search in Google Scholar
[18] Sarkar S, Das PK. Ceram. Int. 2014, 40, 2723–2729.10.1016/j.ceramint.2013.10.049Search in Google Scholar
[19] Morales AE, Mora ES, Pal U. Revista Mexicana De Fisica S 2007, 53, 18.Search in Google Scholar
[20] Kortum G. Reflectance Spectroscopy, Springer-Verlag: New York, 1969.10.1007/978-3-642-88071-1Search in Google Scholar
[21] Yakuphanoglu F. J. Alloys Compd. 2010, 507, 184–189.10.1016/j.jallcom.2010.07.151Search in Google Scholar
©2016 by De Gruyter
This article is distributed under the terms of the Creative Commons Attribution Non-Commercial License, which permits unrestricted non-commercial use, distribution, and reproduction in any medium, provided the original work is properly cited.
Articles in the same Issue
- Frontmatter
- Original articles
- Influence of bis(triethoxysilylpropyl) tetrasulfide amount on the properties of silica-filled epoxidized natural rubber-based composites
- Microstructure-based modeling of the dynamic mechanical properties of SiCp/Al composites
- Effect of moisture content of jute fabric and hybridization structure on the impact properties of jute and jute/glass hybrid composites
- Synthesis, characterization and formulation of sodium calcium silicate bioceramic for drug delivery applications
- Synthesis of iron nanocomposite reinforced by TiC particles via mechanical activation from ilmenite concentrate and carbon black
- The effect of an excessive amount of carbon nanotubes on the properties of zinc oxide-carbon nanotube nanocomposites
- Microstructure and erosion characteristics of Ni-AlN thin films prepared by electrodeposition
- Study on the preparation and characterization of high-dispersibility nanosilica
- Comparing the influence of different kinds of zirconia on properties and microstructure of Al2O3 ceramics
- Structure of intercalated organic montmorillonite and its pyrolysis properties analyzed using the Agrawal integral equation
- Prediction, modeling and characterization of surface texturing by sulfuric etchant on non-toxic titanium bio-material using artificial neural networks and fuzzy logic systems
- Investigation of the WEDM of Al/B4C/Gr reinforced hybrid composites using the Taguchi method and response surface methodology
- A low-cost fiberglass polymer resin dielectric material-based microstrip patch antenna for multiband applications
- Free vibration analysis of axially layered functionally graded short beams using experimental and finite element methods
- Physical properties and microstructures of a BN-NiCoCrAlY laser amorphous-nanocrystal reinforced composite coating