Effect of the amount of SiC, number of strokes, and applied load on the reciprocating wear behavior of Al-SiC composites
-
Jayakumar Lakshmipathy
 and
Balamurugan Kulendran
and
Balamurugan Kulendran

Abstract
The wear behavior of Al/SiC composites prepared by stir casting technique is investigated to find out the effects of the weight percentage of SiC, load, and the number of strokes on a shaper machine. Metal matrix composite (MMC) pins are prepared with different weight percentages of SiC (10%, 15%, and 20%). The tests are carried out with different load conditions (25, 50 and 75 N) and different number of strokes (420,780 and 1605 strokes). Wear surfaces of tested samples are examined in scanning electron microscope (SEM). Hardness and impact tests are also carried out on the MMC samples. The experimental results show that the hardness of composites increases with an increase in SiC particle, and the impact strength decreases with increase in SiC content. The volume loss of MMC specimens are less than that of the matrix alloy. Moreover, the temperature rise near the contact surface of the MMC specimens increases with increase in wt% of SiC, load, and number of strokes. The coefficient of friction decreases with increase in load and the number of strokes.
1 Introduction
Metal matrix composites (MMCs) are mainly used to provide advantages over monolithic metals, such as steel and aluminum. MMCs have several advantages, such as higher elastic properties, higher service temperature, insensitivity to moisture, higher electric and thermal conductivities, as well as better wear, fatigue and flaw resistances. MMCs are widely used in automotive engines because of their high strength and low weight. A variety of metals and their alloys can be used as matrix materials, but aluminum alloys are widely used because of their low density, excellent strength, toughness, and resistance to corrosion. Aluminum matrix composites have applications in the space shuttle, military, and transportation industries [1]. Particle-reinforced MMCs are very important because they are inexpensive and have relatively isotropic properties compared with fiber reinforced composites [2]. Generally, MMCs are employed in moving or sliding applications. Therefore, it is essential to investigate the tribological properties of these materials in order to reflect the behavior of these materials in real situations.
Many investigators have demonstrated the effects of reinforcement size, volume fraction, applied load, sliding distance, and temperature on the dry sliding wear behavior of aluminum matrix composites. Gomez et al. [3] investigated the temperature and velocity transitions in the dry sliding wear behavior of Al-Li/SiC composites and concluded that the reinforcing particles benefit the wear behavior that, in turn, delays the transition to higher normal loads. Hassan et al. [4] studied the effects of adding Cu as alloying element and SiC as reinforcement particles, and found significant improvement in wear resistance with the addition of SiC particles. Ghosh et al. [5] made an inference that the crack density increases with increase in the quantity of reinforcement. They also reported that the specific wear rate increases with decrease of reinforcement size for a certain volume percentage of SiC. Jha et al. [6] concluded that the wear rate and coefficient of friction vary based on the sliding velocity. Rodrigo et al. [7] found that the addition of SiC reduces the plastic deformation and increases wear resistance, while Sahin et al. [8] reported that wear rate of composite decreases with the increase of SiC. Veeresh Kumar et al. [9] investigated the mechanical and dry sliding behavior of Al6061-SiC composites and concluded that the increase of volume fraction of reinforcement increases the wear resistance.
Based on the literature review, we can gather that most of the experiments have been conducted on pin-on disc machine. To the best of our knowledge, very few studies have been carried out by reciprocating wear test method. In the present work, we attempt to correlate the dry sliding wear behavior of cast alloy and the composites by reciprocating test method using a shaper machine.
2 Materials and methods
2.1 Materials
The matrix material selected for the present studies was the Al 7075 T6 alloy (Jindal Aluminium, Ltd., Bangalore), which came in the form of ingots. The chemical composition of Al7075 T6 alloy is shown in Table 1. The SiC (M/s Snam Abrasives Pvt.Ltd, Hosur, TamilNadu, India) with a size of 36 μm was selected as reinforcement material.
Composition of Al 7075 T6 aluminum alloy.
| Material | Fe | Cu | Mn | Mg | Zn | Ti | Cr | Si | Al |
|---|---|---|---|---|---|---|---|---|---|
| Percentage | 0.21 | 1.5 | 0.07 | 2.4 | 5.7 | 0.05 | 0.19 | 0.11 | Remainder |
2.2 Processing
The composite specimens were prepared by stir casting method. For producing Al+10%(wt%)SiC, 2.7 kg of Al7075 alloy was melted at 820°C in the graphite furnace. The SiC particles (300 g) were preheated at 800°C for one hour to remove moisture. A graphite stirrer was used to mix the alloy and SiC particles. The SiC particles were added slowly to the molten metal by gradually increasing the speed of the stirrer by up to 800 rpm. Upon adding the reinforcement, stirring was continued for 8 to 12 min to ensure that the SiC particles were thoroughly mixed into the matrix. Next, the melt was poured onto the green sand mold. The photograph of the mold used for casting and the castings are shown in Figure 1. Similarly, for producing 15% and 20% composition, 2.55 and 2.4 kg of aluminum alloy were mixed with 450 and 600 g of SiC particles, respectively, in the same manner described earlier. From the obtained composites, specimens were prepared for various tests. For the wear test, specimens were prepared with the dimensions 15×15×120 mm. The specimens with the dimensions of 10×10×75 mm and notch at 28 mm from the top were used for Izod test. Similarly, specimens with dimensions of 10×10×55 mm and notch at 28 mm from the top were used for the Charpy test.

Photograph of (A) mould and (B) castings.
2.3 Hardness test and impact test
The hardness of cast alloy and their composites containing 10%, 15%, and 20% (wt%) of SiC was determined using Brinell hardness tester (Model: TKB 3000, Balancing Instruments & Equipments Pvt. Ltd., Miraj, Maharashtra, India) with a 10-mm steel ball indenter at an applied load of 5000 N. The impact strengths of matrix alloy and their composites were determined using KI-300 model of Krystal Elmec (Ichalkarnji, Maharashtra, India) impact testing equipment for the Izod test and the FIT-300 model of Fine Testing Machines (Miraj, Maharashtra, India) for the Charpy test.
2.4 Wear test
The reciprocating wear tests were conducted using a shaper machine (D.M. Kapur & Sons, Model: BS 18, Ludhiana, Punjab, India). The shaper machine is used for machining the metals to the required shape. In the present work, an attempt was made to utilize the reciprocating action of shaper machine to determine the wear behavior of the composites and the matrix alloy. The specimen was mounted onto the tool holder, and the EN 32 steel plate with a 15 cm length was fitted over the work table. Figure 2 shows the experimental setup used for the wear tests.

Experimental setup used for the wear tests.
The wear tests were performed at normal loads of 25, 50, and 75 N corresponding to vertical movements of 1, 2 and 3 mm, respectively. The depth of cut (vertical movement) was converted to load (e.g., depth of 1 mm=25 N). The conversion was made using proving ring. The proving ring was placed under the tool holder, such that the specimen should have the light contact with the top surface of the proving ring pan, now the 1-mm cut was made by rotating the vertical feed screw, the corresponding deflection was noted in the proving ring display, then the proving ring was unloaded and taken away from the machine. The same deflection was achieved by adding the weight over the pan; thus the equivalent load value was found for the corresponding vertical movement.
Initially, the test specimen and EN 32 steel plate surface was prepared by polishing with emery sheet 420 grit size, which was then cleaned with acetone solution to remove the presence of any dust particles. The initial weight of the specimen was weighed using electronic balance (Model: 200DX) with an accuracy of 0.1 mg. The specimen was mounted onto the tool holder, and the k type thermocouple was attached to the specimen near the contact surface. A vibrometer was fitted on top of the specimen, which was connected to the transmitter, while the receiver was connected to the computer. The whole set up (vibrometer, transmitter, and receiver) is called Wireless Vibration Acquisition System (WVAS) (Trident Tech Labs Pvt. Ltd., Bangalore, Karnataka, India). The WVAS integrated with MATLAB software was used to record the time versus amplitude plot during the test. Figure 3 shows the transmitter and receiver of WVAS.

(A) WVAS transmitter and (B) receiver.
Friction forces were measured from the transducer, which was placed under the steel plate. The specimen was made to have a contact with the steel plate, and a load of 25 N was applied (i.e, 1 mm depth of cut) by keeping the number of strokes (420 strokes) as constant. The test was conducted for 30 min. The different speeds available in the machine were 180, 340, and 725 rpm, with the corresponding number of strokes/min set at 28, 52 and 107, respectively. Each test was conducted for 30 min; therefore, for the first speed (i.e., 180 rpm), the number of strokes was 840 (i.e., 28×30). During the forward stroke, only the wear took place, and therefore the number of effective strokes was at 420 strokes. At the end of the test, the temperature raise near the contact surface and the frictional force was observed.
During the test the time versus amplitude plot was recorded. The final weight of the specimen was measured after the test. The mass loss of the specimen was calculated by finding the difference between the initial and final weight. Volume loss was measured through the ratio of mass loss (kg) to density (kg/m3) of the alloy and its composites. The measured values of mass loss for all the specimens tested were converted into volume loss using the measured density of the alloys. The mass loss of the specimen was used to study the respective effects of SiC addition, load, and number of strokes on the wear resistance of the composite materials. The worn surfaces of the samples were examined using SEM.
3 Results and discussion
3.1 Hardness studies
The Brinell hardness of the cast Al7075 T6 matrix alloy and its composites containing 10%, 15% and 20% SiC were determined using a steel ball indenter at an applied load of 5000 N. The hardness results are shown in Figure 4. We observed that the hardness of the composites increase along with an increase in SiC content. This is attributed to the fact that the reinforcement particles possess higher hardness, which increases the hardness of the composites.

Brinell hardness of Al7075-SiC composites with different SiC compositions.
3.2 Impact strength
The impact strengths of the cast alloy and its composites containing 10%, 15%, and 20% SiC were determined using the Charpy and Izod tests. Figure 5 shows that the impact strength decreases with an increase of wt% of SiC. This is attributed to the fact that the brittleness of the material increases as hardness increases, thus reducing the impact strength of the composites. These results are in agreement with those reported by Unlu [10] and Ozben et al. [11].

Impact strengths of Al7075-SiC composites with different SiC compositions.
3.3 Wear behavior
3.3.1 Volume loss of alloy and its composites as a function of SiC composition
Figure 6 shows the volume losses of composites for different loads at 420 strokes; as can be seen, the volume loss decreases with increase of SiC weight percentage. The volume loss of the matrix alloy is more than that of the composites. Increasing the weight percentage of the reinforcement improves the hardness of the composites, which in turn, improves the wear resistance of the composites [12]. Similarly, Figures 7 and 8 show the volume losses of the matrix alloy and its composites at 780 and 1605 strokes, respectively. From Figures 7 and 8, it can be seen that as the number of strokes increases, the volume loss also increases. For example, the volume loss of Al+10% SiC at 25 N is 0.01056 m3 with 420 strokes, 0.0139 m3 for 780 strokes, and 0.0522 m3 for 1605 strokes. Furthermore, when the load increases, the volume loss increases. The composite with 20% SiC exhibits better wear resistance compared with the matrix alloy and other compositions. Kumar et al. [13] previously reported that the wear resistance of the alloy is improved by the addition of the SiC particle.
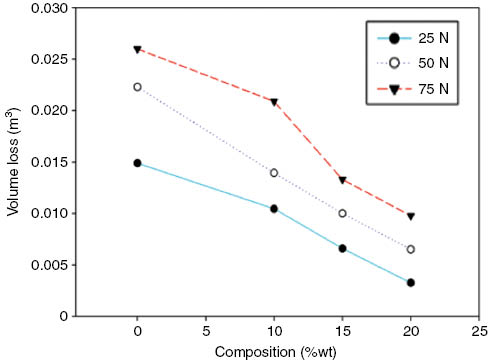
Volume loss of alloy and its composites as a function of SiC composition at 420 strokes.

Volume loss of alloy and its composites as a function of SiC composition at 780 strokes.

Volume loss of alloy and its composites as a function of SiC composition at 1605 strokes.
3.3.2 Volume loss of alloy and its composites as a function of load
Figures 9–11 show the volume losses of alloy and their composites as a function of load (420, 780 and 1605 strokes, respectively). As can be seen, when the load increases, the volume loss also increases. The composite with 20% SiC shows better wear resistance at higher loads compared with the matrix alloy. This is because the wear rate increases with increase in sliding speed and applied load [14].

Volume loss of alloy and its composites as a function of load at 420 strokes.

Volume loss of alloy and its composites as a function of load at 780 strokes.

Volume loss of alloy and its composites as a function of load at 1605 strokes.
3.3.3 Volume loss of alloy and its composites as a function of the number of strokes
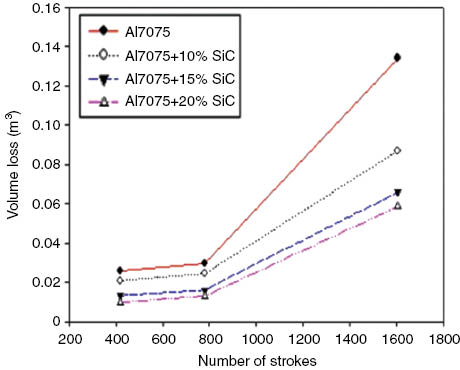
Figures 12–14 show that volume loss increases with the increase in the number of strokes at different load conditions. The increase in the number of strokes increases the sliding distance, thereby leading to increased volume loss.

Volume loss of alloy and its composites as a function of number of strokes at 25 N.

Volume loss of alloy and its composites as a function of number of strokes at 50 N.
Volume loss of alloy and its composites as a function of number of strokes at 75 N.
3.3.4 Increase in contact temperature as a function of the number of strokes
The increase in contact surface temperature near the contact surface was recorded during the test. From Figures 15–17 it can be seen that when the number of strokes increases, the contact temperature also increases. Compared with the matrix alloy, the temperature rise is greater in the composites. For example, the temperature increases in the matrix alloy at a 25 N load and 420, 780 and 1605 strokes are 44°C, 48°C and 49°C, respectively. For the same conditions, the increased temperatures in Al with 20% SiC are 58°C, 79°C, and 92°C. Similarly, for the load 50 N the increased temperatures in Al with 20% SiC are 60°C, 81°C and 91°C; while those for 75 N are 70°C, 92°C, and 110°C. Furthermore, it can be observed that the temperature near the contact surfaces increases with an increase in applied load. Greater frictional heating can be attributed to greater heat generation, which depends on the amount of SiC particles present in the composites, the number of strokes, and the applied load. These results are in agreement with those reported by Rao et al. [15]

Increase in contact temperature of alloy and its composites as a function of the number of strokes at 25 N.

Increase in contact temperature of alloy and its composites as a function of the number of strokes at 50 N.

Increase in contact temperature of alloy and its composites as a function of the number of strokes at 75 N.
3.3.5 Coefficient of friction as a function of the number of strokes
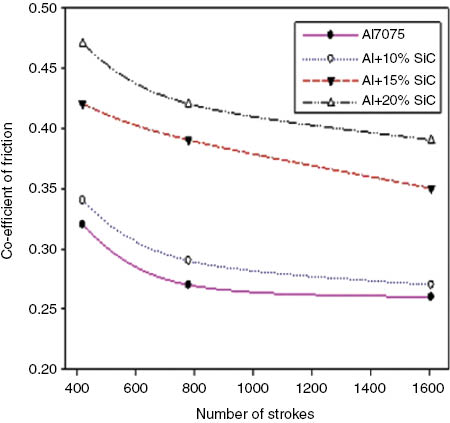
Figures 18–20 show the effects of the number of strokes and the load on the coefficient of friction. The figures show that the coefficient of friction decreases with increase in applied load, and that the number of strokes also increases with increased SiC content. Higher coefficients of friction can be attributed to the amount of reinforcement particles present in the composites. Meanwhile, the reduced coefficients of friction can be attributed to the increase in the number of strokes and the applied load. When the number of strokes increases, the sliding distance also increases with increased contact temperature, thus leading to the softening of the surface. In turn, this leads to more slipping action between the contact surfaces, which leads to reduced coefficient of friction [16, 17]. Hence, the coefficients of friction of the composites are higher than those of the matrix alloy.

Coefficients of friction of alloy and its composites as a function of the number of strokes at 25 N.
Coefficients of friction of alloy and its composites as a function of the number of strokes at 50 N.

Coefficients of friction of alloy and its composites as a function of the number of strokes at 75 N.
3.4 Wireless Vibration Acquisition System
The Wireless Vibration Acquisition System is used to observe the asperities contacts in between the two contact surfaces. Wireless Vibration Acquisition System interfaced with MATLAB software was used to record the amplitudes during the test. The amplitude plots were obtained for maximum strokes (1605) and the maximum load (75 N) for different SiC compositions. From Figures 21(A–C), it can be noted that the number of peak amplitude can be observed from the amount of reinforcement particle. This is due to the fact that there are more reinforcement particles that come into contact with one another between the two contacting surfaces. It can also be observed from the same figures that the matrix alloy with 10% SiC has less number of peak amplitudes compared with the Al+15%SiC and Al+20% SiC alloys. The greater number of strokes and the maximum load contribute to greater debris generated between the surfaces. This is demonstrated by the higher number of peak amplitudes in composites with 20%SiC. The previous work carried out by Sudarshan and Surappa [18] present the LVDT records with sliding distance.
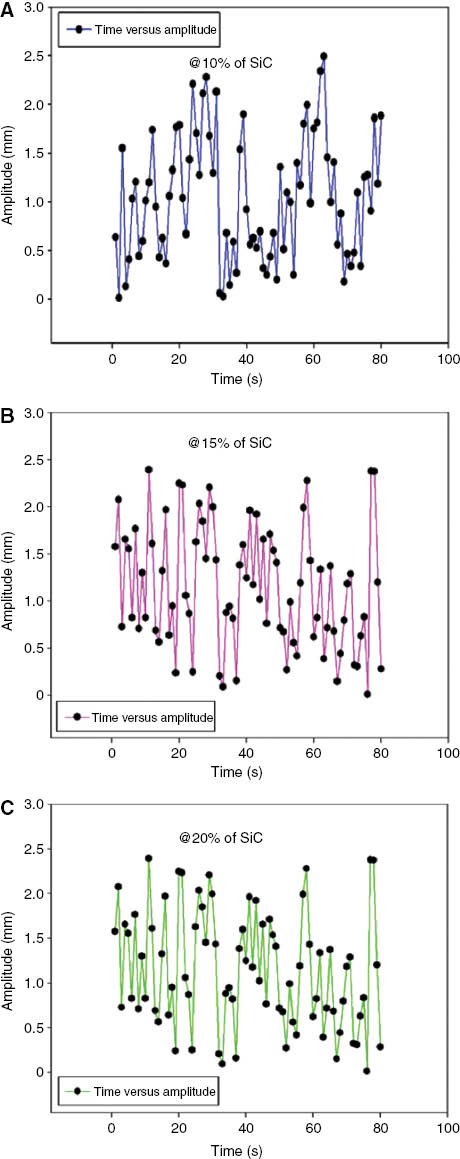
Amplitude versus time graph at max.load and max.strokes of (A) Al with 10%SiC (B) Al with 15%SiC, and (C) Al with 20% SiC.
3.5 Microstructure studies
Figures 22(A–C) the optical micrographs of composites with 10%, 15% and 20% SiC, respectively. The microstructure shows silicon particles with at the grain boundaries and black particles of Mg2 Si distributed in a matrix of aluminum solid solution throughout the structure.
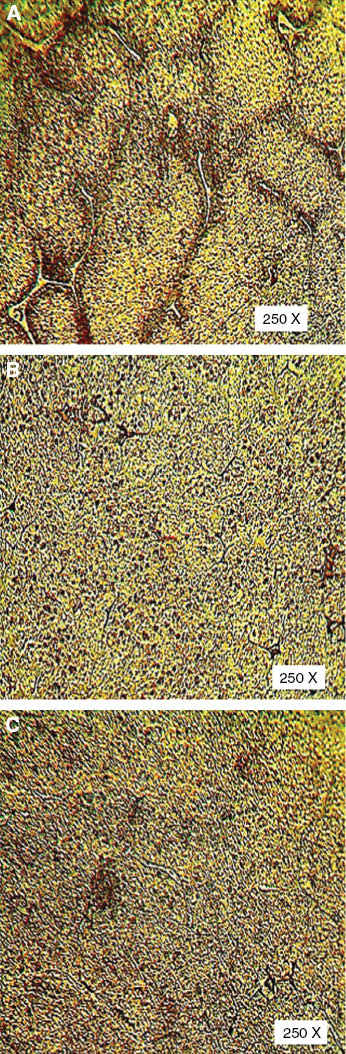
Optical micrographs of (A) Al7075-10%SiC, (B) Al7075-15% SiC, and (C) Al7075- 20% SiC.
3.6 Worn surfaces of alloy and its composites
The worn surfaces of alloy and its composites with 10%, 15%, and 20% SiC at a load of 75 N and 1605 strokes were observed using SEM. Figure 23(A) shows the SEM graph of the matrix alloy, and indicates the more fragmented particles and damaged regions. Figure 23(B) shows the SEM graph of the worn surface of Al with 10% SiC, and presents deep grooves and the removal of material in the wavy form. Figure 23(C) shows the SEM micrograph of Al-15%SiC, and presents the small grooves and less wear regimes. The worn surface of composite with 20% SiC is shown in Figure 23(D), which shows very few fragmented particles and very small wear grooves. Hence, the incorporation of SiC improves the hardness, strength, and Young’s modulus of the composite materials as compared with the alloy. The high temperature resistance, hardness and modulus of elasticity of the composites increase with increased SiC content [19–21]. As a result, the volume loss of the composite is noted to be significantly lower than that of the alloy.

SEM micrographs of the worn surfaces of the (A) matrix alloy, (B) Al with 10%SiC, (C) Al with 15% SiC, and (D) Al with 20% SiC.
4 Conclusions
The tribological behaviors of the Al 7075 T6 alloy and its composites containing 10%, 15% and 20%(wt%) SiC have been experimentally analyzed using reciprocating wear test method, leading to several conclusions listed below.
The hardness of composites increases with increased SiC content. The composite with 20%(wt%) SiC exhibits maximum hardness of 50 BHN.
The impact strength of the composites decreases with increased wt% of SiC reinforcement.
The composite with 20% SiC reinforcement shows better wear resistance compared with the matrix alloy and other composites.
An increase in the number of strokes leads to volume loss increase; in addition, an increase in the number of strokes and wt% of SiC leads to higher contact temperature.
The coefficient of friction is reduced with increased number of strokes and applied load. The coefficients of friction for composites are generally higher than those of the matrix alloy.
The amplitude versus time graph was recorded using WVAS. A greater number of peak amplitude is observed for the Al-20% SiC composite.
The formation of wear grooves and fragmented particles is observed at the maximum number of strokes and maximum load. The composite with 20% SiC shows less wear regime compared with the alloy and other composites.
Acknowledgments
The authors gratefully acknowledge the assistance of the NanoTechnology Research Center (NRC), SRM University, Chennai, Tamil Nadu, India for supporting this study.
References
[1] Kaw AK, Mechanics of Composite Materials, 2nd ed., Taylor & Francis: New York, 2006.10.1201/9781420058291Search in Google Scholar
[2] Chawla KK, Composite Materials Science and Engineering, 3rd ed., Springer: New York, 2012.Search in Google Scholar
[3] Gomez-del Rio T, Rico A, Garrido MA, Poza P, Rodriguez J. Wear. 2010, 268, 700–707.10.1016/j.wear.2009.11.006Search in Google Scholar
[4] Hassan AM, Alrashdan A, Hayajneh MT, Mayyas AT. Tribol. Int. 2009, 42, 1230–1238.10.1016/j.triboint.2009.04.030Search in Google Scholar
[5] Ghosh SK, Saha P. Mater. Des 2011, 32,139–145.10.1016/j.matdes.2010.06.020Search in Google Scholar
[6] Jha N, Anshul Badkul, Mondal DP, Das S, Singh M. Tribol. Int 2011, 44, 220–231.10.1016/j.triboint.2010.10.004Search in Google Scholar
[7] Rodrigo P, Campo M, Torres B, Escalera MD, Otero E, Rams J. Appl. Surf. Sci. 2009, 255, 9174–9181.10.1016/j.apsusc.2009.06.122Search in Google Scholar
[8] Sahin Y, Kilicli V. Wear. 2011, 271, 2766–2774.10.1016/j.wear.2011.05.022Search in Google Scholar
[9] Veereshkumar GB, Rao CSP, Selvaraj M. Composites: part B. 2012, 43, 1185–1191.10.1016/j.compositesb.2011.08.046Search in Google Scholar
[10] Bekir Sadik Unlu. Mater. Des. 2008, 29, 2002–2008.10.1016/S1261-694X(08)75448-8Search in Google Scholar
[11] Ozben T, Kilickap E, Cakir O. J. Mater. Process. Technol. 2008, 198, 220–225.10.1016/j.jmatprotec.2007.06.082Search in Google Scholar
[12] Bauri R, Surappa MK. Wear. 2008, 265, 1756–1766.10.1016/j.wear.2008.04.022Search in Google Scholar
[13] Kumar S, Balasubramanian V. Tribol. Int. 2010, 43, 414–422.10.1016/j.triboint.2009.07.003Search in Google Scholar
[14] Onat A. J. Alloys and Comp. 2010, 489, 119–124.10.1016/j.jallcom.2009.09.027Search in Google Scholar
[15] Rao RN, Das S. Mater. Des. 2010, 31, 1200–12207.10.1016/j.matdes.2009.09.032Search in Google Scholar
[16] Rao RN, Das S, Mondal DP, Dixit G. Wear. 2009, 267, 1688–1695.10.1016/j.wear.2009.06.034Search in Google Scholar
[17] Mousavi SMR, Abarghouie S, Reihani SM. J. Alloys and Comp. 2010, 501, 326–332.10.1016/j.jallcom.2010.04.097Search in Google Scholar
[18] Sudarshan S, Surappa MK. Wear. 2008, 265, 349–360.10.1016/j.wear.2007.11.009Search in Google Scholar
[19] Das S, Mondal DP, Sawla S, Ramakrishnan N. Wear. 2008, 264, 47–59.10.1016/j.wear.2007.01.039Search in Google Scholar
[20] Dasgupta R. Tribol. Int. 2010, 43, 951–58.10.1016/j.triboint.2009.12.060Search in Google Scholar
[21] Alidokht SA, Abdollah-Zadeh A, Soleymani S, Assadi H. Mater. Des. 2011, 32, 2727–2733.10.1016/j.matdes.2011.01.021Search in Google Scholar
©2015 by De Gruyter
This article is distributed under the terms of the Creative Commons Attribution Non-Commercial License, which permits unrestricted non-commercial use, distribution, and reproduction in any medium, provided the original work is properly cited.
Articles in the same Issue
- Frontmatter
- Original articles
- The adsorption kinetics and thermodynamics of cationic surfactants on graphite oxide
- An energy-based equivalent inclusion for the determination of nanocomposite behavior
- Fabrication of aluminum wires treated with nanocomposite pellets
- Morphology and ferroelectric properties of Ce-substituted Bi4 Ti3 O12 thin films prepared by sol-gel method
- Effect of additive Al2 O3 powders on micro-arc oxide coating of magnesium alloy
- The flexural behaviors of the impacted composite single-lap adhesive joints
- Investigations on interface microstructure and strength properties of dissimilar tin bronze/superalloy diffusion bonded joints
- Damage behavior of potting materials in sandwich composites with pinned joints
- Low velocity impact behaviour of glass fabric/epoxy honeycomb core sandwich composites
- Properties of PVA-reinforced cement-bonded fiberboards processed with calender extrusion
- Preparation of optimal feedstock for low-pressure injection molding of Al/SiC nanocomposite
- The effects of open holes on the fracture behaviors and mechanical properties of glass fiber mat composites
- The effect of hybridization and boundary conditions on damping and free vibration of composite plates
- Effect of the amount of SiC, number of strokes, and applied load on the reciprocating wear behavior of Al-SiC composites
- Stabilization of clayey subgrade with waste pumice for road infrastructure