Surface-enhanced Raman spectroscopy in forensic analysis
-
Aidan P. Holman
 and
Dmitry Kurouski
and
Dmitry Kurouski


Abstract
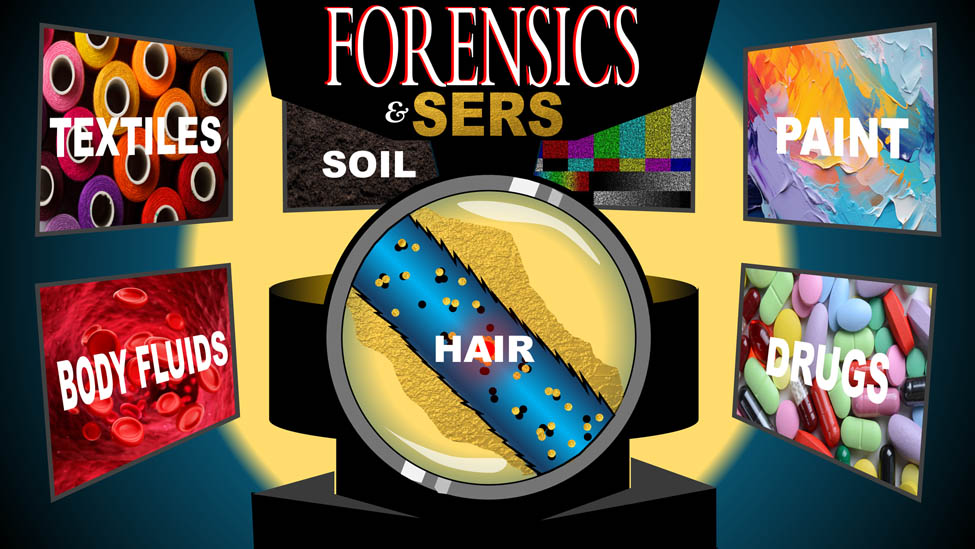
Surface-enhanced Raman spectroscopy (SERS) is a modern analytical technique that can be used to determine the structure and composition of analyzed specimens at the molecular level. This technique is also minimally invasive and destructive. This and other advantages of SERS against traditional techniques used in forensics make it the ideal method for the identification of bodily fluids, soil constituents, drugs and chemicals, and colorants on or in hair, fabric, and paints. In this article, we first introduce the reader to the fundamental physical properties of SERS. Next, we discuss the most recent findings that are focused on SERS-based analyses of physical evidence related to forensics research. Finally, we provide a critical overview of where the future of SERS should be in forensics science.
Graphical abstract
1 Introduction
To date, several standards-setting bodies, including the American Academy of Forensic Sciences Standards Board or Academy Standards Board (ASB), the International Organization for Standardization (ISO), and the American Society for Testing and Materials (ASTM) International, have established standards for the forensic analysis of diverse materials such as hair, textiles, paint, soil, drugs, and bodily fluids and stains. These comprehensive standards predominantly highlight techniques such as mass spectrometry (MS), infrared (IR) spectroscopy, gas chromatography (GC), DNA sequencing, and forensic microscopy, which have found widespread use in forensic laboratories globally [1,2,3,4,5,6]. Despite the versatility of these methods, each is susceptible to replacement by another deemed more efficient for specific types of evidence. Rarely does one technique demonstrate superior efficiency for all mentioned evidence types. But that is exactly what surface-enhanced Raman spectroscopy (SERS) achieves – a method that’s held its ground in research since its emergence in the early 1970s [7].
In the realm of forensic science, conventional Raman spectroscopy (RS) has faced a gradual acceptance and integration into routine laboratory practices [8]. Despite experimental demonstrations dating back to the 1928s [9], RS has only recently gained widespread application in forensic practice [10]. The primary challenges of RS include its weak signal – only about one scattered photon out of 10,000 is Raman active – and the intense luminescence exhibited by some samples when exposed to laser excitation [11]. Luminescence interference often obscures the weak Raman features of specimens and is usually mitigated by utilizing different excitation sources with frequencies far from the molecules’ electronic transitions.
Plasmonic nanoparticles (NPs) composed of metals such as silver (Ag), gold (Au), copper (Cu), and alloys have emerged as subjects of increased research interest [12,13,14,15]. This interest stems from the localized surface plasmon resonance (LSPR) phenomenon exhibited when these NPs are illuminated by incident light [16,17,18]. LSPR can dramatically enhance Raman spectral signatures, around a million-fold, giving SERS, a technique leveraging this phenomenon, its characteristic high sensitivity compared to RS [19,20,21]. Along with this property, SERS is touted as non-destructive, non-invasive, and highly expeditious compared to other techniques like DNA analysis, which may take weeks or months [22,23]. Despite these advantages, forensic standards-setting organizations, namely ASB, ISO, and ASTM, have not yet issued updated standards for including the SERS analysis of the aforementioned evidence types.
In what follows, we will discuss SERS in a way that bolsters forensic evidence analysis in hopes of catching the attention of forensic standards-setting organizations, advocating for the standardization and integration of SERS into established practices. First, we will further explain the theory behind RS and SERS, as well as the costs and benefits of its different forms. Then, we will present the most relevant current and past applications of SERS related to forensic analysis of hair, textiles, paint, soil, drugs, and bodily fluids and stains. In the final part, we will summarize the position of SERS and its most powerful methodology, as well as discuss future applications and challenges.
2 Theory and substrates of SERS
2.1 Theory of RS
RS is based on inelastic light scattering, a physical phenomenon that was first experimentally demonstrated by C.V. Raman, an Indian researcher. Inelastic light scattering is caused by an exchange of energy of incident photons with molecules present in the sample. In dispersive mode instruments, inelastically scattered photons are dispersed on gratings according to their energies and then captured by CCD cameras. The resulting spectra exhibit vibrational bands that represent shifts in photon energies (Raman shift, cm−1) in the x-axis, while their intensity is depicted on the y-axis, expressed in terms of intensity (counts). If the excitation wavelength matches the absorption band of the molecular analyte, a resonance Raman effect is observed [10,11]. This effect provides 106 enhancements to the Raman scattering from certain types of molecules present in the sample, allowing their prompt detection and identification at relatively short (1–2 s) acquisition times and or low intensities (total power) of laser light [24]. However, this effect can obscure the detection of other analytes present in the sample that do not exhibit the same resonance effect (Figure 1a). Exploring how Raman activity varies with different wavelengths is essential to achieve the most well-defined spectrum for your specific sample.
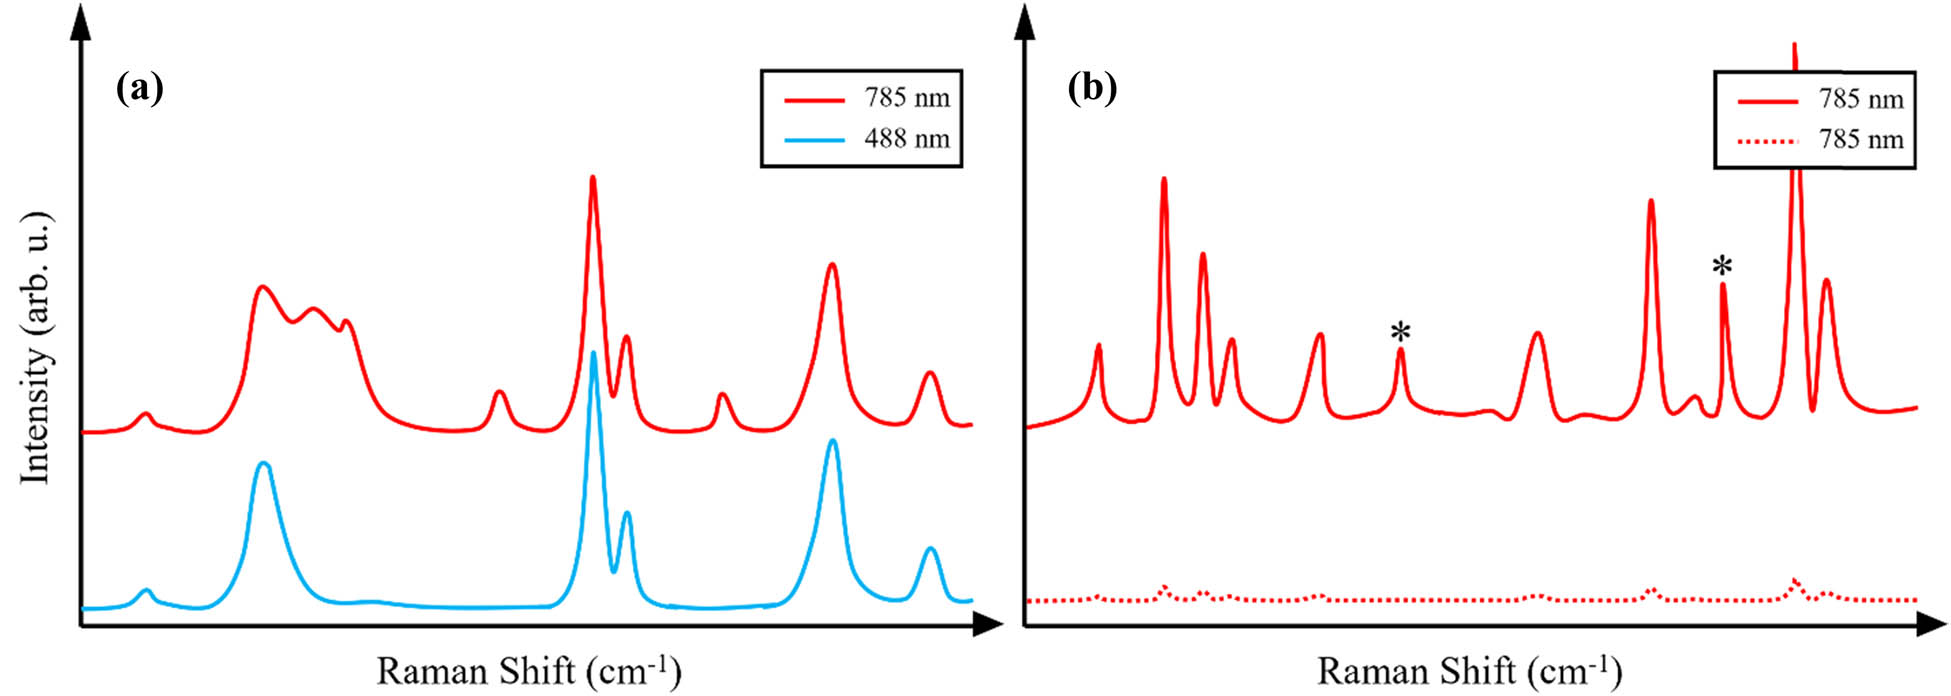
The Raman spectrum graphs of (a) an unidentified substance at its resonance wavelength of 488 nm, exhibiting certain peaks with heightened intensity, overshadowing other peaks in contrast to a non-resonant-specific wavelength of 785 nm for molecules within the substance; and (b) the enhanced spectrum of a surface-enhanced substance (solid line) compared to the same substance under conventional RS (dotted line). Peaks at bands that correspond to scattering from NPs are denoted by (*).
At a microscopic level, the occurrences of “Raman active” transitions arise from alterations in the polarizability of a molecule induced by distortions in its electron cloud during its interaction with incident light. It is important to note the distinction from IR spectroscopy, a well-known counterpart and alternative to RS, which operates based on variations in dipolar moments. These transitions materialize as molecular stretches or vibration modes brought about by photon interaction. Specific transitions are observable in both Raman and IR spectra, presenting varying levels of selectivity. Polarized bonds, such as C–O and O–H, showcase distinct IR bands attributed to substantial changes in dipole moment arising from charge motion. Nevertheless, their Raman scattering is comparatively weaker since the vibrational motion induces only minor additional polarization effects through changes in bond length. Conversely, more neutral bonds like C–C and C═C emerge as robust Raman scatterers, experiencing significant alterations in polarizability during atomic motion. As such, they generate weaker IR bands due to limited variations in dipole moment. It is important to note that all these movements (molecular transitions) stem from electrons transitioning to higher energy (excited) states.
Upon returning from an excited state to a lower energy state, the molecular entity can either emit a photon with the same energy as the one that initially collided with it, termed Rayleigh scattering, or it can emit a Raman photon scattered in all possible directions (Figure 2). This emitted photon may originate from relaxation to an energy state higher than the initial one, resulting in lower energy than the incident photon (termed “Stokes” photons). Alternatively, it can stem from relaxation to a lower energy state than the initial one (termed “anti-Stokes” photons). Consequently, the same vibration mode gives rise to both Stokes and anti-Stokes photons. The Raman shifts of Stokes and anti-Stokes photons are equal in magnitude but opposite in sign, appearing on Raman spectra on either side of the Rayleigh scattering, serving as the zero-energy reference point. Raman peaks corresponding to Stokes and anti-Stokes photons represent positive and negative Raman shift energies, respectively, on the right and left sides of Rayleigh scattering. In common practice, Stokes photons are typically acquired to determine the vibrational fingerprint of analyzed samples.
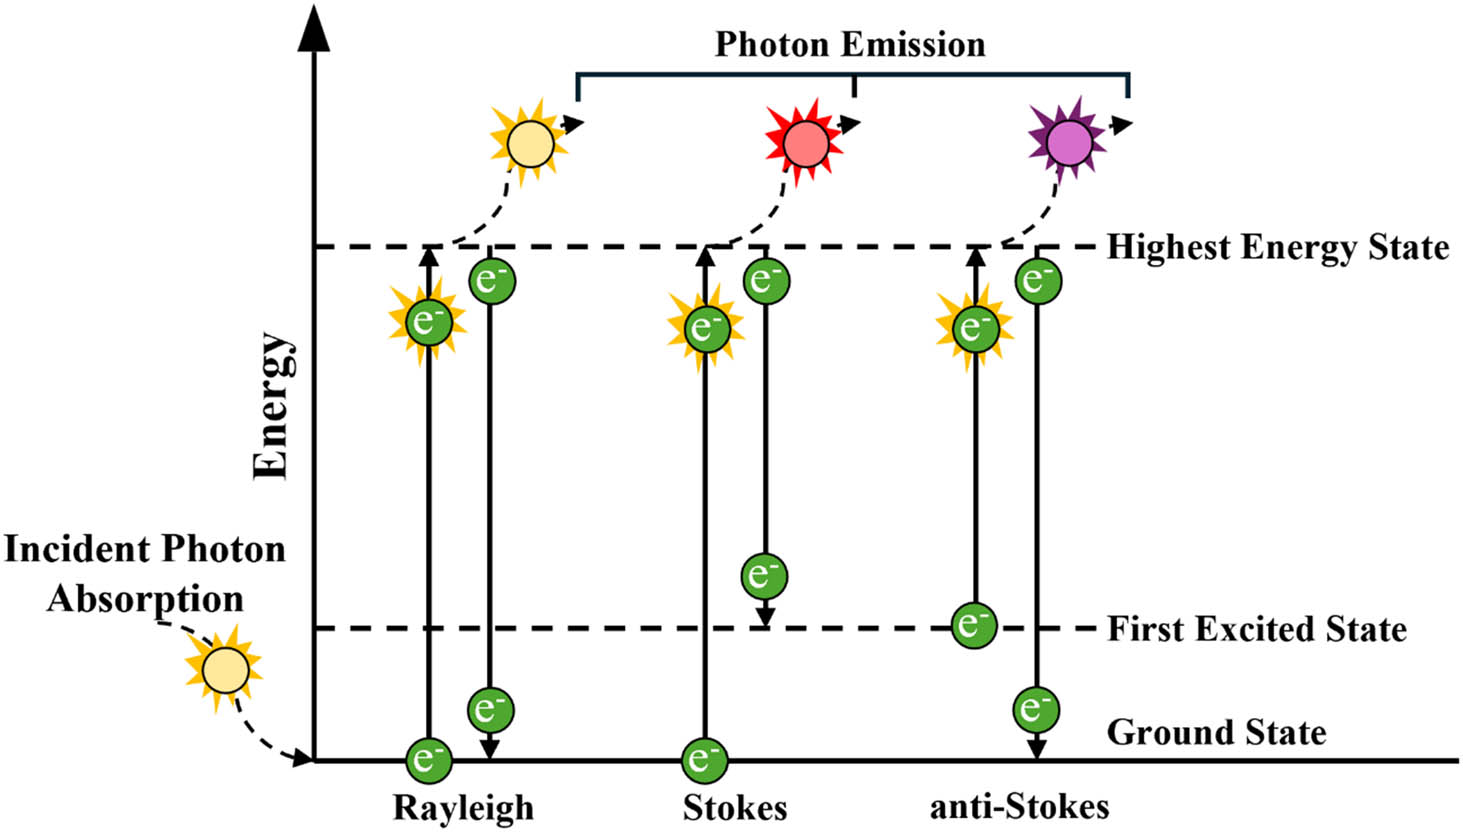
A diagram depicting the change in energy states between Rayleigh, Stokes, and anti-Stokes Raman scattering. Energy states reflect vibronic and not electronic transitions.
2.2 What is SERS?
SERS takes advantage of the enhanced Raman scattering signals obtained from molecules adsorbed on nanostructured metallic surfaces [18,21,25]. In the realm of molecular analysis, SERS provides an exceptional boost in sensitivity and allows for the detection and characterization of trace amounts of substances, which is crucial in forensic science. The enhancement in signal intensity is determined by physical and chemical mechanisms [25,26]. The physical mechanism is attributed to the LSPRs, the collective oscillations of conductive electrons on the surface of noble metal NPs such as Ag and Au, when hit with incident light (Scheme 1) [27]. At the same time, the chemical mechanism is mostly determined by a charge transfer that takes place between nanostructure and molecular analytes [26,28,29,30]. A more detailed description of both mechanisms of SERS can be found in the excellent reviews by Stiles et al. [17] and Langer et al. [31]. It should be noted that besides Ag and Au, traditional plasmonic metals, Cu, Al, and Mg, can be used to fabricate plasmonic nanomaterials that exhibit strong signal enhancement in visible parts of the electromagnetic spectrum [32]. Finally, not only colloidal nanostructures, but other SERS substrates offer strong enhancement factors. Van Duyne and co-workers reported the first wavelength-tunable SERS substrates that were based on Au- or Ag-coated silicon beads packed on a glass slide of a silicon wafer [33,34]. In this case, the size of silicon beads determined the plasmonic properties of such substrates [33,35]. If removed by scotch tape, silicon beads would leave highly regular Au- or Ag-islands on the surface of a glass slide of a silicon wafer [36]. These substrates, known as periodical particle arrays, also provided excellent enhancement properties, enabling single-molecule detection [27]. More information about the plasmonic performance of solid-state type SERS substrates could be found in excellent reviews by Kleinman et al. [37] and Kurouski et al. [38].
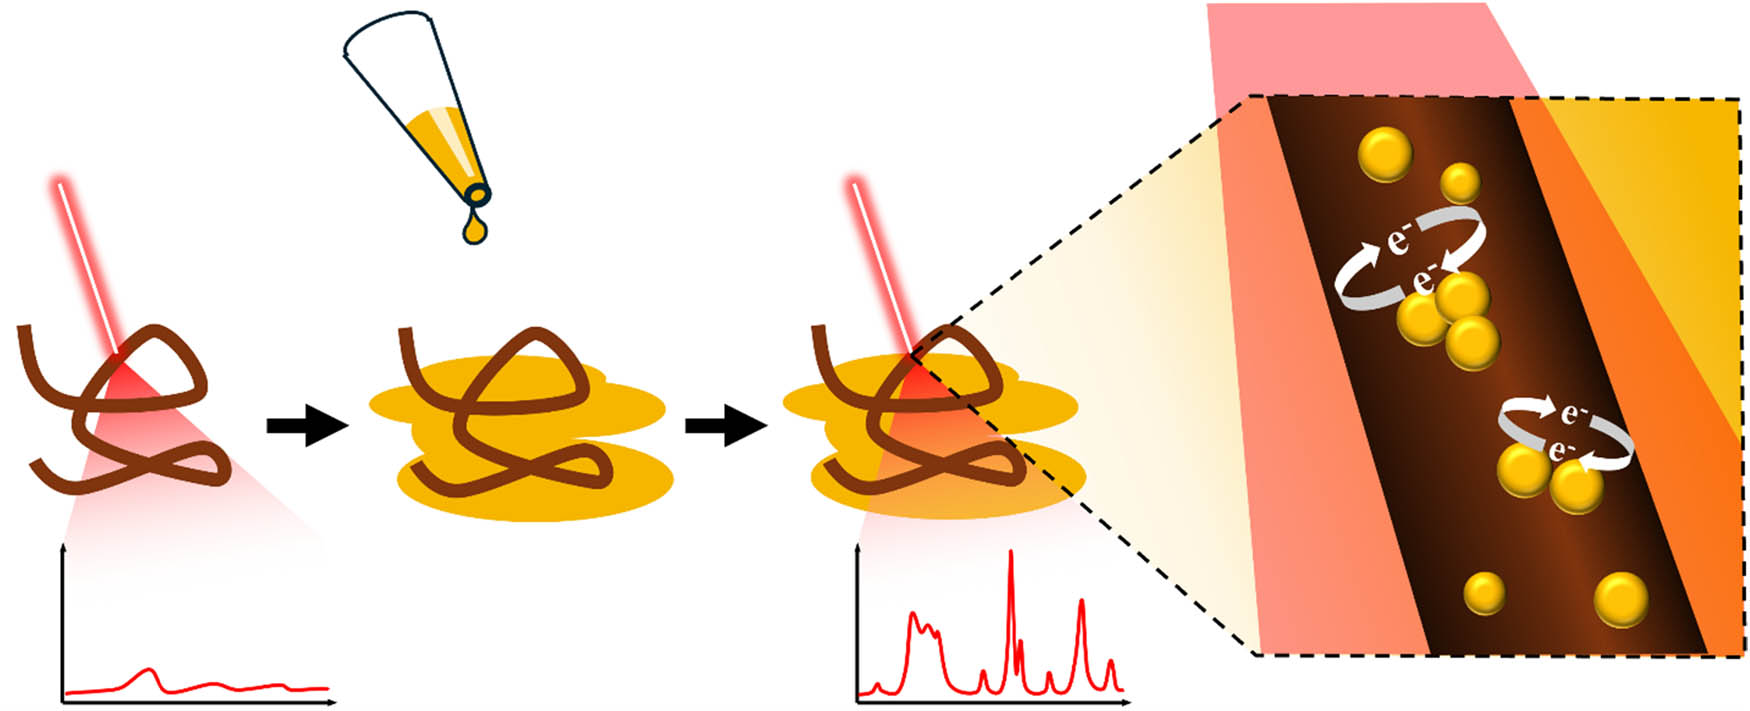
A schematic showing how a conventional Raman spectrum of a strand of hair can be significantly intensified with the addition of (Au)NPs, which absorb the incident light (red) and, when in close proximity to each other, induce a strong electromagnetic field from the sharing of their electrons.
When the frequency of the incident light matches the absorbance peak(s) of metal NPs, the absorption of light by the nanostructures generates LSPRs on their surfaces, which cause significant enhancement of the electromagnetic field near the metal surface [20,21]. This, in turn, enhances Raman scattering from the molecules located in close proximity to the metallic surfaces (Figure 1b) [19,39]. Therefore, whereas in RS, the selection of excitation light relies on sample absorbance, in SERS, the choice of the excitation laser is primarily determined by the NPs employed [17,36,40].
LSPRs depend on the size of the NPs, their metallic composition, and the media in which NPs are present [17,37]. Consequently, LSPRs can be tuned and optimized by various synthetic approaches to fabricate nanostructures with the desired optical properties [25,41,42]. This tuning contributes to an enhancement factor that can be substantial, recorded to be on the order of 103 to 108 [43], making SERS a highly sensitive technique for the detection of even single molecules [18]. It should be noted that such high enhancement factors can be expected in the case of close proximity of molecular analytes to the metallic surfaces. With an increase in the distance between the analyte and the nanostructure, the enhancement factor drops exponentially [41].
Moreover, in RS, the presence of fluorescence, as a stronger physical phenomenon, often hampers the quality of Raman spectra, creating challenges such as overlapping peaks at characteristic marker bands for important compounds. In contrast, SERS presents a compelling solution to this issue. Close proximity of nanostructures results in a drastic enhancement of electric field in their junction [18,25]. In these sites, also known as “hotspots,” the electric field can be 1,000–10,000 times higher compared to the surface of the single nanostructures [18]. Therefore, molecular species located in hotspots primarily contribute to the acquired SERS spectra [44]. This unique feature not only mitigates the effects of fluorescence but can, in some instances, virtually eliminate them.
2.3 Choice of substrate for SERS
One may ask, with the various NPs used in research, is there one NP that forensics could solely rely on instead of having to switch between multiple? Let us break down the documented uses of each type of NP, discuss which one possesses greater forensics diversity (a larger presence in multiple areas of evidence), which is more cost-effective, which is more shelf-stable, and which is more adaptable for the choice of incident light (Table 1). As previously discussed, NPs that are mainly used in forensics are made of noble metals – Au, Ag, Cu, and alloys.
A multiple-comparison chart for the presence in forensics-related research, cost-effectiveness, shelf-life, and longest wavelength range between Au-, Ag-, Cu-, and Au–Ag-NPs
| Characteristic | AuNPs | AgNPs | CuNPs | Au-AgNPs |
|---|---|---|---|---|
| Popular for forensics (top 2) | ✔ | ✔ | ✖ | ✖ |
| Cost-effective (top 2) | ✖ | ✔ | ✔ | ✖ |
| Shelf-life (top 2) | ✔ | ✖ | ✖ | ✔ |
| Wavelength range (top 2) | ✔ | ✖ | ✔ | ✖ |
| Most efficient | ✔ | ✖ | ✖ | ✖ |
Gold nanoparticles (AuNPs) exist in SERS-based research on hair, textiles, paint, soil, drugs, and bodily fluids and stains. The plasmonic qualities of AuNPs allow for the adoption of incident light with a wavelength between 575 and 1,250 nm [16]. Despite Au being more expensive than Ag and Cu, AuNPs have a longer shelf life than silver nanoparticles (AgNPs) and copper nanoparticles (CuNPs), up to 24 months compared to 19 and 2 months, [45–47] respectively. Similar to AuNPs, AgNPs have a performance range of 550–1,250 nm [16]. Research utilizing AgNPs is typically used for the same applications as AuNPs – hair, textiles, paint, soil, drugs, and bodily fluids and stains. Relative to these evidence types, CuNPs have been documented in drug and bodily fluid research and allow for a plasmonic performance range between 400 and 1,000 nm [16,48]. Additionally, they also possess the lowest shelf life due to the quick oxidizing properties; however, because of the extremely low cost of Cu, relative to the other metals, it is the most cost-effective metal for NPs [45]. The main alloy-based NP is Au–Ag. Despite having to purchase both Au and Ag derivatives to craft Au–AgNPs, they do possess a longer shelf life than AuNPs and possess similar resonance enhancement effects [49]. Unfortunately, Au–AgNPs are one of the newest NP creations and, currently, seemingly only exist in drug and explosives-related forensics research with an optimal wavelength range of 350–750 nm [50–52]. It should be noted that NP fabricated from other metals, including aluminum and magnesium, could be used for SERS. However, due to their quick oxidation under ambient conditions, they are generally not selected [32,53].
From the evaluated qualities of each kind of NP, the most successful one is AuNPs, based on the diversity of forensic applications, shelf-life, and range of wavelengths. This is not to say AuNPs are superior to all types of SERS substrates, with the advent of new ones and the continuance of research surrounding alloy-based NPs, this may change. This evaluation and the majority of the following discussion are to show that the adoption of AuNPs still allows for a wide range of evidence analysis, with the hopes of simplifying and standardizing SERS research without losing accuracy and efficiency.
3 Forensic applications of SERS
3.1 SER analysis of human hair
Hair is a common piece of forensic evidence because, on average, each person loses about 100 hairs daily. In the field of forensic hair analysis, forensic microscopy, and DNA sequencing are the most common techniques to analyze hair and, with combined efforts, reveal the race or racial origin and sex of the individual. However, with forensic microscopy limited to three racial origin types – Caucasoid, Mongoloid, and Negroid – DNA sequencing is often preferred. Forensic microscopy can go further and reveal whether a hair was dyed and, if the root is attached to the hair, how long it was dyed. But with the rapid degradation of the root of a hair outside of its follicle, identifying this information is up to chance. Thankfully, research utilizing SERS has shot forward with the amount of information it can elucidate from dyed hair.
In 2015, Kurouski and Van Duyne showed that different colorants could elicit well-defined spectra from dyed hair with varying permanencies using AuNPs (rod-shaped) [14]. When compared to spectra from undyed hair, SERS generated significantly more intense spectra of dyed hair (Figure 3). This was all extracted from dyed regions on the shaft of the hair, with no requirement for the presence of the bulb or root. SER spectra were acquired with a 785 nm laser with ∼0.4 to 1.5 mW power (Figure 3). Providing properties, such as keeping the laser diameter no greater than the sample’s and listing the ingredients or colorants for each dye, set the stage for other research groups to explore SERS analysis of dyed hair for the potential information it could elicit.
![Figure 3
Schematic illustration of SERS analysis of hair (left) and SER spectra (right) of human hair colored with Ion Blue Sky (trace A), normal Raman (NR) spectrum of Basic Blue 77 (trace B), NR spectra of human hair colored with Ion Blue Sky (trace C), and undyed hair (trace D). P = 0.36 mW, λ = 785 nm. Reproduced from Kurouski and Van Duyne [14].](/document/doi/10.1515/revac-2023-0079/asset/graphic/j_revac-2023-0079_fig_003.jpg)
Schematic illustration of SERS analysis of hair (left) and SER spectra (right) of human hair colored with Ion Blue Sky (trace A), normal Raman (NR) spectrum of Basic Blue 77 (trace B), NR spectra of human hair colored with Ion Blue Sky (trace C), and undyed hair (trace D). P = 0.36 mW, λ = 785 nm. Reproduced from Kurouski and Van Duyne [14].
Many of the following studies aimed to unravel whether the colorant could still be detected under certain conditions such as household and crime scene contamination [23,54], heat, sun, and water exposure [55–57] as well as if multiple layers of dye were present on the sample of interest [58]. In the studies related to hair contamination with household and crime scene components, dyed hair was exposed to blood, bleach, wine, orange juice, and much more to assess the ability to extract SER spectra from possible contaminations that one might find in or outside a home. The results showed that the dyed hair, once washed, still gave a highly discernable spectrum after contamination with all things except prolonged exposure to bleach (Figure 4). The studies that focused on sun and water exposure revealed the extent to which SERS could be used to extract information about dyes on the hair of decedents who were left in an area with access to direct sunlight and within the hypolimnion (bottom) of a lake, where decomposition readily occurs. The results showed that SERS allowed for the precise identification of each colorant for up to 10 weeks in daytime and 12 weeks submerged in hypolimnion water.
![Figure 4
SER spectra of semi-permanent blue dyed hair contaminated before (left) and after washing with deionized water (right). Reproduced from Juarez and Kurouski [54].](/document/doi/10.1515/revac-2023-0079/asset/graphic/j_revac-2023-0079_fig_004.jpg)
SER spectra of semi-permanent blue dyed hair contaminated before (left) and after washing with deionized water (right). Reproduced from Juarez and Kurouski [54].
Our group recently demonstrated that SERS could be used to identify more than 30 different colorants, as well as predict their color and manufacturer [59]. This information can help determine the individual the hair belonged to, whether the person dyed their hair, and what color is circumstantial. It remained unclear whether SERS could surpass forensic microscopy and/or DNA sequencing.
At least, until other research surfaced showing the promise of using a combination of machine learning and SERS to identify the race, sex, and age group of individuals from analyzed dyed hair [60]. The study used partial least squares discriminant analysis (PLS-DA) to calibrate a model based on SER spectra from the dyed hair of 10 individuals that identified as Hispanic, Caucasian, male, female, etc. Figure 5 shows the averaged spectra from all subject’s dyed hair from analysis done by SERS (left) and FT-IR (right). The PLS-DA models showed great promise with greater than or equal to 89% accuracies for each identification done with SER spectra, but a range of 0–75% accuracies for FT-IR spectra to allow for the identification of different ages, races, and colorants from individuals. Furthermore, attempts were made at building a post-mortem interval (PMI) model using PLS-DA from SER spectra of dyed hair exposed to harsh weather such as sun and deep-water [55,56]. The models gave high accuracies, over 90% on average. These projects included SER spectra that were acquired with a 785 nm laser with 1.8 mW power and 1–35 s acquisition times. The majority of discussed articles used the Nikoobakht and El-Sayed method for the synthesis of their AuNPs [61].
![Figure 5
Mean (solid black line) and standard deviations (color-filled areas) of averaged spectra from SERS (left) and FT-IR spectroscopy (right) of each colorant from all subjects. Reproduced from Holman and Kurouski [60].](/document/doi/10.1515/revac-2023-0079/asset/graphic/j_revac-2023-0079_fig_005.jpg)
Mean (solid black line) and standard deviations (color-filled areas) of averaged spectra from SERS (left) and FT-IR spectroscopy (right) of each colorant from all subjects. Reproduced from Holman and Kurouski [60].
The collection of studies that delved into furthering the presence of SERS in forensic hair analysis showed promise for not only meeting the expectations of forensic microscopy and DNA sequencing but surpassing them by revealing more information about the dye, such as the brand and exact colorant, as well as the age of an individual and the potential involvement of hair analysis in PMI determinations.
3.2 SER analysis of textiles
The predominant methods of forensic fabric analysis are IR spectroscopy, GC–MS, and forensic microscopy [62]. While IR spectroscopy and forensic microscopy aim at identifying the nature of the fibers in the fabric, GC–MS works on identifying the colorant on the fabric. SERS proves particularly adept at enhancing molecules from colorants, as it was discussed in the context of dyed hair. Thus, it aligns well that colorants from fabrics have been shown to be well-differentiated using SERS [63,64].
In 2019, Puchowicz et al. utilized SERS, IR, Raman, UV–visible diffuse reflectance, and fluorescence spectroscopy to detect red, yellow, and blue dyes with different color intensities on fabric [65]. The researchers found that SERS was able to identify all three colorants compared to the other techniques. It should be noted that AgNPs were utilized in this study with 785 nm excitation and 10 s spectral acquisition time (Figure 6) [65].
![Figure 6
SEM images of undyed cotton: (a) unmodified, (b) modified with one-layer AgNPs, and (c) modified with five layers AgNPs. SEM images were taken using a VEGA LMU SEM microscope (Tescan, Czech Republic) with 100× magnification. Reproduced from Puchowicz et al. [65].](/document/doi/10.1515/revac-2023-0079/asset/graphic/j_revac-2023-0079_fig_006.jpg)
SEM images of undyed cotton: (a) unmodified, (b) modified with one-layer AgNPs, and (c) modified with five layers AgNPs. SEM images were taken using a VEGA LMU SEM microscope (Tescan, Czech Republic) with 100× magnification. Reproduced from Puchowicz et al. [65].
Separately, Liu et al. demonstrated the capability of AuNP-coated silk, a natural fiber, to enhance the signal for crystal violet [66]. Ranging from starting concentrations of HAuCl4 in 10−9 to 10−5 M concentrations, each gave strong, well-defined spectra of crystal violet (Figure 7). Later, Yao et al. applied the AuNPs to cotton fabric, instead of silk, to differentiate organic dyes commonly applied to fabric and some artwork [64]. This kind of innovative approach broadens the scope of forensic fabric analysis, offering new avenues for the detection and identification of substances crucial to investigative processes.
![Figure 7
SER spectra of different concentrations of crystal violet on the AuNP-treated silk fabrics. Reproduced from Liu et al. [66].](/document/doi/10.1515/revac-2023-0079/asset/graphic/j_revac-2023-0079_fig_007.jpg)
SER spectra of different concentrations of crystal violet on the AuNP-treated silk fabrics. Reproduced from Liu et al. [66].
Furthermore, coating fabric with AuNPs instead of dispensing them on substances offers a range of advantages. First, it enhances stability by providing a durable substrate, preventing AuNPs detachment or aggregation over time. The fibrous structure of fabric contributes to increased surface area, promoting efficient interaction between analytes and AuNPs, thereby enhancing the sensitivity of SERS. Moreover, the uniform distribution of AuNPs across the fabric ensures consistency in SERS measurements, minimizing variability in signal enhancement, as is seen when similar research studies utilize varying concentrations and densities of AuNPs.
Overall, the incorporation of SERS into laboratories that perform fabric analysis has many benefits in terms of a range of capabilities. The unique adoption of NPs “sewn” into natural fabrics like silk and cotton for SERS work to further the spectroscopic analysis of liquid substances such as dyes, biological fluids, and other aqueous substances, that otherwise give large fluorescent and luminescent disruption in techniques such as IR spectroscopy.
3.3 SER analysis of paints
At least one more type of evidence that greatly benefits from SERS enhancement of colorants is paints. But unlike hair and fabric, paints are primarily made from pigment, not dyes [67]. Pigments are distinguished from dyes in that they are insoluble in most solvents, and in particular, they are insoluble in the solvent used for the paint itself. Dyes, in contrast, are soluble, and they are not used in most paints, as they are less durable than pigments and also because they are usually too transparent; it would be difficult and probably cost-prohibitive to try to incorporate enough dye into paint to make it opaque. The forensic analysis of paints is usually completed with the help of forensic microscopy, colorimetry, and X-ray powder diffraction (XRD) for vehicle and artwork theft and (accident) reconstruction.
In 2010, Casadio et al. identified organic pigments and glaze substances within Winslow Homer’s “For to Be a Farmer’s Boy” (1887) and Annibale Carracci’s “Saint John the Baptist Bearing Witness” (1510) [68]. They compared AgNPs on different substrates at 632.8 nm excitation wavelength with 0.005 mW power and 1 s acquisition times per spectrum (Figure 8). This was the first documented use of SERS for artwork conservation science and its ease of reproducibility and cost-effectivity led to numerous methodological reproductions for other artwork.
![Figure 8
Comparison of different Ag colloid substrates: (a) alizarin (1.0 × 10⁻³ M) on silica gel substrate with citrate-reduced silver colloids; (b) alizarin (1.0 × 10⁻³ M) on substrate fabricated with 390 nm SiO2 spheres; (c) alizarin-dyed reference fiber (wool); (d) alizarin present in a minute fragment from a Peruvian textile (A.D. 800−1350; 1955.613). Spectra C and D were obtained by direct application on the fiber of a colloidal paste obtained by centrifugation of Ag colloids prepared via the standard Lee and Meisel procedure. λ
0 = 632.8 nm, 5 μW power at the sample, 1 s acquisition for all spectra. Reproduced from Casadio et al. [68].](/document/doi/10.1515/revac-2023-0079/asset/graphic/j_revac-2023-0079_fig_008.jpg)
Comparison of different Ag colloid substrates: (a) alizarin (1.0 × 10⁻³ M) on silica gel substrate with citrate-reduced silver colloids; (b) alizarin (1.0 × 10⁻³ M) on substrate fabricated with 390 nm SiO2 spheres; (c) alizarin-dyed reference fiber (wool); (d) alizarin present in a minute fragment from a Peruvian textile (A.D. 800−1350; 1955.613). Spectra C and D were obtained by direct application on the fiber of a colloidal paste obtained by centrifugation of Ag colloids prepared via the standard Lee and Meisel procedure. λ 0 = 632.8 nm, 5 μW power at the sample, 1 s acquisition for all spectra. Reproduced from Casadio et al. [68].
In 2019, Shabunya-Klyachkovskaya et al. analyzed 18 pigments in 9 easel paintings and icons from Belarussian artwork in collaboration with the National Art Museum of the Republic of Belarus [69]. Each inorganic pigment and filler within the paints were identified and the spectra were compiled into a digital library. Of note, only 1 µg or less of each paint sample was needed to conduct the analysis with applied AuNPs (12–50 nm diameters) and 500–700 nm excitation.
SERS has yet to be applied to research regarding paint and other coating identifications for vehicle crimes. However, its efficacy in pigment and dye enhancement suggests its potential application in this area.
3.4 SER analysis of soil
Forensic soil analysts (or forensic geologists) use a wide combination of techniques (mainly spectroscopic) to compare collected and referenced soil samples for casework, namely, Raman and IR spectroscopy, X-ray fluorescence spectroscopy, XRD, laser diffraction, thermal analysis, and MS [70]. These methods primarily distinguish soils by identifying the variety of vibrational modes, shapes, and sizes of the minerals, microorganisms, and particles in each sample. The numerous techniques contribute to a more thorough analysis and greater confidence in the origins of soil samples, and because of this, SERS is unlikely to replace all of them. However, it may serve to replace some or at least be an efficient addition.
An important but often forgotten aspect of soil is the microbiome. Roughly 1 g of soil contains billions of microorganisms, with each location containing a unique concoction of different species and numbers [71]. Thus, comparing the microbiome of soil samples in forensic soil analysis provides a high amount of confidence for the compatibility of samples, which is usually done using quantitative polymerase chain reaction and DNA sequencing techniques, with results given from weeks to months [72]. The two most successful suspensions for the AuNPs were citrate and thioglucose, which yielded 89.7–100% accuracies for bacterial species identification using support vector machine algorithms.
In 2019, He et al. investigated the capability of SERS to detect trace amounts of pesticides in soil [13]. While the same minerals can exist in different locations with sometimes equal concentrations, pesticides are arguably individualistic since the soil from two different locations would not necessarily have pesticides applied by the same person or in the same manner. The group showed that SERS could be used to detect chlorpyrifos (CPF), a chemical found commonly in pesticides, with a limit of detection (LOD) of 0.025 mg·kg−1 which is below the national US standard of 0.05 mg·kg−1 (Figure 9) [13]. Additionally, they provided a thorough analysis of the most adept size of NPs and wavelength of incident light, which was found to be 13 nm AuNPs at a 519 nm wavelength.
![Figure 9
(a) SER spectra of CPF with AuNPs at different concentrations ranging from 0.01 to 10 mg·L−1. (b) A linear equation of Raman characteristic peak intensity and its concentration at 530, 560, 610, and 674 cm−1 of the CPF molecule. Reproduced from He at al. [13].](/document/doi/10.1515/revac-2023-0079/asset/graphic/j_revac-2023-0079_fig_009.jpg)
(a) SER spectra of CPF with AuNPs at different concentrations ranging from 0.01 to 10 mg·L−1. (b) A linear equation of Raman characteristic peak intensity and its concentration at 530, 560, 610, and 674 cm−1 of the CPF molecule. Reproduced from He at al. [13].
Furthermore, Ahmad demonstrated the applicability of SERS-based detection of polycyclic aromatic hydrocarbons (PAHs) within soil and (from) seawater [73]. PAHs are usually found in high concentrations in seawater as a result of gas pollution. He showed that at a 671–785 nm incident, SERS allowed for a LOD of 0.5 nmol·L−1 of PAHs in seawater-suspended soil (Figure 10). To obtain his spectra, he fastened AuNPs to an optical fiber probe that he inserted into the soil and seawater. The adaptability of SERS to not only capture fluorescence in dry samples but aqueous samples is remarkable.
![Figure 10
SER spectra of (a) fluoranthene and (b) phenanthrene in solid state; 785 nm diode laser with a power of 70 mW, integration time of 1 s. Reproduced from Ahmad [73].](/document/doi/10.1515/revac-2023-0079/asset/graphic/j_revac-2023-0079_fig_010.jpg)
SER spectra of (a) fluoranthene and (b) phenanthrene in solid state; 785 nm diode laser with a power of 70 mW, integration time of 1 s. Reproduced from Ahmad [73].
Unfortunately, SERS itself has not been well documented in detecting soil minerals, whereas its parent method, RS, has shown excellent demonstration. Normal RS can be easily performed in a laboratory equipped for SERS. Obviously, SERS is well-adjusted for different chemical pollutants from numerous sources and a soil’s microbiome. With this range of utilization, SERS can be a great addition to the arsenal of a forensic soil scientist.
3.5 SER analysis of drugs
The presence of SERS in toxicological studies is extreme. The current methods utilized by forensic toxicologists are mainly MS, GC, liquid chromatography, and high-performance liquid chromatography [74]. There is a growing advocacy for the integration of RS into contemporary forensic toxicological analysis, including discussions on SERS [75–77]. These efforts have yielded results to some extent. Notably, crime laboratories under the purview of the Federal Bureau of Investigation, US Drug Enforcement Administration, various Customs and Border Protection agencies, as well as police forces across Europe, Asia, and Australia have incorporated handheld Raman spectrometers (HRSs). These instruments are used for the analysis of numerous suspicious drugs and chemicals. However, their capabilities are not fully maximized, lacking the broader range of possibilities that could be accessed with the inclusion of AuNPs.
For example, Smith et al. introduced a quantitative SERS strategy for fentanyl using an HRS with an 830 nm laser [78]. In their study, a AuNP solution was blended with aqueous fentanyl samples across a concentration range of 0.003–1,697 μM (approximately 1.0 ng·mL−1 to 571 μg·mL−1) for detection purposes. The reported LOD was 0.003 μM (approximately 1 ng·mL−1), and the method successfully identified fentanyl at 1% and 2% concentrations within heroin and glucose mixtures. The researchers acknowledged the impact of interfering compounds on the method’s quantitative accuracy and noted the difficulty in distinguishing fentanyl from four fentanyl analogs.
In a recent study conducted by Gozdzialski et al. in 2022, the application of AuNPs in the analysis of Etizolam was investigated within real samples [79]. These samples presented a significant challenge due to their complexity, containing various mixtures of opioid drugs and diluent compounds, including fentanyl. The study involved the analysis of 100 samples, and the obtained results were compared with those obtained using test strip technology (Table 2). Remarkably, the SERS method demonstrated exceptional superiority over the test strip technology in terms of accuracy and sensitivity.
Summary of the sensitivity (true positive rate) and specificity for detection of etizolam with benzodiazepine (“benzo”) test strips on opioid samples (n = 509) where fentanyl was present, and benzo test strip tests were performed (completed Nov 2020–Jul 2021)
| Benzo test strips on opioid samples (n = 509) | Benzo test strips on subset (n = 98)* | SERS on subset (n = 100)* | |
|---|---|---|---|
| True positive (n) | 60 | 4 | 48 |
| True negative (n) | 248 | 48 | 43 |
| False positive (n) | 29 | 0 | 7 |
| False negative (n) | 164 | 46 | 2 |
| Sensitivity (%) | 26.8 | 8.0 | 96.0 |
| Specificity (%) | 89.5 | 100.0 | 86.0 |
Results are also shown for the subset tested using the method as described for SERS (n = 100), compared to the test strip data on those same samples. Reproduced from Gozdzialski et al. [79].
*Note that in two of the samples that underwent testing with SERS, the benzo test strip data were absent and therefore n = 98 in this case.
Over the past decade, synthetic cannabinoids have maintained a consistent presence in the drug landscape, making frequent appearances in forensic laboratories across the United States. Segawa et al. introduced a SERS method specifically designed for the detection of synthetic cannabinoids in herbal materials [80]. This innovative approach utilized AuNPs co-aggregation wet system for SERS. The sample preparation involved a combination of an aggregating agent (NaCl), the sample, and an AuNP solution. Measurements were conducted using both a 785 nm portable Raman instrument and a 785 nm benchtop Raman. While the authors successfully obtained SERS signals for cannabinoid standards, they noted that certain herbal samples required the addition of methanol to facilitate the solvation of analytes from the plant material into solution. This method represents a valuable contribution to the forensic detection of synthetic cannabinoids, addressing the challenges posed by complex, man-made herbal matrices.
Calling back to the previous discussion on NP-fused fabric for analysis of dried liquid substances, Karn-orachai and Ngamaroonchote used Au-, Ag-, and Au–Ag-NP-fused fabric to analyze water contaminated with ampicillin [81]. They acquired each spectrum in 1 s at 633 nm excitation. The Au–Ag-NP substrate generated the best spectrum (based on the presence of the characteristic band at 1,004 cm−1 for ampicillin) at an equal or greater concentration of Au–Ag compared to all other concentrations and other substrates (Figure 11).
![Figure 11
SERS response of bare and ampicillin-coated plasmonic fabrics with different Au–Ag ratios. Reproduced from Karn-orachai and Ngamaroonchote [81].](/document/doi/10.1515/revac-2023-0079/asset/graphic/j_revac-2023-0079_fig_011.jpg)
SERS response of bare and ampicillin-coated plasmonic fabrics with different Au–Ag ratios. Reproduced from Karn-orachai and Ngamaroonchote [81].
The illicit production of new chemical substances and their introduction into the recreational drug market is an ever-evolving process that continuously shapes the landscape of toxicology. Forensic chemistry laboratories face the challenge of managing budgets, addressing backlogs, and ensuring swift reporting times while contending with these novel compounds. Thus, the need for analytical methods that are high-throughput, versatile, sensitive, and cost-effective is crucial. SERS has the potential to fulfill these requirements and could become a valuable technique in present-day forensic laboratories that are merely missing one key ingredient – plasmonic NPs.
3.6 SER analysis of bodily fluids and stains
The forensic analysis of biological fluids is primarily done to identify the individual and authenticity of the fluid (fake vs. real) and whether it comes from the reproductive or peripheral fluid. All of this is usually done using presumptive and confirmatory tests and DNA analysis. But with the extensive waiting periods forensic laboratories can have to give DNA results, the pain relief of victims and loved ones is made further away. SERS has shown exceptional capabilities for the high-throughput analysis of blood and reproductive fluid.
In 2020, Shaine et al. demonstrated a highly accurate and reproducible technique for extracting bloodstains using 1 μL 50% HAc to be then scanned with SERS illuminated with a 785 nm laser [82]. The SERS occurred by spreading 80–100 nm AuNPs over a 1 mm2 SiO2 chip. The 50% HAc demonstrated itself as the best solvent compared to equal volumes of saline and deionized water (Figure 12). Compared to the spectra of NR-acquired blood, these gave much smoother spectra with almost no peak shifting and some peak knockouts. This method also showed promise for detecting hemoglobin, methemoglobin, lysed red blood cells, and hematin by themselves, which are components of blood. Each spectrum took 10 s to acquire with 0.3 mW of power. Relative to normal RS, the SERS bloodstain identification described here offers much higher sensitivity (up to 105 diluted blood). The same group showed their method could extract unique spectra from vaginal and seminal fluid, urine, and saliva with 100% sensitivity and 100% selectivity (from partial least squares discriminant analysis).
![Figure 12
Comparison of 785 nm SERS spectra of 24 h dried neat blood extracted by 1 μL of water, saline solutions, and 50% HAc normalized by the maximum value of the HAc spectrum. SERS spectra of two different dried blood samples are shown here (solid and dashed lines, respectively). Reproduced from Shaine et al. [82].](/document/doi/10.1515/revac-2023-0079/asset/graphic/j_revac-2023-0079_fig_012.jpg)
Comparison of 785 nm SERS spectra of 24 h dried neat blood extracted by 1 μL of water, saline solutions, and 50% HAc normalized by the maximum value of the HAc spectrum. SERS spectra of two different dried blood samples are shown here (solid and dashed lines, respectively). Reproduced from Shaine et al. [82].
Other groups have shown promise for research concerning forensic pathologists and epidemiologists who study pathogens in biological material. Wang et al. showed that the Malaria pathogens, Plasmodium falciparum and P. vivax, could be distinguished from pathogens that cause Dengue fever and the West Nile Virus infection, as well as healthy (non-infected) blood [83]. The LOD was 10−5 M, just as for Shaine’s group, with 785 nm excitation and AuNPs suspended on a glass slide with no apical modifications. They reported a completion time of 30 min to finish scanning 25 patient blood samples.
The forensic analysis of bodily fluids is essential for identification and authenticity determination, but traditional methods result in low accuracies and long wait times. SERS shows promise for high-throughput analysis of blood and reproductive fluids. Shaine et al. [82] demonstrated a precise SERS technique for bloodstains, extending its application to identify various fluids with high sensitivity. Wang et al. [83] highlighted SERS’s potential in distinguishing Malaria pathogens, offering insights for forensic applications with a half-hour completion time for 25 patient samples.
4 Limitations of SERS and alternative outcomes
SERS provides several key advantages over conventional vibrational spectroscopies, such as NR and IR spectroscopy, to forensic sciences. (i) SERS offers a strong enhancement of Raman scattering from samples. This enables the detection and identification of analytes of interest at the single-molecule level. (ii) SERS is also minimally invasive and destructive to analyzed samples. Finally, (iii) colloidal NPs used for SERS are easily accessible. These nanostructures can be easily synthesized from only three chemicals: Ag or Au salt, reducing agent, and a detergent or directly purchased from numerous vendors.
SERS possesses several limitations that should be strongly considered in performed experiments. Specifically, (i) some fluctuations in the intensity of vibrational bands in the SERS spectra are commonly observed. Therefore, several rather than one SERS spectrum should be acquired from the sample of interest. (ii) Most colloidal NPs exhibit vibrational bands in their SERS spectra that should be subtracted or taken into consideration upon spectral analysis. SERS signal strongly depends on the Raman cross-section of the analytes, as well as the proximity of the analyte to the metallic surface. Therefore, SERS analysis of complex biological samples such as blood and semen might not reflect the presence of all molecular species present in such mixtures. For instance, heme and proteins are dominated in the SERS spectra of blood [84]. This problem can be overcome by capturing layers that make SERS nanostructures highly specific to the targeted species, including small molecules and cancer cells [85,86]. Furthermore, the Graham group showed that SERS could be used to detect and quantify DNA [87], whereas the Faulds group demonstrated that modified SERS nanostructures were capable of detecting bacterial pathogens [88]. Mabbot group pioneered the development of nucleotide-based capture layers on nanostructures that could be used for quantitative detection of viruses and other pathogens [89]. One can expect that such target-specific plasmonic nanostructures could also be used for forensic purposes.
5 Conclusions and future directions
The versatility of SERS, whether utilizing NP-coated fabric, working in aqueous solutions, employing ligand-bound NPs, or utilizing an HRS, positions it as a valuable tool for forensic laboratories analyzing a range of materials like hair, textiles, paints, soil, drugs, and bodily fluids. A complete coverage of the variety of SERS substrates and applications would be too substantial, but it should be noted that there are other forensic applications, such as explosives research, that use Au–AgNPs [50]. On that note, while SERS holds considerable promise, a significant obstacle preventing widespread acceptance is the extensive variety of substrates, methods, and procedures involved. To address this, we recommend focusing on a singular metal- or alloy-enhancing substrate, such as gold, to minimize variations in peak profiles across reported Raman spectra of the same sample. Additionally, for SERS to meet the Daubert or Frye standards for admissibility in criminal investigations, studies must meticulously explore validation parameters crucial for reliable results. Collaboration between SERS researchers and practicing forensic and clinical laboratories is essential, fostering open dialogue to address practicality, usability, and the necessity of SERS in forensic settings. This collaborative effort aims to streamline the integration of SERS into national and international forensic standards.
-
Funding information: This project was supported by Award No. 2020-90663-TX-DU, awarded by the National Institute of Justice, Office of Justice Programs, US Department of Justice.
-
Author contributions: A.P.H. conceptualized the work, wrote and edited the manuscript. D.K. acquired funding, supervised the study, edited and revised the manuscript.
-
Conflict of interest: Authors state no conflict of interest.
-
Data availability statement: Data sharing is not applicable to this article as no datasets were generated or analyzed during the current study.
References
[1] Howe J, Baylor M, Liu RH. Advancing the practice of forensic science in the united states-practitioners’ efforts. Forensic Sci Rev. 2022;34(1):7–14.Search in Google Scholar
[2] ASB. Standard for internal validation of human short tandem repeat profiling on capillary electrophoresis platforms; 2023.Search in Google Scholar
[3] Lynch KL. CLSI C62-A: a new standard for clinical mass spectrometry. Clin Chem. 2016;62(1):24–9.10.1373/clinchem.2015.238626Search in Google Scholar PubMed
[4] ASB. Standard for the analytical scope and sensitivity of forensic toxicological testing of blood in impaired driving investigations; 2021.Search in Google Scholar
[5] ASB. Standard for mass spectral analysis in forensic toxicology; 2023.Search in Google Scholar
[6] ASTM. Standard practice for training in the forensic examination of hair by microscopy; 2023.Search in Google Scholar
[7] Fleischmann M, Hendra PJ, McQuillan AJ. Raman spectra of pyridine adsorbed at a silver electrode. Chem Phys Lett. 1974;26:163–6.10.1016/0009-2614(74)85388-1Search in Google Scholar
[8] Smith E, Dent G. Modern Raman spectroscopy: a practical approach. New Jersey, US: John Wiley & Sons; 2019.10.1002/9781119440598Search in Google Scholar
[9] Raman CV. A new radiation. Indian J Phys. 1928;2:387–98.Search in Google Scholar
[10] Cardona M. Light scattering in solids. Heidelberg, Germany: Springer-Verlag; 1975.10.1007/978-3-540-37568-5Search in Google Scholar
[11] Cardona M, Guntherodt G. Light-scattering in solids 2. Basic concepts and instrumentation – Introduction. Top Appl Phys. 1982;50:1–18.10.1007/3-540-11380-0_13Search in Google Scholar
[12] Kaja S, Nag A. Ag–Au–Cu trimetallic alloy microflower: a highly sensitive SERS substrate for detection of low Raman scattering cross-section thiols. Langmuir. 2023;39(46):16562–73.10.1021/acs.langmuir.3c02528Search in Google Scholar PubMed
[13] He Y, Xiao S, Dong T, Nie P. Gold nanoparticles with different particle sizes for the quantitative determination of chlorpyrifos residues in soil by SERS. Int J Mol Sci. 2019;20(11):2817.10.3390/ijms20112817Search in Google Scholar PubMed PubMed Central
[14] Kurouski D, Van Duyne RP. In situ detection and identification of hair dyes using surface-enhanced Raman spectroscopy (SERS). Anal Chem. 2015;87(5):2901–6.10.1021/ac504405uSearch in Google Scholar PubMed
[15] Fikiet MA, Lednev IK. Raman spectroscopic method for semen identification: Azoospermia. Talanta. 2019;194:385–9.10.1016/j.talanta.2018.10.034Search in Google Scholar PubMed
[16] Sharma B, Frontiera RR, Henry AI, Ringe E, Van Duyne RP. SERS: Materials, applications, and the future. Mater Today. 2012;15(1–2):16–25.10.1016/S1369-7021(12)70017-2Search in Google Scholar
[17] Stiles PL, Dieringer JA, Shah NC, Van Duyne RP. Surface-enhanced Raman spectroscopy. Annu Rev Anal Chem (Palo Alto Calif). 2008;1:601–26. 10.1146/annurev.anchem.1.031207.112814.Search in Google Scholar PubMed
[18] Wustholz KL, Henry A-I, McMahon JM, Freeman RG, Valley N, Piotti ME, et al. Structure − activity relationships in gold nanoparticle dimers and trimers for surface-enhanced Raman spectroscopy. J Am Chem Soc. 2010;132(31):10903–10.10.1021/ja104174mSearch in Google Scholar PubMed
[19] Moskovits M. Surface roughness and the enhanced intensity of Raman scattering by molecules adsorbed on metals. J Chem Phys. 1978;69(9):4159–61.10.1063/1.437095Search in Google Scholar
[20] Haes AJ, Haynes C, McFarland AD, Schatz GC, Van Duyne RP, Zou S. Plasmonic materials for surface-enhanced sensing and spectroscopy. MRS Bull. 2005;30:368–75.10.1557/mrs2005.100Search in Google Scholar
[21] King FW, Van Duyne RP, Schatz GC. Theory of Raman scattering by molecules adsorbed on electrode surfaces. J Chem Phys. 1978;69(10):4472–81.10.1063/1.436436Search in Google Scholar
[22] Ma L, Zhang Z, Li X. Non-invasive disease diagnosis using surface-enhanced Raman spectroscopy of urine and saliva. Appl Spectrosc Rev. 2020;55(3):197–219.10.1080/05704928.2018.1562938Search in Google Scholar
[23] Juarez I, Kurouski D. Effects of crime scene contaminants on surface‐enhanced Raman analysis of hair. J Forensic Sci. 2023;68(1):113–8.10.1111/1556-4029.15165Search in Google Scholar PubMed
[24] Kurouski D, Van Duyne RP, Lednev IK. Exploring the structure and formation mechanism of amyloid fibrils by Raman spectroscopy: a review. Analyst. 2015;140(15):4967–80. 10.1039/c5an00342c.Search in Google Scholar PubMed
[25] Kleinman SL, Sharma B, Blaber MG, Henry AI, Valley N, Freeman RG, et al. Structure enhancement factor relationships in single gold nanoantennas by surface-enhanced Raman excitation spectroscopy. J Am Chem Soc. 2013;135(1):301–8. 10.1021/ja309300d.Search in Google Scholar PubMed
[26] Valley N, Greeneltch N, Van Duyne RP, Schatz GC. A look at the origin and magnitude of the chemical contribution to the enhancement mechanism of surface-enhanced Raman spectroscopy (SERS): Theory and experiment. J Phys Chem Lett. 2013;4:2599–604.10.1021/jz4012383Search in Google Scholar
[27] Zrimsek AB, Chiang NH, Mattei M, Zaleski S, McAnally MO, Chapman CT, et al. Single-molecule chemistry with surface- and tip-enhanced Raman spectroscopy. Chem Rev. 2017;117(11):7583–613. 10.1021/acs.chemrev.6b00552.Search in Google Scholar PubMed
[28] Biggins JS, Yazdi S, Ringe E. Magnesium nanoparticle plasmonics. Nano Lett. 2018;18(6):3752–8. 10.1021/acs.nanolett.8b00955.Search in Google Scholar PubMed
[29] Patil SJ, Lomonosov V, Ringe E, Kurouski D. Tip-enhanced Raman imaging of plasmon-driven coupling of 4-nitrobenzenethiol on Au-decorated magnesium nanostructures. J Phys Chem C Nanomater Interfaces. 2023;127(16):7702–6. 10.1021/acs.jpcc.3c01345. From NLM PubMed-not-MEDLINE.Search in Google Scholar PubMed PubMed Central
[30] Li Z, Kurouski D. Tip-enhanced Raman analysis of plasmonic and photocatalytic properties of copper nanomaterials. J Phys Chem Lett. 2021;12(34):8335–40. 10.1021/acs.jpclett.1c02500.Search in Google Scholar PubMed
[31] Langer J, Jimenez de Aberasturi D, Aizpurua J, Alvarez-Puebla RA, Auguié B, Baumberg JJ, et al. Present and future of surface-enhanced Raman scattering. ACS Nano. 2020;14(1):28–117. 10.1021/acsnano.9b04224. From NLM PubMed-not-MEDLINE.Search in Google Scholar PubMed PubMed Central
[32] Knight MW, King NS, Liu L, Everitt HO, Nordlander P, Halas NJ. Aluminum for plasmonics. ACS Nano. 2014;8(1):834–40. 10.1021/nn405495q.Search in Google Scholar PubMed
[33] Hulteen JC, Young MA, Van Duyne RP. Surface-enhanced hyper-Raman scattering (SEHRS) on Ag film over Nanosphere (FON) electrodes: surface symmetry of centrosymmetric adsorbates. Langmuir. 2006;22(25):10354–64. 10.1021/la0612264. From NLM Medline.Search in Google Scholar PubMed
[34] Hicks EM, Zhang X, Zou S, Lyandres O, Spears KG, Schatz GC, et al. Plasmonic properties of film over nanowell surfaces fabricated by nanosphere lithography. J Phys Chem B. 2005;109(47):22351–8. 10.1021/jp0545400. From NLM Medline.Search in Google Scholar PubMed
[35] Greeneltch N, Blaber MG, Henry AI, Schatz GC, Van Duyne RP. Immobilized nanorod assemblies: fabrication and understanding of large area surface-enhanced Raman spectroscopy substrates. Anal Chem. 2013;85(4):2297–303.10.1021/ac303269wSearch in Google Scholar PubMed
[36] McFarland AD, Young MA, Dieringer JA, Van Duyne RP. Wavelength-scanned surface-enhanced Raman excitation spectroscopy. J Phys Chem B. 2005;109(22):11279–85. 10.1021/jp050508u.Search in Google Scholar PubMed
[37] Kleinman SL, Frontiera RR, Henry AI, Dieringer JA, Van Duyne RP. Creating, characterizing, and controlling chemistry with SERS hot spots. Phys Chem Chem Phys. 2013;15(1):21–36.10.1039/C2CP42598JSearch in Google Scholar PubMed
[38] Kurouski D, Lee H, Roschangar F, Senanayake C. Surface-enhanced Raman spectroscopy: from concept to practical application. Spectroscopy. 2017;32:36–44.Search in Google Scholar
[39] Jeanmaire DL, Van Duyne RP. Surface raman spectroelectrochemistry: Part I. Heterocyclic, aromatic, and aliphatic amines adsorbed on the anodized silver electrode. J Electroanal Chem. 1977;84(1):1–20.10.1016/0368-1874(77)80399-7Search in Google Scholar
[40] Kurouski D, Large N, Chiang N, Greeneltch N, Carron KT, Seideman T, et al. Unraveling near-field and far-field relationships for 3D SERS substrates–a combined experimental and theoretical analysis. Analyst. 2016;141(5):1779–88. 10.1039/c5an01921d.Search in Google Scholar PubMed
[41] Masango SS, Hackler RA, Large N, Henry AI, McAnally MO, Schatz GC, et al. High-resolution distance dependence study of surface-enhanced Raman scattering enabled by atomic layer deposition. Nano Lett. 2016;16(7):4251–9. 10.1021/acs.nanolett.6b01276.Search in Google Scholar PubMed
[42] Ringe E, McMahon JM, Sohn K, Cobley C, Xia Y, Huang J, et al. Unraveling the effects of size, composition, and substrate on the localized surface plasmon resonance frequencies of gold and silver nanocubes: a systematic single-particle approach. J Phys Chem C. 2010;114(29):12511–6.10.1021/jp104366rSearch in Google Scholar
[43] Ivleva NP, Wagner M, Horn H, Niessner R, Haisch C. Raman microscopy and surface‐enhanced Raman scattering (SERS) for in situ analysis of biofilms. J Biophotonics. 2010;3(8–9):548–56.10.1002/jbio.201000025Search in Google Scholar PubMed
[44] Cai J, Liu R, Jia S, Feng Z, Lin L, Zheng Z, et al. SERS hotspots distribution of the highly ordered noble metal arrays on flexible substrates. Optical Mater. 2021;122:111779.10.1016/j.optmat.2021.111779Search in Google Scholar
[45] Al-thabaiti SA, Obaid AY, Khan Z, Bashir O, Hussain S. Cu nanoparticles: synthesis, crystallographic characterization, and stability. Colloid Polym Sci. 2015;293:2543–54.10.1007/s00396-015-3633-5Search in Google Scholar
[46] Andrade LM, Martins EM, Versiani AF, Reis DS, da Fonseca FG, de Souza IP, et al. The physicochemical and biological characterization of a 24-month-stored nanocomplex based on gold nanoparticles conjugated with cetuximab demonstrated long-term stability, EGFR affinity and cancer cell death due to apoptosis. Mater Sci Eng: C. 2020;107:110203.10.1016/j.msec.2019.110203Search in Google Scholar PubMed
[47] Mageswari A, Subramanian P, Ravindran V, Yesodharan S, Bagavan A, Rahuman AA, et al. Synthesis and larvicidal activity of low-temperature stable silver nanoparticles from psychrotolerant Pseudomonas mandelii. Environ Sci Pollut Res. 2015;22:5383–94.10.1007/s11356-014-3735-5Search in Google Scholar PubMed
[48] Markina NE, Ustinov SN, Zakharevich AM, Markin AV. Copper nanoparticles for SERS-based determination of some cephalosporin antibiotics in spiked human urine. Anal Chim Acta. 2020;1138:9–17.10.1016/j.aca.2020.09.016Search in Google Scholar PubMed
[49] Pandey P, Shin K, Jang A-R, Seo M-K, Hong W-K, Sohn JI. Highly sensitive multiplex-detection of surface-enhanced Raman scattering via self-assembly arrays of porous AuAg nanoparticles with built-in nanogaps. J Alloy Compd. 2021;888:161504.10.1016/j.jallcom.2021.161504Search in Google Scholar
[50] Moram SSB, Shaik AK, Byram C, Hamad S, Soma VR. Instantaneous trace detection of nitro-explosives and mixtures with nanotextured silicon decorated with Ag–Au alloy nanoparticles using the SERS technique. Anal Chim Acta. 2020;1101:157–68.10.1016/j.aca.2019.12.026Search in Google Scholar PubMed
[51] Mao K, Zhou Z, Han S, Zhou X, Hu J, Li X, et al. A novel biosensor based on Au@ Ag core-shell nanoparticles for sensitive detection of methylamphetamine with surface enhanced Raman scattering. Talanta. 2018;190:263–8.10.1016/j.talanta.2018.07.071Search in Google Scholar PubMed
[52] Alkhalayfeh MA, Aziz AA, Pakhuruddin MZ, Katubi KMM. Plasmonic effects of Au@Ag nanoparticles in buffer and active layers of polymer solar cells for efficiency enhancement. Materials. 2022;15(16):5472.10.3390/ma15165472Search in Google Scholar PubMed PubMed Central
[53] Hopper ER, Wayman TMR, Asselin J, Pinho B, Boukouvala C, Torrente-Murciano L, et al. Size control in the colloidal synthesis of plasmonic magnesium nanoparticles. J Phys Chem C Nanomater Interfaces. 2022;126(1):563–77. 10.1021/acs.jpcc.1c07544.Search in Google Scholar PubMed PubMed Central
[54] Juarez I, Kurouski D. Surface-enhanced Raman spectroscopy hair analysis after household contamination. Anal Methods. 2023;15(38):4996–5001.10.1039/D3AY01219KSearch in Google Scholar PubMed
[55] Holman A, Kurouski D. The effects of sun exposure on colorant identification of permanently and semi-permanently dyed hair. Sci Rep. 2023;13(1):2168.10.1038/s41598-023-29221-8Search in Google Scholar PubMed PubMed Central
[56] Holman AP, Kurouski D. Surface‐enhanced Raman spectroscopy enables confirmatory detection of dyes on hair submerged in hypolimnion water for up to twelve weeks. J Forensic Sci. 2023;68(6):2163–8.10.1111/1556-4029.15347Search in Google Scholar PubMed
[57] Steczkowski M, Kurouski D. Elucidation of the effect of heat exposure on hair colored by permanent and semipermanent colorants using surface‐enhanced Raman spectroscopy. J Forensic Sci. 2023;68(3):807–14.10.1111/1556-4029.15235Search in Google Scholar PubMed
[58] Higgins S, Kurouski D. Surface-enhanced Raman spectroscopy is capable of precise differentiation between re-dyed hair samples. Sci Rep. 2023;13(1):7063.10.1038/s41598-023-34398-zSearch in Google Scholar PubMed PubMed Central
[59] Higgins S, Kurouski D. Surface-enhanced Raman spectroscopy enables highly accurate identification of different brands, types and colors of hair dyes. Talanta. 2023;251:123762.10.1016/j.talanta.2022.123762Search in Google Scholar PubMed
[60] Holman AP, Kurouski D. Role of race/ethnicity, sex, and age in surface-enhanced Raman spectroscopy-and infrared spectroscopy-based analysis of artificial colorants on hair. ACS Omega. 2023;8(23):20675–83.10.1021/acsomega.3c01241Search in Google Scholar PubMed PubMed Central
[61] Nikoobakht B, El-Sayed MA. Preparation and growth mechanism of gold nanorods (NRs) using seed-mediated growth method. Chem Mater. 2003;15(10):1957–62.10.1021/cm020732lSearch in Google Scholar
[62] Goodpaster JV, Liszewski EA. Forensic analysis of dyed textile fibers. Anal Bioanal Chem. 2009;394:2009–18.10.1007/s00216-009-2885-7Search in Google Scholar PubMed
[63] Comanescu MA. Forensic analysis of fiber dyes via surface-enhanced Raman spectroscopy. City University of New York. New York, US: CUNY Academic Works; 2018.Search in Google Scholar
[64] Yao H, Dong X, Xiong H, Liu J, Zhou J, Ye Y. Functional cotton fabric-based TLC-SERS matrix for rapid and sensitive detection of mixed dyes. Spectrochim Acta Part A: Mol Biomol Spectrosc. 2022;280:121464.10.1016/j.saa.2022.121464Search in Google Scholar PubMed
[65] Puchowicz D, Giesz P, Kozanecki M, Cieślak M. Surface-enhanced Raman spectroscopy (SERS) in cotton fabrics analysis. Talanta. 2019;195:516–24.10.1016/j.talanta.2018.11.059Search in Google Scholar PubMed
[66] Liu J, Zhou J, Tang B, Zeng T, Li Y, Li J, et al. Surface enhanced Raman scattering (SERS) fabrics for trace analysis. Appl Surf Sci. 2016;386:296–302.10.1016/j.apsusc.2016.05.150Search in Google Scholar
[67] Ryland SG, Suzuki EM. Analysis of paint evidence. Forensic Chem Handb. 2012;131–224.10.1002/9781118062241.ch5Search in Google Scholar
[68] Casadio F, Leona M, Lombardi JR, Van Duyne R. Identification of organic colorants in fibers, paints, and glazes by surface enhanced Raman spectroscopy. Acc Chem Res. 2010;43(6):782–91.10.1021/ar100019qSearch in Google Scholar PubMed
[69] Shabunya-Klyachkovskaya E, Kulakovich O, Gaponenko S. Surface enhanced Raman scattering of inorganic microcrystalline art pigments for systematic cultural heritage studies. Spectrochim Acta Part A: Mol Biomol Spectrosc. 2019;222:117235.10.1016/j.saa.2019.117235Search in Google Scholar PubMed
[70] Fitzpatrick RW. Soil: forensic analysis. In: Wiley encyclopedia of forensic science; 2013. p. 1–14. 10.1002/9780470061589.fsa096.pub2.Search in Google Scholar
[71] Trevors J. One gram of soil: a microbial biochemical gene library. Antonie Van Leeuwenhoek. 2010;97:99–106.10.1007/s10482-009-9397-5Search in Google Scholar PubMed
[72] Lothridge K, Jones RW. Principles of forensic DNA for officers of the court: an interactive, computer-based training tool for attorneys and judges. Drake L Rev. 2005;54:671.Search in Google Scholar
[73] Ahmad H. Gold substrates for SERS and SERS/SERDS measurements in seawater and Raman measurements through long optical fibers. Berlin, Germany: University of Berlin; 2014.Search in Google Scholar
[74] Smith ML, Vorce SP, Holler JM, Shimomura E, Magluilo J, Jacobs AJ, et al. Modern instrumental methods in forensic toxicology. J Anal Toxicol. 2007;31(5):237–53.10.1093/jat/31.5.237Search in Google Scholar PubMed PubMed Central
[75] Akçan R, Yıldırım MŞ. Raman spectroscopy as a novel technology in forensic toxicological analyses. Curr Anal Chem. 2021;17(8):1082–96.10.2174/1573411016999200602124328Search in Google Scholar
[76] de Oliveira Penido CAF, Pacheco MTT, Lednev IK, Silveira Jr L. Raman spectroscopy in forensic analysis: identification of cocaine and other illegal drugs of abuse. J Raman Spectrosc. 2016;47(1):28–38.10.1002/jrs.4864Search in Google Scholar
[77] Ott CE, Arroyo LE. Transitioning surface‐enhanced Raman spectroscopy (SERS) into the forensic drug chemistry and toxicology laboratory: Current and future perspectives. Wiley Interdiscip Reviews: Forensic Sci. 2023;5(4):e1483.10.1002/wfs2.1483Search in Google Scholar
[78] Smith M, Logan M, Bazley M, Blanchfield J, Stokes R, Blanco A, et al. A Semi‐quantitative method for the detection of fentanyl using surface‐enhanced Raman scattering (SERS) with a handheld Raman instrument. J Forensic Sci. 2021;66(2):505–19.10.1111/1556-4029.14610Search in Google Scholar PubMed
[79] Gozdzialski L, Rowley A, Borden SA, Saatchi A, Gill CG, Wallace B, et al. Rapid and accurate etizolam detection using surface-enhanced Raman spectroscopy for community drug checking. Int J Drug Policy. 2022;102:103611.10.1016/j.drugpo.2022.103611Search in Google Scholar PubMed
[80] Segawa H, Fukuoka T, Itoh T, Imai Y, Iwata YT, Yamamuro T, et al. Rapid detection of synthetic cannabinoids in herbal highs using surface-enhanced Raman scattering produced by gold nanoparticle co-aggregation in a wet system. Analyst. 2019;144(23):6928–35.10.1039/C9AN01512DSearch in Google Scholar
[81] Karn-orachai K, Ngamaroonchote A. A label-free and selective SERS-based sensor for determination of ampicillin contamination in water using a fabric gold–silver alloy substrate with a handheld Raman spectrometer. N J Chem. 2023;47(6):2758–70.10.1039/D2NJ05346BSearch in Google Scholar
[82] Shaine M, Premasiri W, Ingraham H, Andino R, Lemler P, Brodeur A, et al. Surface enhanced Raman scattering for robust, sensitive detection and confirmatory identification of dried bloodstains. Analyst. 2020;145(18):6097–110.10.1039/D0AN01132KSearch in Google Scholar PubMed
[83] Wang W, Dong R-l, Gu D, He J-a, Yi P, Kong S-K, et al. Antibody-free rapid diagnosis of malaria in whole blood with surface-enhanced Raman spectroscopy using nanostructured gold substrate. Adv Med Sci. 2020;65(1):86–92.10.1016/j.advms.2019.11.004Search in Google Scholar PubMed
[84] Reese T, Suarez C, Premasiri WR, Shaine ML, Ingraham H, Brodeur AN, et al. Surface enhanced Raman scattering specificity for detection and identification of dried bloodstains. Forensic Sci Int. 2021;328:111000. 10.1016/j.forsciint.2021.111000. From NLM Medline.Search in Google Scholar PubMed
[85] Sharma B, Bugga P, Madison LR, Henry AI, Blaber MG, Greeneltch NG, et al. Bisboronic acids for selective, physiologically relevant direct glucose sensing with surface-enhanced Raman spectroscopy. J Am Chem Soc. 2016;138(42):13952–9. 10.1021/jacs.6b07331. From NLM PubMed-not-MEDLINE.Search in Google Scholar PubMed
[86] Henry AI, Sharma B, Cardinal MF, Kurouski D, Van Duyne RP. Surface-enhanced Raman spectroscopy biosensing: in vivo diagnostics and multimodal imaging. Anal Chem. 2016;88(13):6638–47. 10.1021/acs.analchem.6b01597.Search in Google Scholar PubMed
[87] Faulds K, McKenzie F, Smith WE, Graham D. Quantitative simultaneous multianalyte detection of DNA by dual-wavelength surface-enhanced resonance Raman scattering. Angew Chem Int Ed Engl. 2007;46(11):1829–31. 10.1002/anie.200604265. From NLM Medline.Search in Google Scholar PubMed
[88] Gracie K, Correa E, Mabbott S, Dougan JA, Graham D, Goodacre R, et al. Simultaneous detection and quantification of three bacterial meningitis pathogens by SERS. Chem Sci. 2014;5:1030–40.10.1039/C3SC52875HSearch in Google Scholar
[89] San Juan AM, Jaitpal S, Ng KW, Martinez C, Tripathy S, Phillips, C, et al. Freeze-driven synthesis of DNA hairpin-conjugated gold nanoparticle biosensors for dual-mode detection. ACS Appl Bio Mater. 2024;7(5):3005–13. 10.1021/acsabm.4c00069. From NLM Medline.Search in Google Scholar PubMed PubMed Central
© 2024 the author(s), published by De Gruyter
This work is licensed under the Creative Commons Attribution 4.0 International License.
Articles in the same Issue
- Research Articles
- Microfabricated potentiometric sensor based on a carbon nanotube transducer layer for selective Bosentan determination
- A novel Six Sigma approach and eco-friendly RP-HPLC technique for determination of pimavanserin and its degraded products: Application of Box–Behnken design
- Enantiomeric separation of four pairs of alkaloids by using a C18 column tandem polysaccharide-based chiral column
- Sustainable HPLC technique for measurement of antidiabetic drugs: Appraisal of green and white metrics, content uniformity, and in vitro dissolution
- Quantitative analysis of mixed lipid nanostructures in rat skin by HPLC-MS
- Review Articles
- Recent advance in electrochemical immunosensors for lung cancer biomarkers sensing
- Latest trends in honey contaminant analysis, challenges, and opportunities for green chemistry development
- Quantitative methods in the analysis of clozapine in human matrices – A scoping review
- Review of potentiometric determination of cationic surfactants
- Surface-enhanced Raman spectroscopy in forensic analysis
- Special Issue: Greener Analytical Methods - Part II
- Greenness of dispersive microextraction using molecularly imprinted polymers
- KPI-based standards benchmarking for the preference of different analytical approaches developed for simultaneous determination of ciprofloxacin and hydrocortisone: A SWOT case study