Transcriptome analysis of tertiary lymphoid structures (TLSs)-related genes reveals prognostic value and immunotherapeutic potential in cancer
-
Wenbo Du
 and
Huamei Li
and
Huamei Li

Abstract
Objectives
Tertiary lymphoid structures (TLSs) are increasingly recognized as pivotal formations in antitumor immunity, with many mature TLSs relating to favorable prognosis in a variety of cancers. Analysis of the transcriptome data provided an opportunity to investigate the relationship between TLSs and the clinical outcomes of patients.
Methods
We performed transcriptome analysis to examine the expression patterns of 79 TLS-related genes within 32 cancers from The Cancer Genome Atlas, correlating these patterns to the clinical outcomes of patients. To improve the analysis, we developed a novel prognostic signature (TLSig) and validated its robust performance via multiple independent cancer cohorts.
Results
Our results demonstrated that the expression of TLS-related genes exhibited significant heterogeneity across cancers; and that TLSig was significantly associated with patient prognosis within most cancer types. Specifically, TLSig expressed potential prediction of whether patients would benefit from immunotherapy and presented significant interactions with epithelial to mesenchymal transition (EMT) and the cell cycle. Moreover, a difference in the distribution of TLSs between tumor and nontumor tissues was observed, which was validated in hepatocellular carcinoma (HCC) samples. We further investigated the potential mechanism for the difference in the distribution of TLSs between tumor and nontumor tissues of HCC, and observed the connection between TLSs and human leucocyte antigen (HLA).
Conclusions
In summary, our results demonstrated the prognostic value of TLSs in predicting patient prognosis and provided new insights into the molecular mechanism of TLSs in cancer.
Introduction
In recent decades, researchers have revealed information regarding cellular and molecular determinants linked to cancer progression and metastasis [1, 2]. Although the possibility of detecting some cancers at an early stage holds promise for favorable clinical outcomes before the disease spreads, it is clearly not sufficient, and the accuracy of predicting the clinical prognosis of cancer patients remains a major challenge. In general, significant variations among different tumor types with regard to initiation, progression, and metastasis are existent. As a result, constructing a comprehensive predictive system that describes cancer prognosis from the perspective of focusing on the nature of the tumor is a challenging task. However, the immune microenvironment of different tumor types shares some commonalities and plays a crucial role in tumor development. Immune cells may serve as the link between the tumor parenchyma and the immune microenvironment. Tertiary lymphoid structures (TLSs) are immune cell aggregates that form in nonlymphoid tissues [3, 4], which are critical in the antitumor immune response and are closely related to tumor occurrence and metastasis. A growing amount of evidence indicates that the density of TLSs is associated with longer overall survival (OS) and disease-free survival (DFS) in several solid tumors. Additionally, TLSs in tumor tissues play an essential role in antitumor immune responses and are strongly associated with the prognosis of immunotherapy [5], [6], [7]. Considering these attributes, TLS-related genes may serve to distinguish between tumor genotype and phenotype by establishing a prognostic signature.
In tumors, alterations in the expression and function of human leucocyte antigen (HLA)-I molecules are frequently identified, which provide a mechanism for tumor cells to evade immune surveillance [8]. In some malignancies, these abnormalities are significantly associated with higher tumor stage, higher grade, disease progression and reduction of patient survival, as well as failure of CD8+ T-cell-based immunotherapy [9], [10], [11]. Moreover, tumor cells express nonclassical HLA-I molecules in the tumor microenvironment as one of the strategies to evade the effect of cytotoxic activity from the immune system, and overexpression of HLA-G and HLA-E is commonly observed in a variety of malignancies [8]. Based on the similarity between TLSs and HLA in terms of tumor immunity as well as prognosis, the potential relationship between them remains to be further explored.
For the present study, we took a global view of the mRNA expression levels of TLS-related genes to assess their comprehensive relevance to tumor microenvironment (TME) heterogeneity and clinical prognosis at the pan-cancer level. Considering the close association of TLSs with tumor prognosis and immunotherapy, we developed a novel prognostic signature, TLSig, using TLS-related genes and demonstrated its predictive capacity for pan-cancer prognosis. In addition, on the basis of the analysis results of TLSig, we further validated the distribution differences of TLSs and explored the relationship between TLSs and HLA in hepatocellular carcinoma (HCC) samples. Our findings indicated the potential connection between TLSs, the TME, and the prognosis of pan-cancer.
Materials and methods
Data source and preprocessing
This study utilized data from The Cancer Genome Atlas Project (TCGA), which included transcriptome expression data from 32 tumors (n=10,942) and corresponding clinical information (except for acute myeloid leukemia (LAML)). Additionally, we collected the METABRIC cohort from Bioportal, which included expression profiles and clinical information from 1,904 breast invasive carcinoma (BRCA) patients [12], as well as data from Chin et al. for 112 breast cancer patients [13]. Furthermore, we obtained data from the GEO database for breast cancers GSE20685 [14] and GSE21653 [15], as well as GSE8894 [16], GSE31210 [17], and GSE30219 [18] in the lung adenocarcinoma (LUAD) dataset, GSE19188 [19] in the lung squamous cell carcinoma (LUSC) dataset, and GSE41613 [20] data from the oral squamous cell carcinoma (OSCC) dataset. Lastly, we obtained data from the “IMvigor210” cohort [21], GSE91061 cohort [22] and GSE135222 cohort [23] for cancer immunotherapy. See Table S2.
Calculation of enrichment score
To analyze the enrichment score (ES), we performed a gene set variation analysis using the “GSVA” software package (version 1.40.1; Universitat Pompeu Fabra; Barcelona, Catalonia, Spain) [24], where the list of TLSs, EMT and cell cycle-related genes is provided in Table S1.
Construction of prognostic TLS-related signature
LASSO algorithm is a linear regression method aimed at feature selection and model sparsification. We utilized LASSO model to find relatively linearly independent sets of genes to construct our prognostic signature. We divided the TCGA dataset into training and testing sets in a 5:5 ratio, and used the LASSO algorithm to process the training set data for TLS-related genes to ensure the simplicity of the model and reduce the risk of overfitting.
Then, we used a multivariate Cox proportional hazards regression model to link the expression of each gene in the TLS-related signature and the OS of patients in the training set. As shown in the following formula:
where 35 represents the number of TLS-related signature genes, Expr (g i ) represents the normalized expression value of gene i, and coef (g i ) represents the corresponding coefficient estimated by the multiple Cox regression model (see Table S3). Patients were divided into high- and low-risk stratifications using the optimal cutoff inferred by the surv_cutpoint function in the “survminer” package (version 0.4.9; Datanovia; Montpellier, France) [25].
Functional enrichment analysis
The biological processes associated with differentially expressed genes (DEGs) in the high- and low-risk groups were investigated. The bitr function from “clusterProfiler” R package (version 4.0.5; Jinan University; Guangzhou, China) [26] was applied to convert gene symbols. Significant enrichment was defined as gene ontology (GO) terms with adjusted p-values less than 0.01.
Pathological sections of HCC
A total of 41 pathological sections from patients with HCC were collected in this study, and were obtained from Nanjing Drum Tower Hospital, Nanjing, China (Ethical approval number: 2021-566-02). The section of each sample contained the tumor region as well as the peritumoral region. All patients had pathologically confirmed HCC and underwent curative resection.
Immunofluorescence
Immunofluorescence (IF) staining was performed on pathological sections of 41 HCC samples. Primary antibodies were divided into two groups: CD3, CD20, CD21, and CD23 for TLS; HLA-ABC, HLA-DR+DP+DQ, HLA-E, and HLA-G for HLA (see Table S4). HLA-ABC represents the classical HLA-I molecule; HLA-DR+DP+DQ represents the HLA-II molecule; HLA-E and HLA-G represent non-classical HLA-I molecules. Staining protocols were based on the antibody manufacturer’s protocol. Slides were scanned and imaged by the Vectra3.0 System (version 3.0.5; PerkinElmer; Hopkinton, MA, USA).
Quantification of TLSs and calculation of TLS density
TLSs were detected by the combination of different marker signals on the whole slide images (WSIs), as described previously [27]. The surface areas of the different regions were measured using ImageJ software (version 1.0; National Institutes of Health; Bethesda, MD, USA) [28], and the density of TLSs was calculated as the number of TLSs per square mm2 in the peritumor and intratumor regions.
Calculation of HLA positive rate
Five areas were randomly selected in peritumoral or tumoral regions of each WSI, which were imaged as multispectral HPFs (200×). To calculate the positive rate of HLA in different regions for each sample, the cell segmentation algorithm of Inform software (version 2.6.0; Akoya Biosciences; Marlborough, MA, USA) was trained to identify cells expressing HLA-ABC, HLA-D, HLA-E and HLA-G. The number of HLA positive cells and the total number of cells were calculated for each HPF image. The number of HLA-positive cells and the total number of cells were summed for the five HPF images in the peritumoral or tumoral region, and the ratio of the two represents the positivity rate of the corresponding HLA molecule in the peritumoral or tumoral region.
Statistical analysis
Pearson and Wilcoxon rank tests were utilized to measure the similarity or difference. Additionally, the survival probabilities of patients were assessed using Kaplan–Meier analysis, and the log-rank test was used to determine any differences between the groups. A nomogram was created and validated by combining multiple predictive indicators to present the results of the multivariable Cox regression analysis in a clear and understandable way. ns: not significant; * p≤0.05; ** p≤0.01; *** p≤0.001. All statistical analyses were conducted using R software (version 4.2.2; R Foundation for Statistical Computing, Vienna, Austria).
Results
Heterogeneity and prognostic value of TLSs across cancers
Based on previous studies in TLS, 79 TLS-related genes [3], [4], [5, 29], [30], [31], [32], [33], [34], [35], [36], [37] were collected and incorporated into our study, which were composed of chemokine genes and immune cell genes. They are mainly associated with the neogenesis of TLSs and the function of immune cells in TLSs. These TLS-related genes were analyzed in a total of 10,942 samples collected from 32 tumors in the TCGA database (Figure 1A; Table S1), and the results indicated that the distribution of TLSs exhibited significant heterogeneity among different cancer types (Figure 1B). Moreover, the TLS enrichment score (ES) was calculated for the 32 tumors, revealing significant differences among different cancer types (Figure 1C; see Materials and Methods). Some tumors, such as lymphoid, diffuse large B-cell lymphoma (DLBC), LUSC, and kidney renal clear-cell carcinoma (KIRC), presented high ESs, hinting toward a frequent presence of TLS, while other tumors, such as glioblastoma multiforme (GBM) and uveal melanoma (UVM), exhibited low ESs, which was consistent with the characteristics of immune privilege (Figure 1C). Further analysis showed that the high-ES group had a longer OS than the low-ES group in pan-cancer (p≤0.0001, t-test) (Figure 1D).

Heterogeneous expression pattern of TLSs in 32 cancers that are strongly associated with prognosis. (A) Circle plot shows an overview of samples from 32 cancers collected from the TCGA database, with LAML excluded. The outer circle represents the total number of samples for each cancer, while the inner circle displays the number of tumor samples. (B) The t-SNE plot shows the projection of pan-cancer samples based on TLS-related genes (Table S1). Each dot represents one sample, with cancer types marked by color codes. (C) Violin plot shows the distribution of TLS enrichment scores among pan-cancer, ordered by the median scores. (D) Boxplot shows the distribution of OS between the high- and low-ES groups, as determined by the median scores of pan-cancer. The p-value was obtained by t-test.
Developing a TLS-related signature for pan-cancer clinical prognosis
To obtain a reliable and effective TLS-related signature for predicting the prognosis of pan-cancer, we conducted LASSO regression analysis (Figure S1A and B), and only 35 genes remained effective. We first investigated the expression landscape of these 35 genes in pan-cancer and found significant differences among tumors, indicating the heterogeneity of expression patterns, which was consistent with our previous results (Figure 1B and 2A). To investigate the expression effects on prognosis, univariate Cox regression model based on training pan-cancer cohorts was conducted, demonstrating that all 35 genes were significantly associated with the prognosis (Figure 2B; p≤0.0001, log-rank test) and the per-cancer Cox analyses are shown in Figure S2. Based on these selected TLS-related genes, we constructed a prognostic signature for pan-cancer, namely TLSig. As expected, in the training cohort and testing cohort, TLSig conveniently stratified patients into high- and low-risk groups with significantly different OS (p≤0.0001, log-rank test) utilizing the optimal cutoff point, indicating a worse prognosis in the high-risk group (Figure 2C and D).
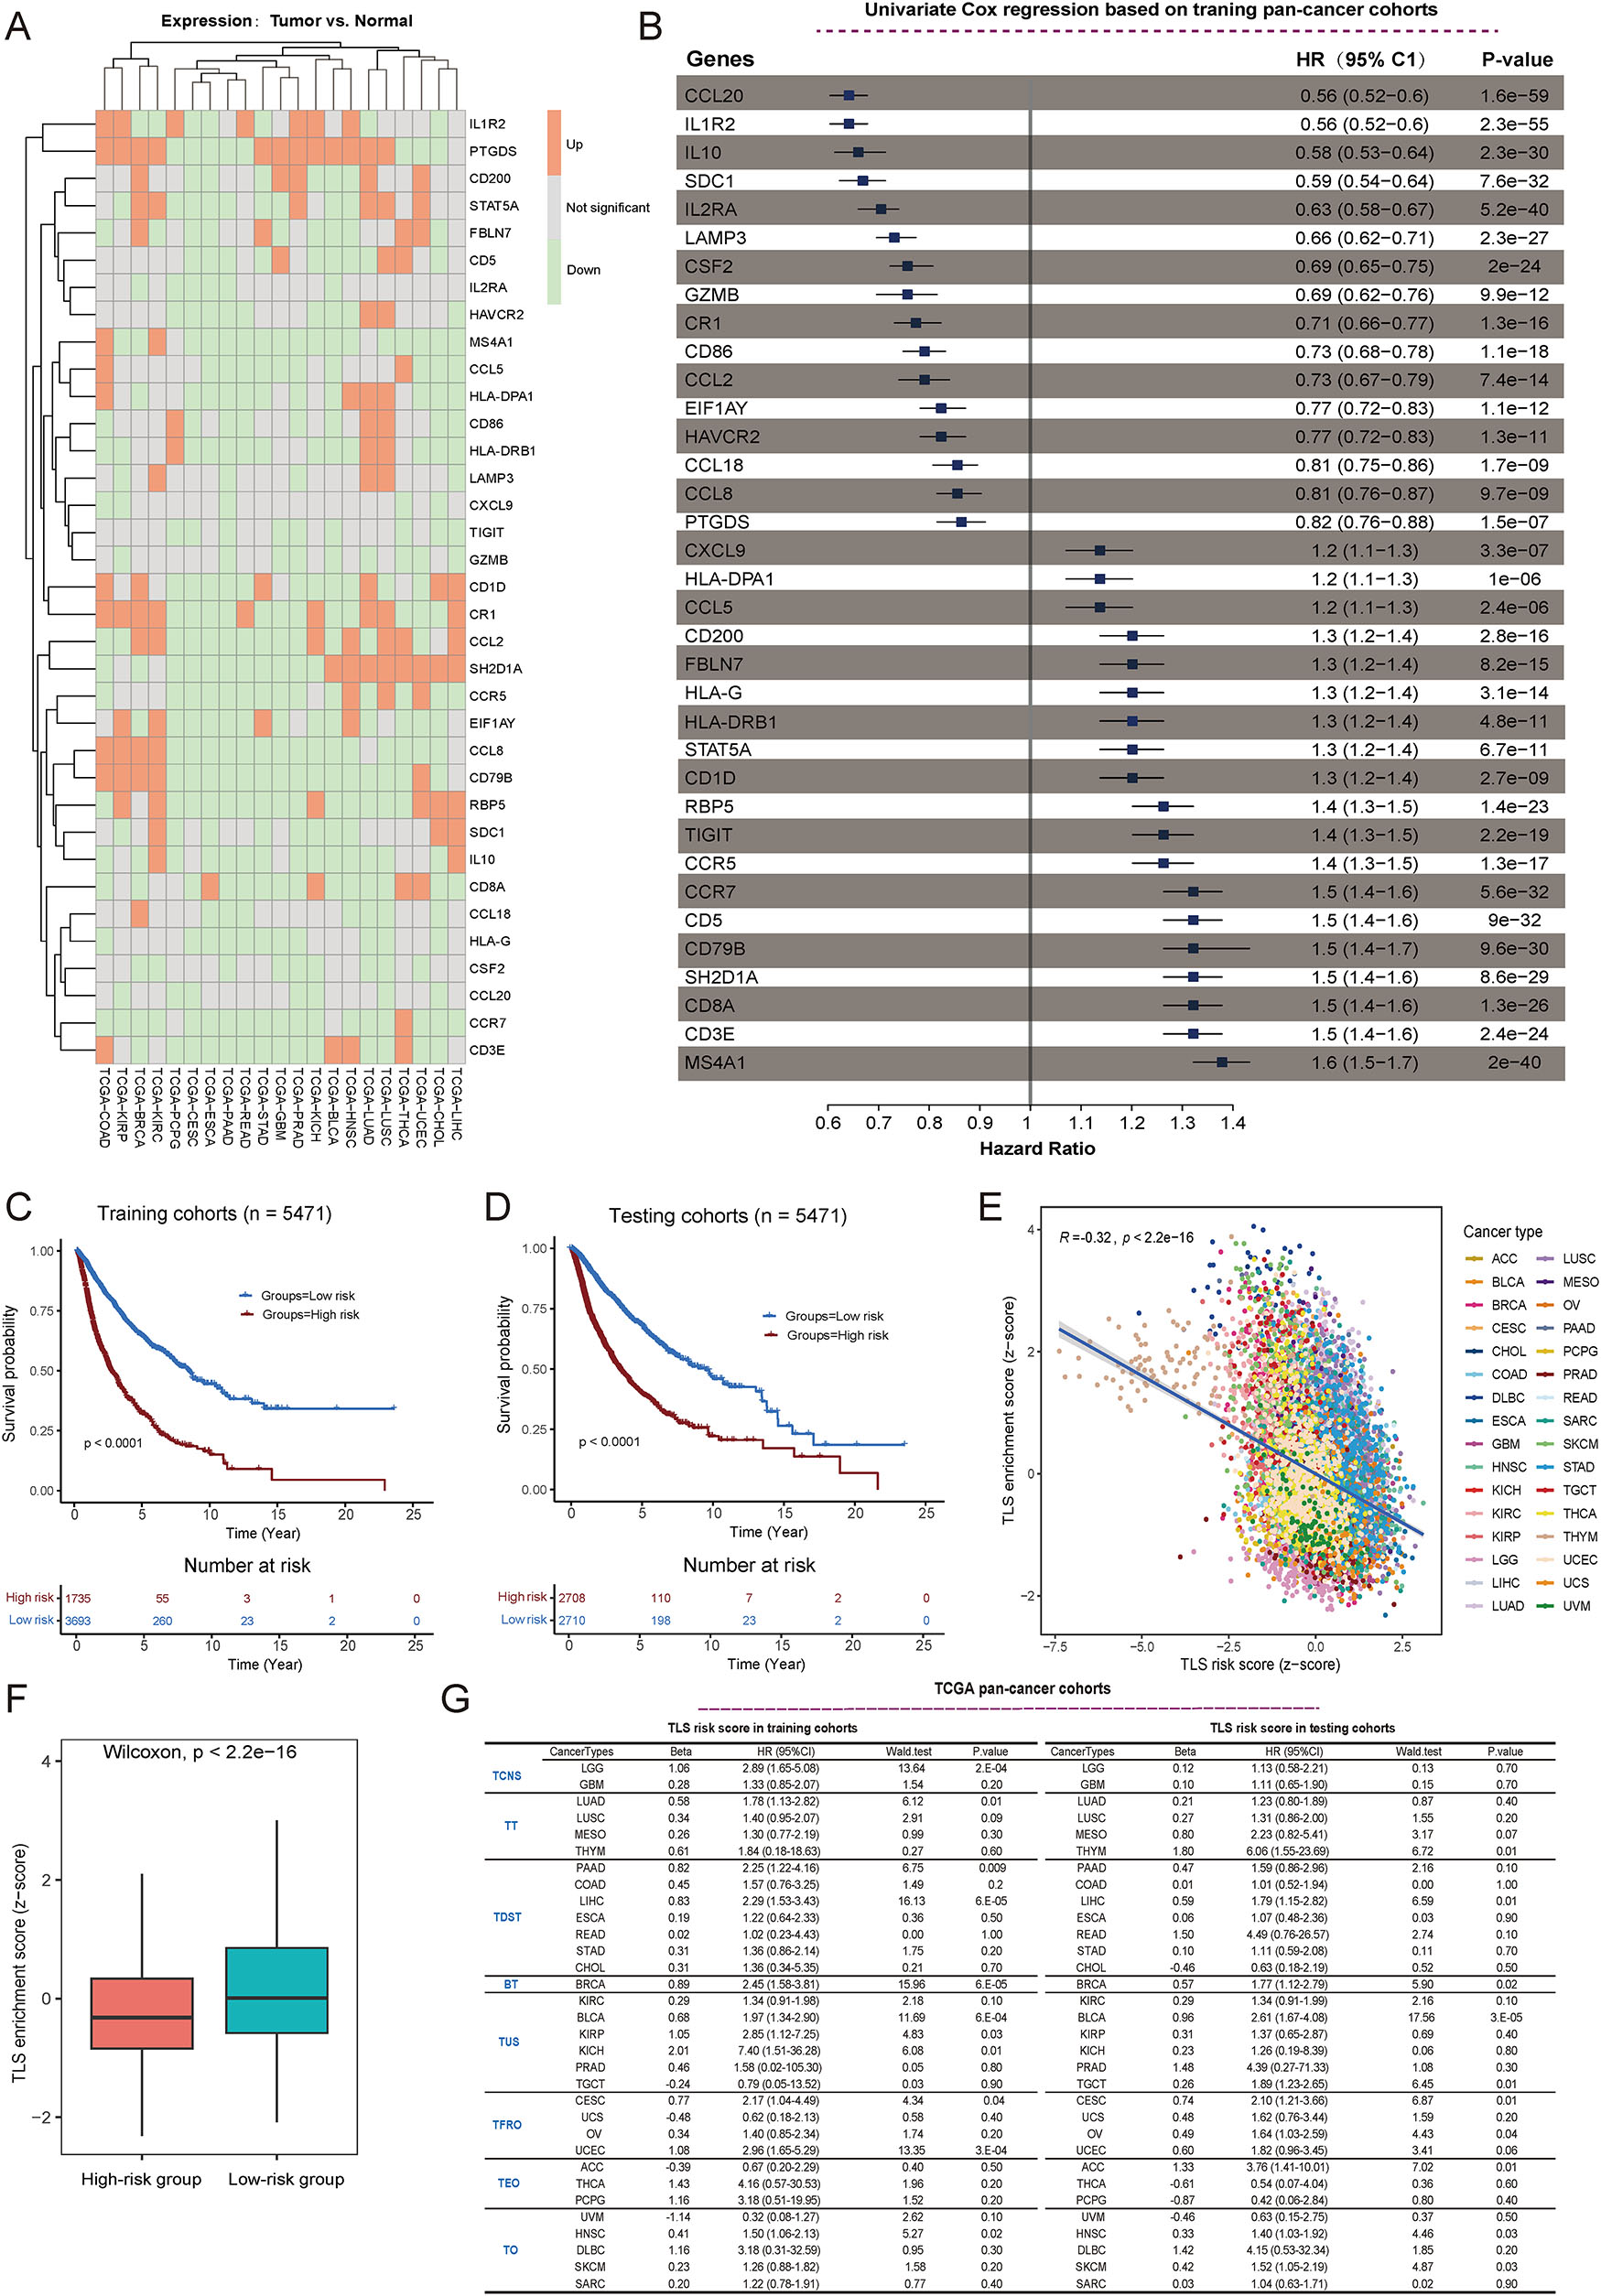
Construction of a TLS-related signature for pan-cancer. (A) Heatmap shows the expression levels of 35 selected TLS genes in a wide range of tumors, where cancers without normal samples were excluded from consideration. Red indicates significantly upregulated expression in tumors compared to normal samples, while green indicates significantly downregulated expression. Gray indicates no significant difference in expression. (B) Univariate Cox regression analysis for 35 selected TLS genes based on the pan-cancer training cohort. (C and D) TCGA cohorts were divided into high and low-risk groups based on the optimal cutoff point for the TLS score. The difference in patient survival between the different risk groups in the training (C) and testing (D) sets was assessed separately, with p-values calculated using a Cox proportional hazards model. (E) Scatter plot showing the association between TLS enrichment scores (ES) and risk scores in pan-cancer. “R” indicates the Pearson correlation coefficient, and p-value was obtained by t-test. (F) Boxplot showing the distribution of enrichment scores between the high- and low-risk groups depicted by TLS risk scores. The p-value was obtained by the Wilcoxon rank test. (G) In TCGA, 32 cancer types were divided into eight groups, and then the impact of the TLSig on the prognosis of individual cancer patients was investigated in the training and testing sets of the pan-cancer cohort. TCNS, Tumors of Central Nervous System; TT, Thoracic Tumors; TDST, Tumors of Digestive System; BT, Breast Tumor; TUS, Tumors of Urinary System and Male Genital Organs; TFRO, Tumors of Female Reproductive Organs; TEO, Tumors of Endocrine Organs; TO, Tumors of others.
Next, a negative relationship was observed between the TLS risk score and the TLS enrichment score. This suggested that low-risk groups had better prognoses and higher TLS enrichment scores, which aligns with previous findings (Figures 1D, 2E and F). The impact of TLSig on prognosis of each cancer type was also examined in both the training and testing groups, and the results indicated that the TLS risk score was mostly associated with poor prognosis across various cancer types (Figures S3 and S4). Specifically, it was found to be significant for LUSC, KIRC, HNSC, liver hepatocellular carcinoma (LIHC), and BRCA (Figure 2G and Figures S3 and S4). Notably, there was no significant impact on the prognosis of GBM, testicular germ cell tumor (TGCT), or UVM, suggesting that TLSs face difficulty in generating an independent microenvironment in immune-privilege cancers.
Evaluation of TLSig’s prognostic performance in independent publicly available cancer cohorts
To assess the prognostic performance of TLSig, multiple independent cancer cohorts were analyzed, which presented similar trends. Specifically, validation results from four external breast cancer cohorts indicated that TLSig was significantly linked to patient prognosis, which was consistent with the results from the TCGA cohort. This suggests that TLSig is a reliable predictor of prognosis for breast cancer patients (Figure 3A–D; Table S2). Furthermore, external datasets for lung adenocarcinoma (LUAD), LUSC, and OSCC were also analyzed, and the results were as expected, except for the GSE31210 cohort (LUAD). In the GSE31210 cohort, no significant difference was observed, although presented with the same trend (Figure 3E–I).
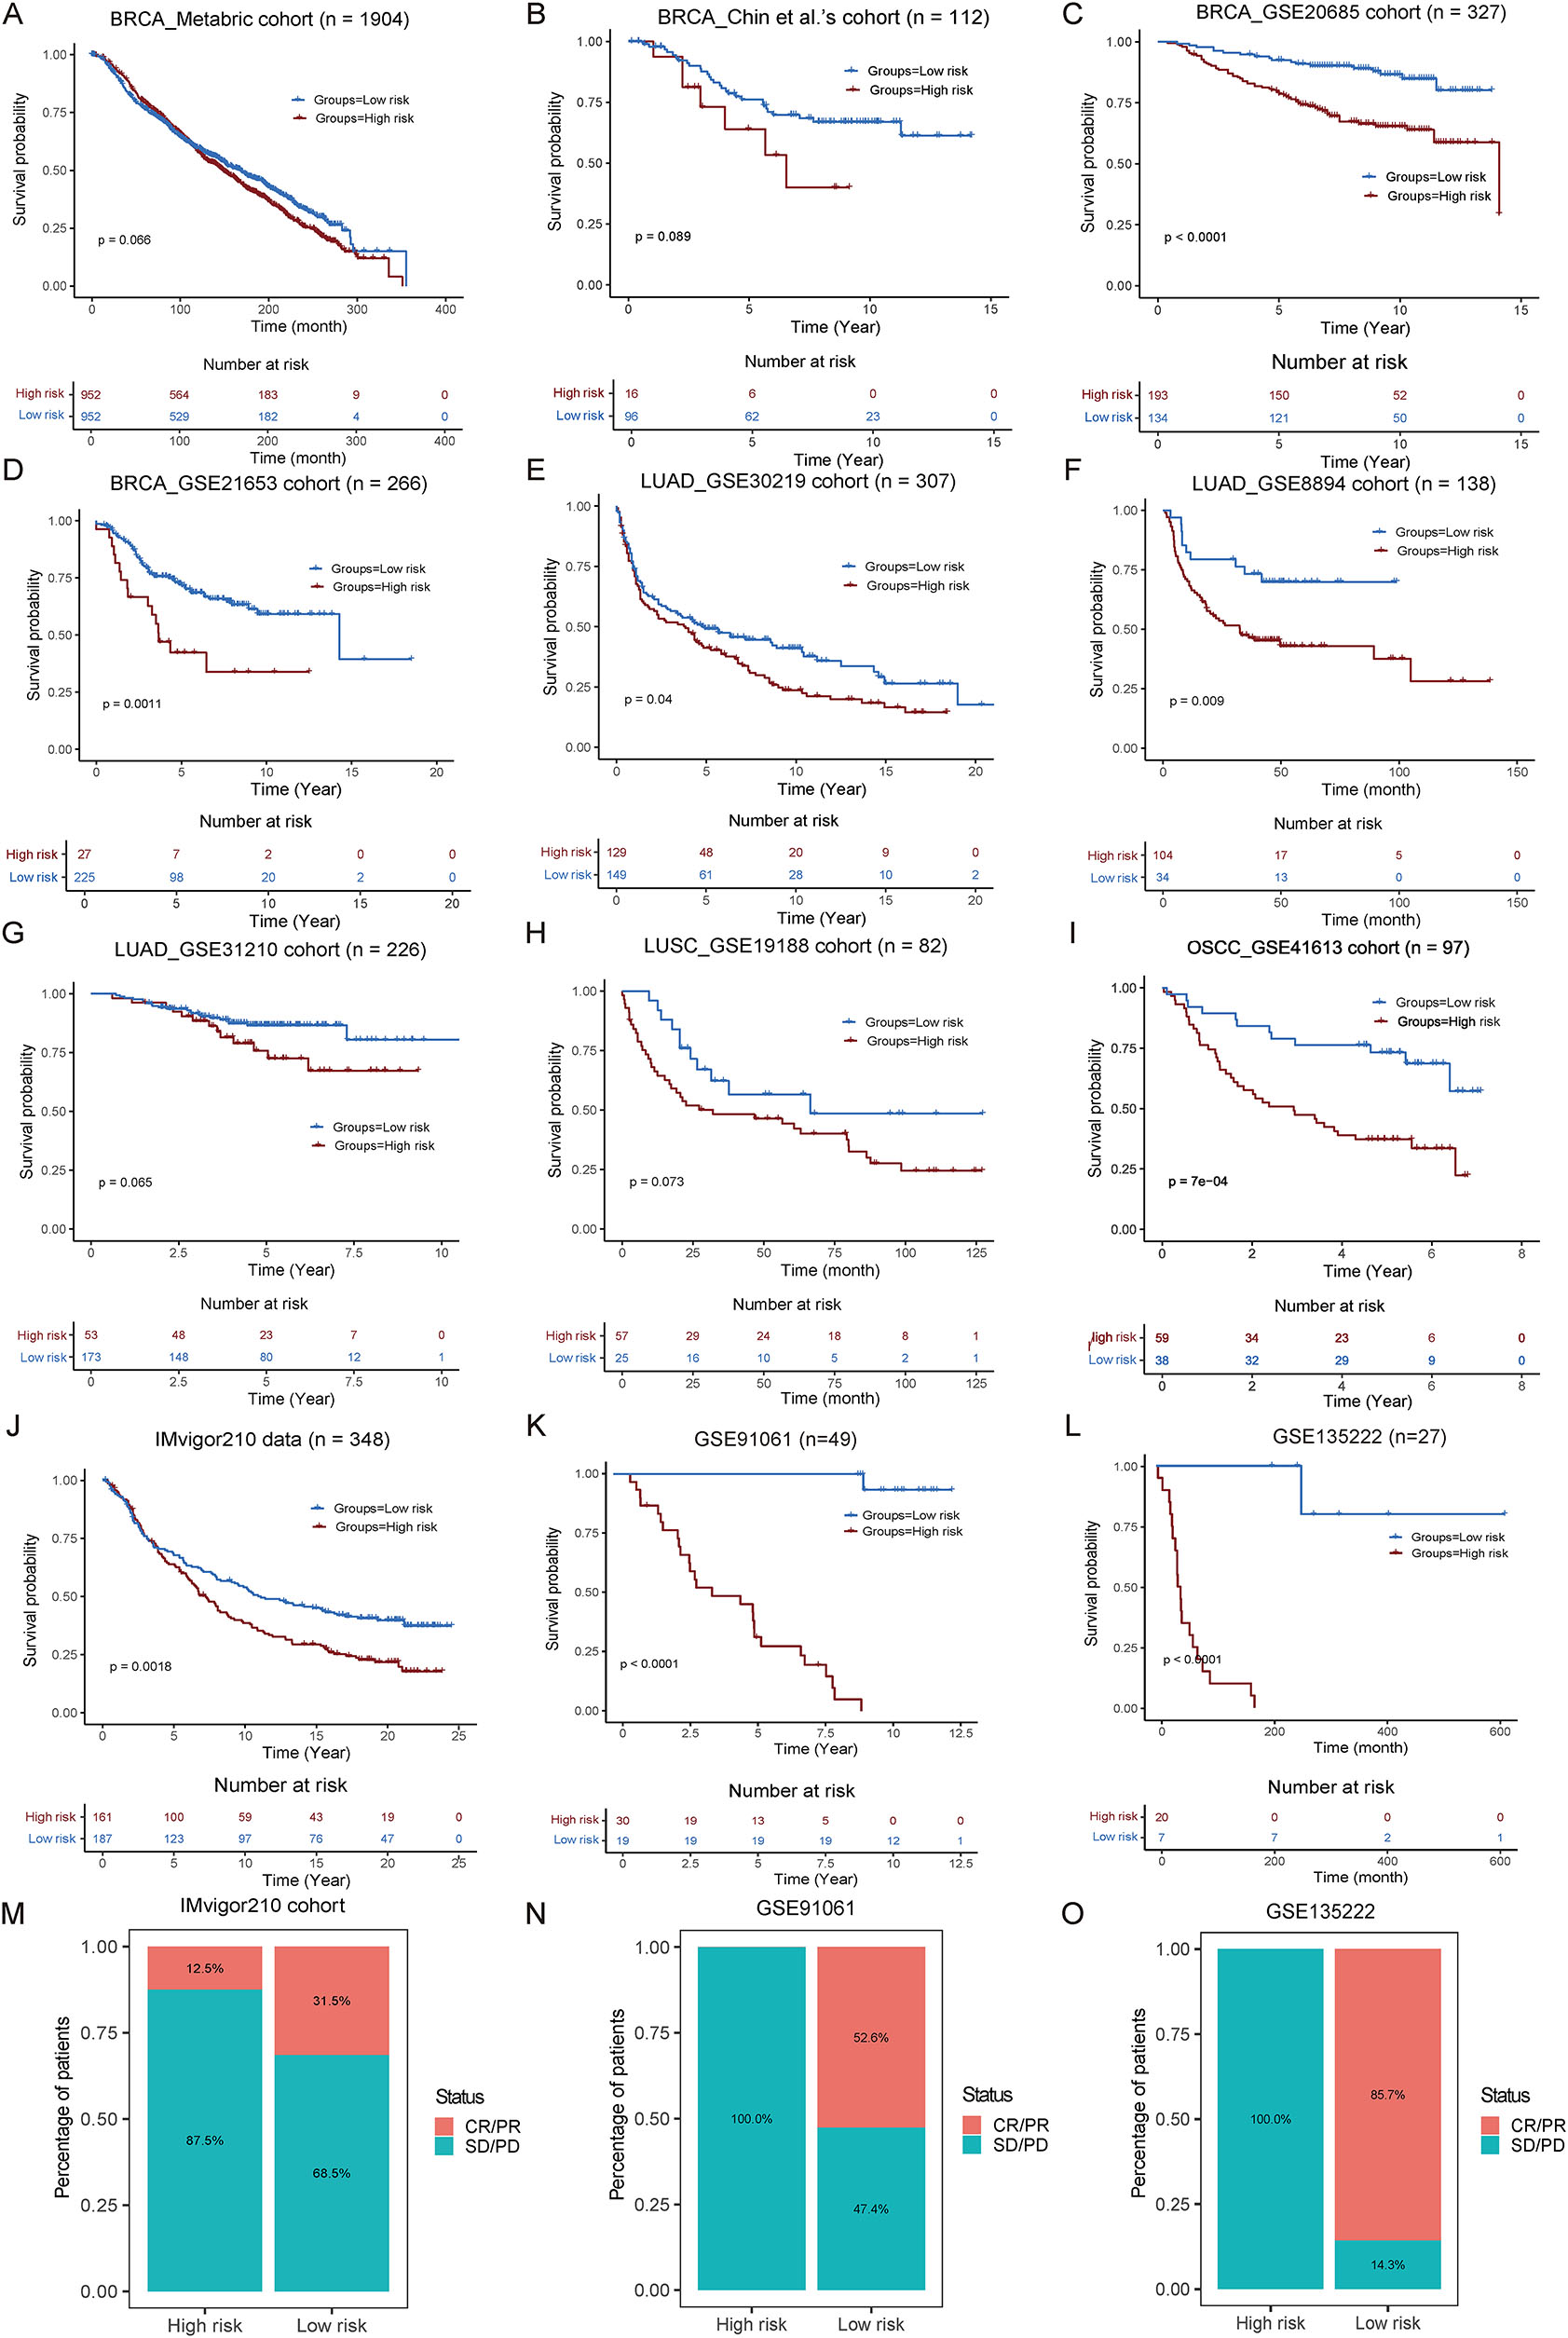
Validate the performance of TLSig on other independent publicly available cohorts. (A–L) KM curves show the differences in prognosis between the high and low risk groups as portrayed by the TLS risk scores in 12 independent cohorts. The p-values were evaluated by the log-rank test. (M–O) Stack bar plot shows the comparisons of the disease treatment effect between the high-risk and low-risk groups in the cohorts for immunotherapy. Red indicates complete or partial remission of the disease (CR/PR), while blue indicates disease stability or progression (SD/PD).
Given the widespread interest in the role of TLSs in immunotherapy [5], [6], [7], the predictive value of TLSig was tested in the IMvigor210 cohort, GSE91061 cohort and GSE135222 cohort. As expected, there was a potentially better prognosis in the low-risk group, as demonstrated by the KM curve (Figure 3J–L; Table S2). Additionally, the distribution of CR/PR and SD/PD in both groups revealed that a higher percentage of the low-risk group (IMvigor210 cohort: 31.5 vs. 12.5 %; GSE91061 cohort: 52.6 vs. 0 % and GSE135222 cohort: 85.7 vs. 0 %) benefited from immunotherapy (Figure 3M–O). Overall, these results suggest that TLSig has the potential for clinical application in predicting prognosis for pan-cancer and its immune response.
Construction of a prognostic nomogram model based on the TLS risk score for pan-cancer
To provide an intuitive and quantifiable approach to facilitate the clinical prediction of patient survival probabilities, we developed a comprehensive nomogram prediction model that integrates various clinicopathological characteristics, including TLS risk scores, patient age, and cancer type, as shown in Figure 4A. To validate the accuracy of the nomogram, we plotted the calibration curve for 3-year DFS (disease-free survival) and compared it with the standard curve. The results indicated that the prediction of survival probability was closely related to the actual survival (Figure 4B). To further evaluate the effectiveness of our model, we calculated the AUC of TLSig and nomogram prediction in both the training and testing cohorts. As shown in Figure 4C and D, the AUC of the nomogram prediction was higher than that of the TLS risk score alone in both cohorts (training set: 0.710 vs. 0.698, testing set: 0.730 vs. 0.699). This suggested that the predictive efficiency of the nomogram would be improved if clinicopathological factors were included.
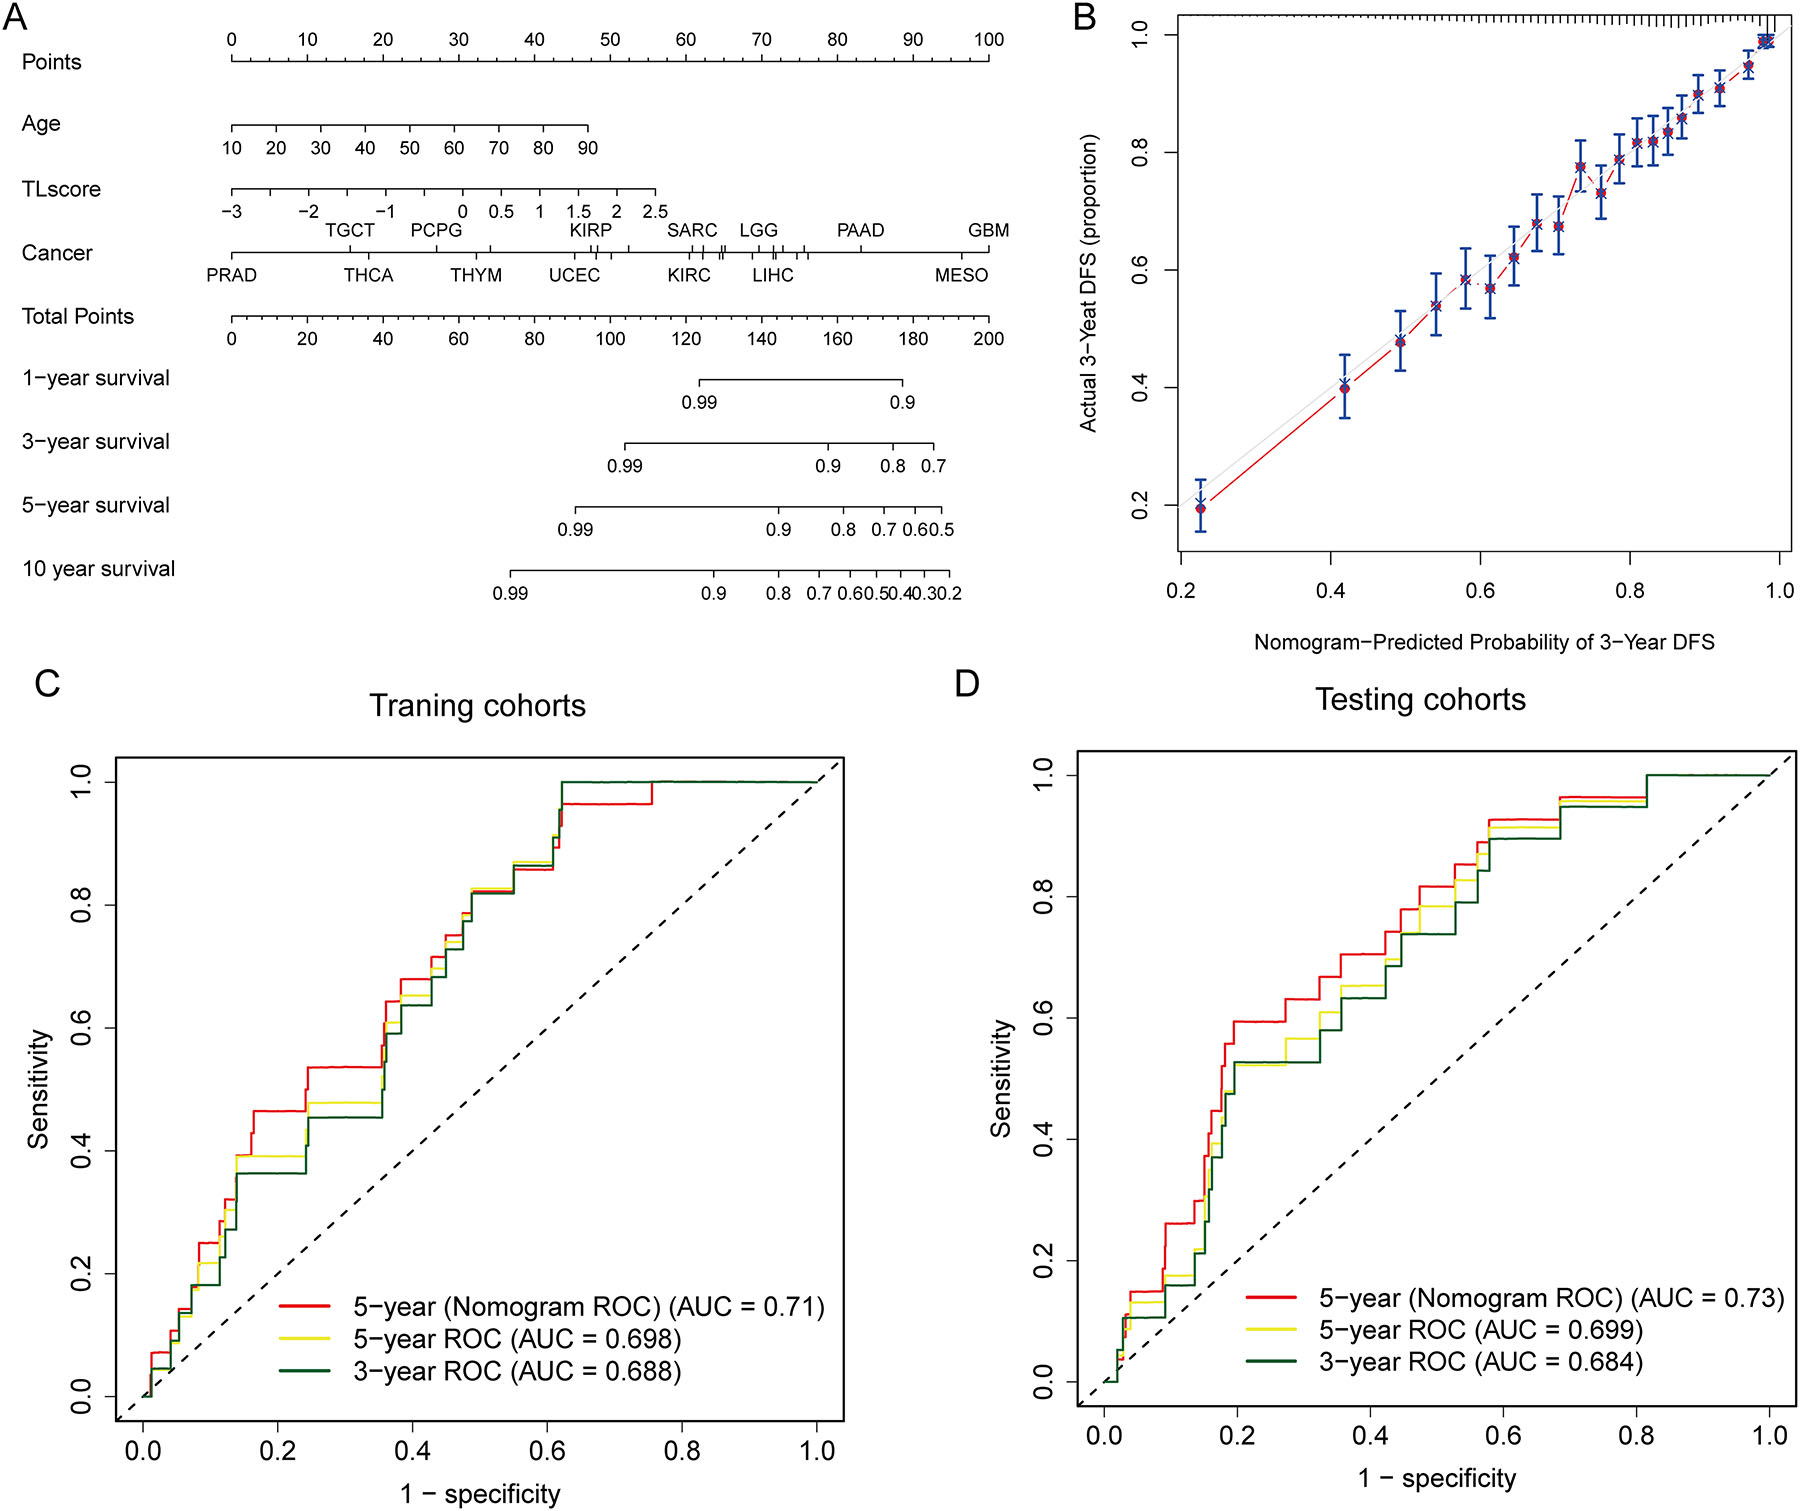
Predictive efficiency of the TLS risk score and nomogram in pan-cancer. (A and B) The nomogram shows the performance of a multivariate Cox regression analysis by combining multiple predictors, including TLS risk score, age, and cancer type. (B) The correlation between predicted and actual values is revealed by a calibration curve that demonstrates the concordance between the nomogram-predicted probability of 3-year DFS and the actual 3-year DFS. (C and D) ROC curves show the clinical benefits of the TLS risk score at 3, and 5 years in TCGA training (C) and TCGA testing (D) cohorts and the clinical benefits of the nomogram at 5 years in TCGA training (C) and TCGA testing (D) cohorts.
Association of TLSig with biological processes of cancers
To investigate the relationship between TLSig and tumor malignant characteristics, we carried out a comprehensive analysis of the correlation between TLS risk scores, epithelial to mesenchymal transition (EMT), and the cell cycle. Our analysis revealed that there were statistically significant positive correlations between the TLS risk score and EMT (R=0.21, p<0.0001) as well as the cell cycle (R=0.28, p<0.0001) in the entire TCGA pan-cancer cohort (Figure 5A and B). Furthermore, we examined individual tumors and discovered extremely significant positive correlations between TLS risk scores and EMT, or the cell cycle, in LIHC and breast cancer (BRCA) (Figure 5C). The higher the abundance of TLSs in LIHC and BRCA suggests that there is a more active immune response compared to other cancers. In summary, our findings indicate that tumors with a higher TLS risk score (i.e., a lower abundance of TLSs) exhibit more active cell proliferation and aggressive tumor cells within the microenvironment.
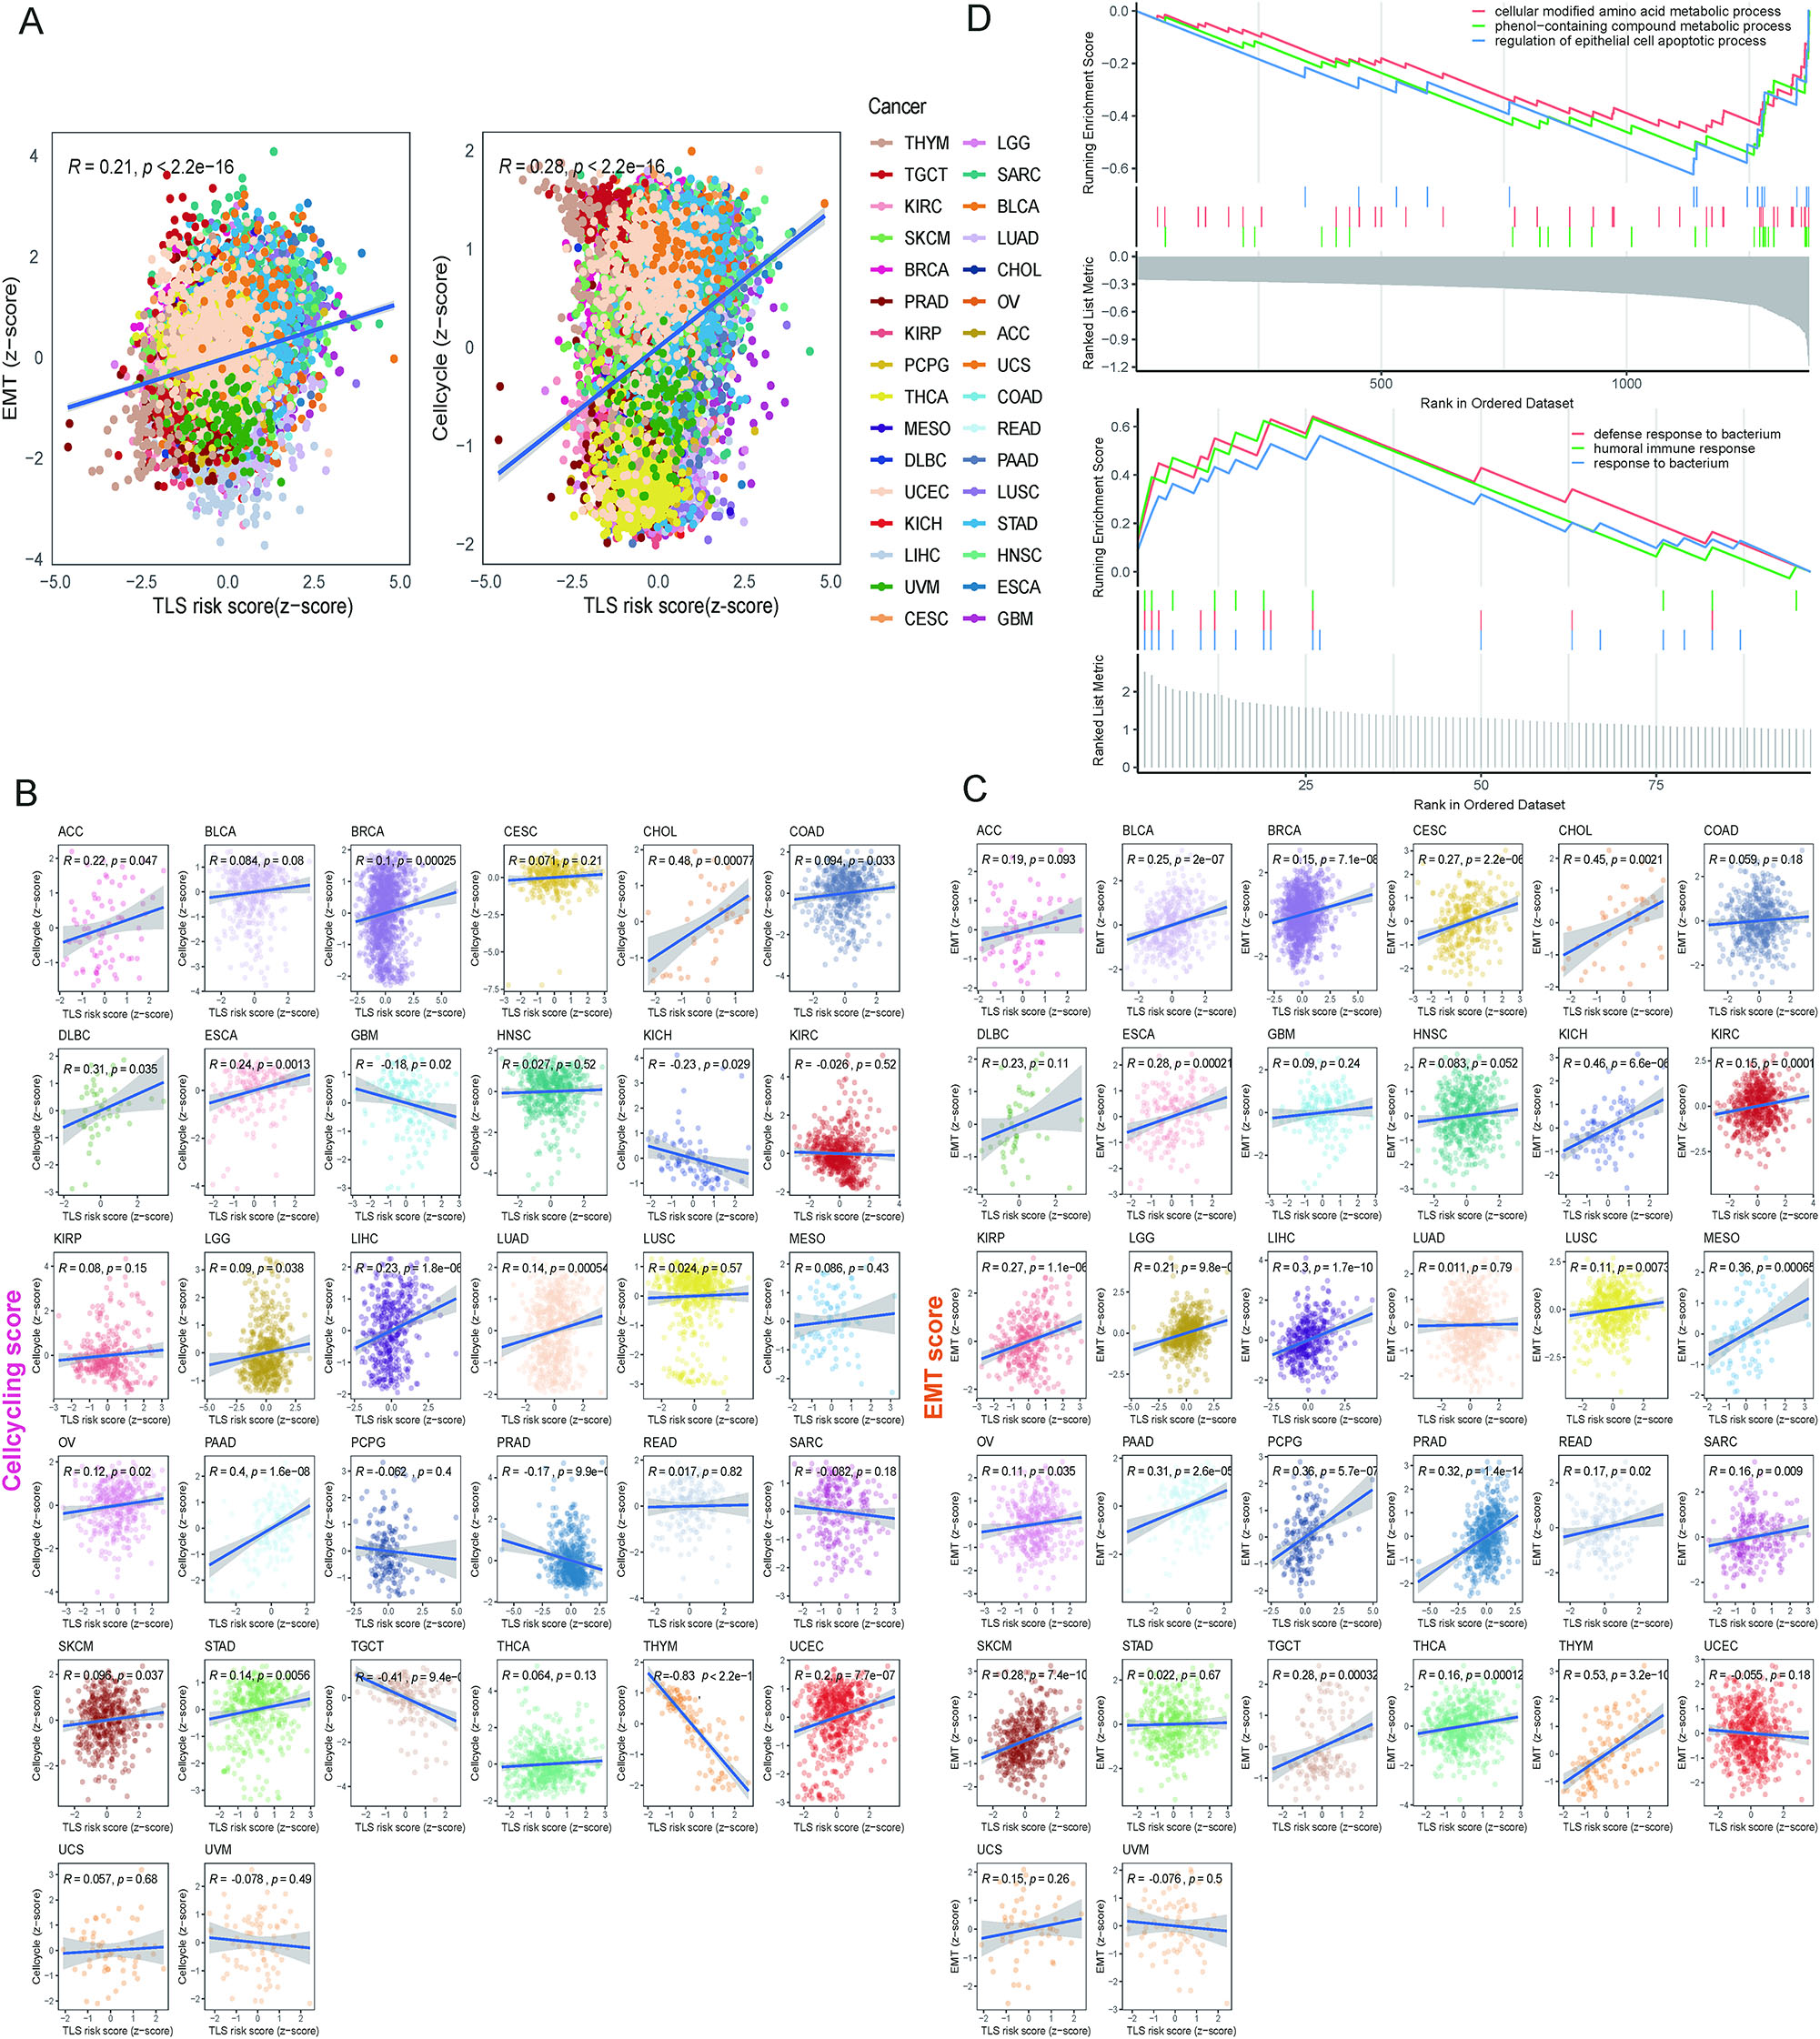
Associations between TLS risk scores and biological processes of cancers. (A) Two plots show the correlation between the cell-cycling enrichment score and EMT enrichment score with the TLS risk score for the total sample of 32 cancer types. R represents the correlation coefficient, and p-value was determined by t-test. (B and C) Scatter plots show the correlations between the cell-cycling score (B) and EMT score (C) with the TLS risk score for each cancer type in the TCGA dataset, except for LAML. (D) GSEA shows the top three enriched GO terms in the high-risk (upper panel) and low-risk (lower panel) groups.
In addition, we identified DEGs in the high and low risk groups. The GO analysis revealed that high-risk DEGs were mainly abundant in cellular modified amino acid and phenol-containing compound metabolic processes, while low-risk DEGs were more associated with humoral immune response and defense response to bacterium (Figure 5D).
Differential distribution of TLSs in tumor and nontumor tissues of HCC
Further calculation of TLS risk scores for different types of tumor samples compared with nontumor samples revealed that there were significant differences between the different types of tumors. We also observed that tumor samples from LIHC presented higher TLS risk scores than nontumor samples, implying the presence of fewer TLSs in tumor samples (Figure 6A).
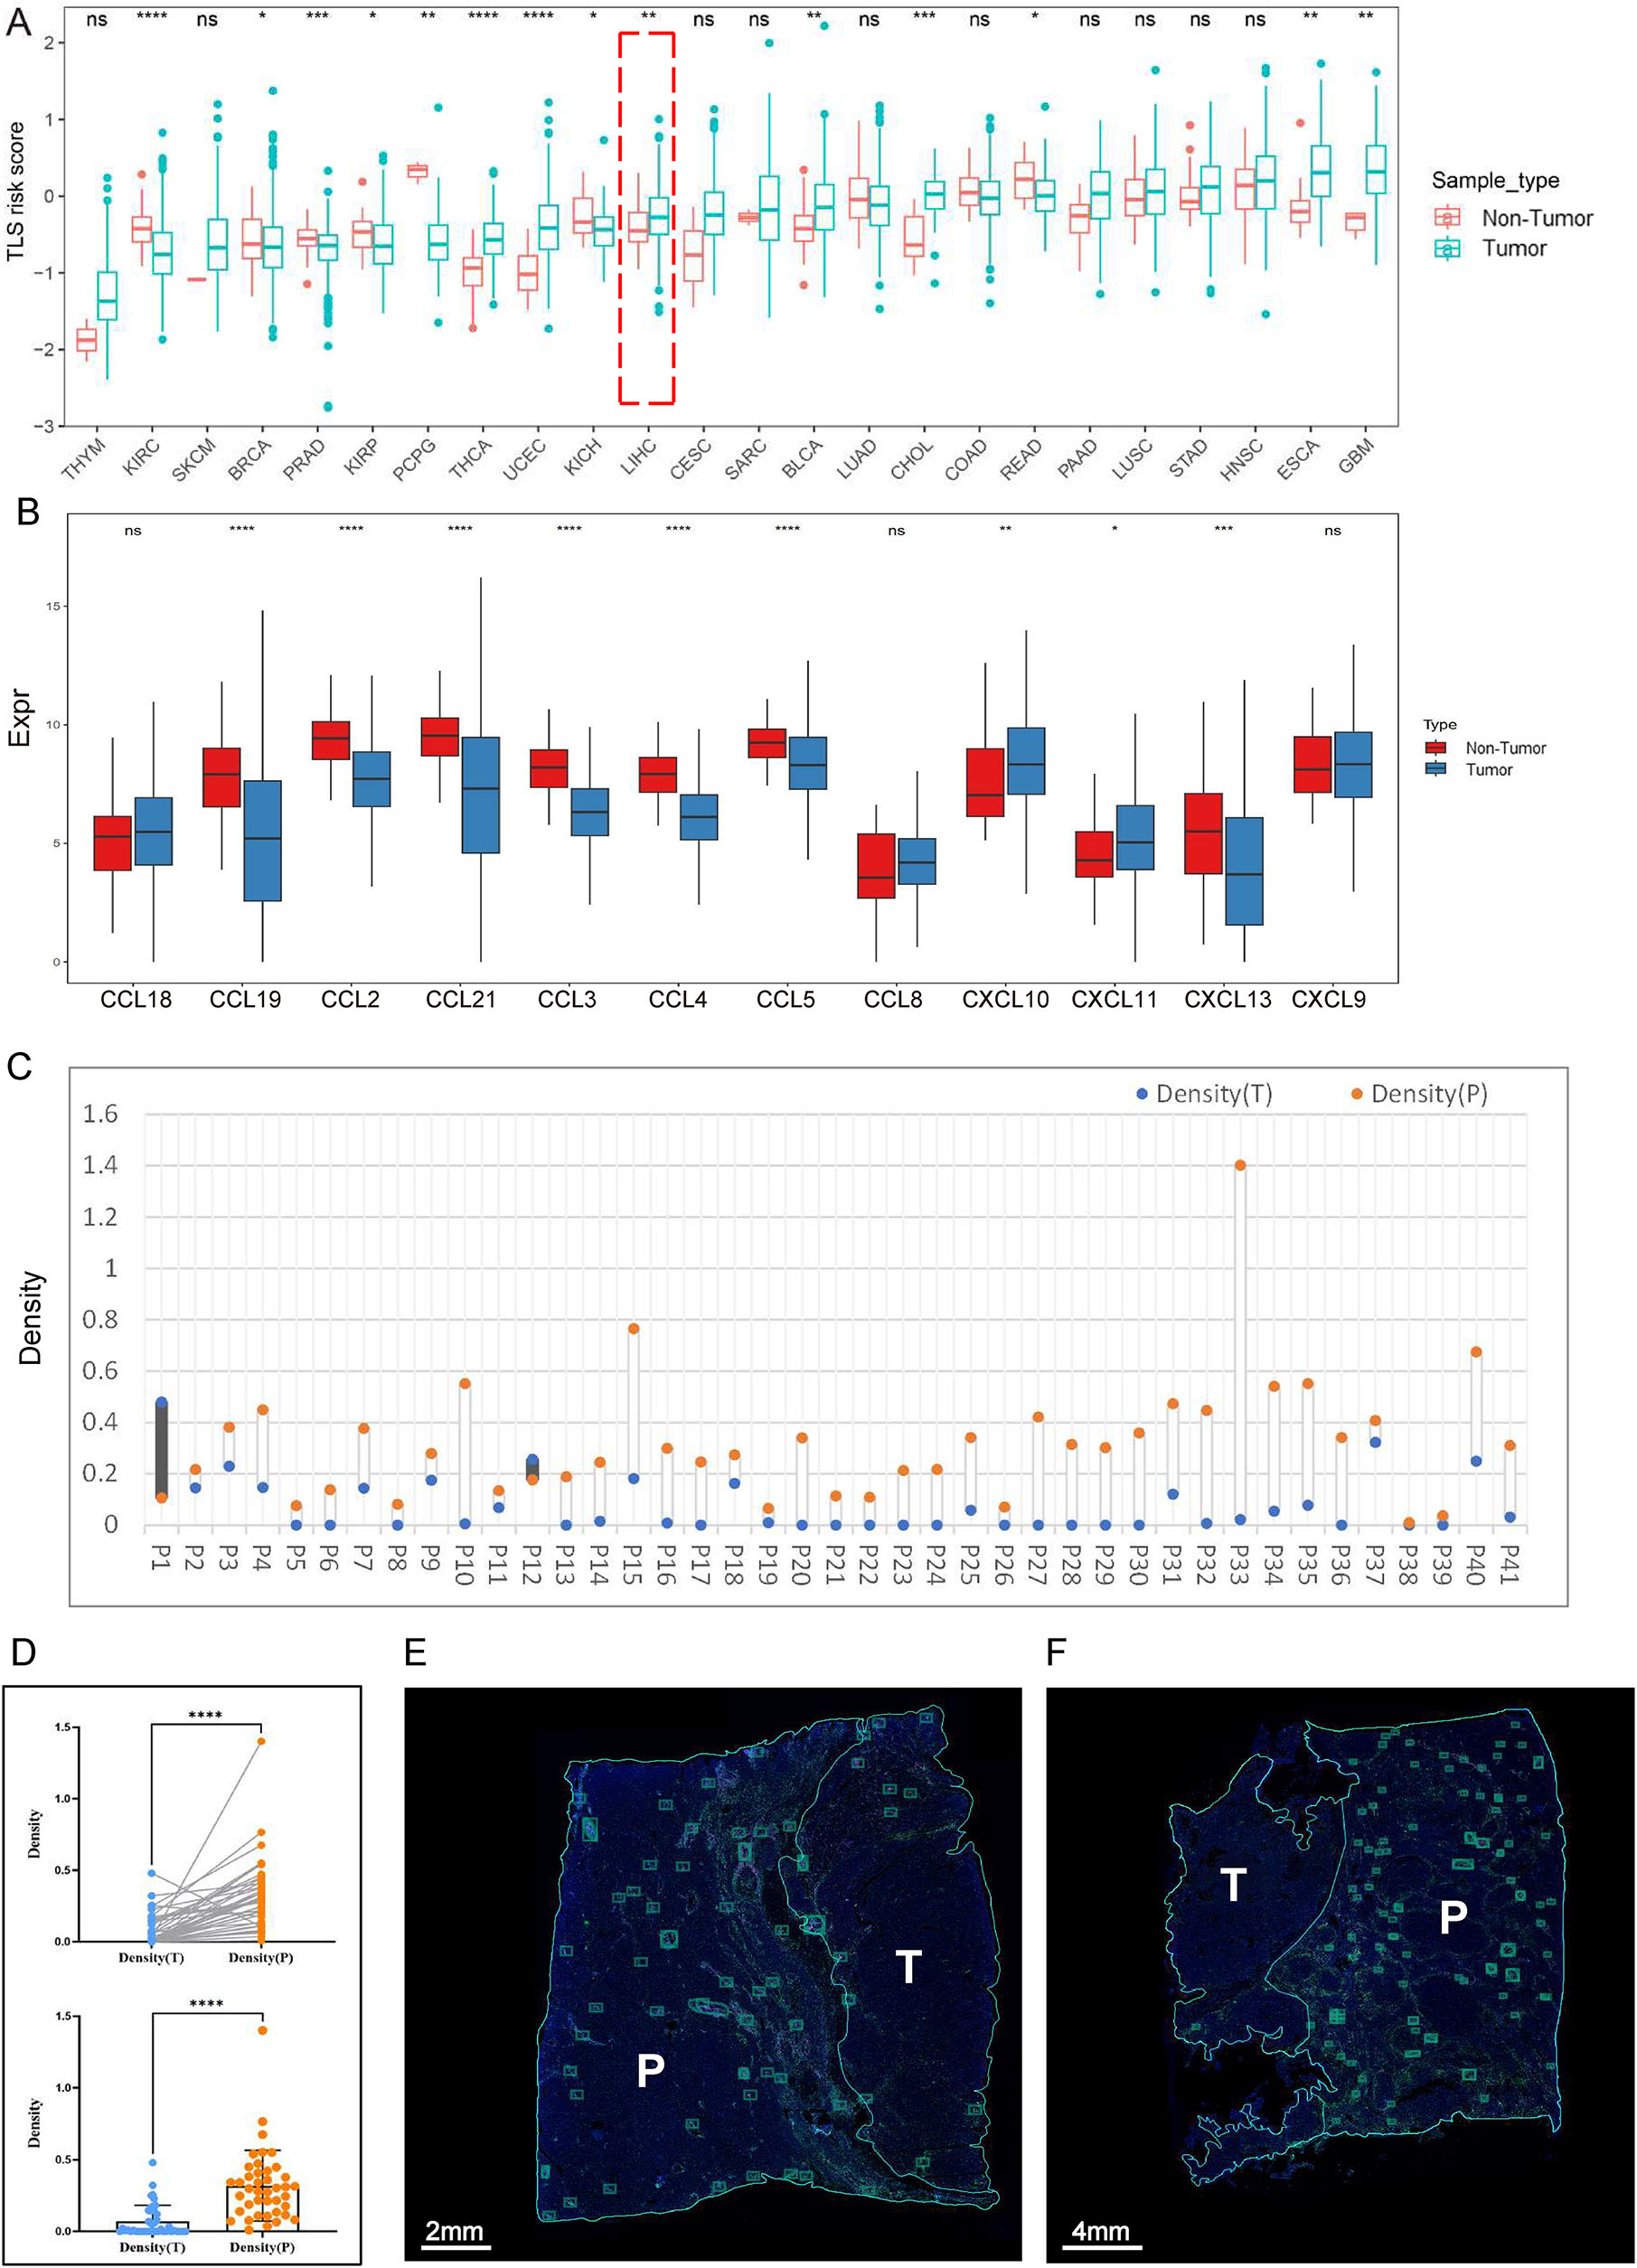
The heterogeneous distribution of TLSs in tumor and nontumor tissues of HCC. (A) Comparison of the differences in TLS risk scores between tumor and nontumor samples across cancers. (B) Differences in the expression of 12 genes between tumor and nontumor samples of LIHC. (C and D) Statistical analysis of TLS density in HCC sections. Blue dots indicate the density of TLSs in the tumor tissues, and orange dots indicate the density of TLSs in the peritumoral regions. (E and F) Representative images of HCC that present TLSs in the tumoral and peritumoral regions by immunofluorescence staining. Each boxed area represents one TLS.
To validate the results of the analysis of LIHC, we first utilized the 12-Chemokine signature [38] to analyze tumor and nontumor samples of LIHC in TCGA dataset. Our results demonstrated that the expression level of 12 genes in tumor samples of LIHC was lower overall than that in nontumor samples, which was in line with the results of the previous analysis using the TLS risk score and suggested that the TLS risk score could accurately reflect the expression of TLSs (Figure 6B).
Subsequently, immunofluorescence (IF) staining (CD3, CD20, CD21, CD23 on the same sections for TLSs) was conducted on 41 pathological sections of HCC samples (Figure S5A), and the statistical results showed that the density of TLSs was higher in the peritumoral region (nontumor tissue) than in tumor tissue in 39 samples (Figure 6C–F), which was consistent with the results of the previous analysis. Together, these findings indicate that TLSs are less susceptible to form in tumor tissues compared to nontumor tissues of HCC.
HCC may affect the formation of TLSs by regulating HLA expression
To investigate the potential factors for the difference in TLS distribution, we further analyzed the differential expression of HLA. Multiplex immunostaining (HLA-ABC, HLA-D, HLA-E, HLA-G) was performed on 41 identical pathological sections of HCC samples (Figure 7A and Figure S5B). Statistical analysis revealed that tumor tissues presented higher expression of HLA-E and HLA-G compared to peritumoral regions (nontumor tissues), and HLA-ABC and HLA-D were downregulated in tumor tissues, without differences in the coexpression of HLA-E and HLA-G between them (Figure 7B–F).

Differences in the expression of HLA between tumor and nontumor tissues of HCC. (A) Flow chart of HLA expression analysis. (B–F) Paired statistical analysis of HLA expression in HCC sections. Blue dots indicate the positive rate of HLA in the tumor tissues, and orange dots indicate the positive rate of HLA in the peritumoral regions. (G) Bubble plot of TLS density and HLA expression data. (H) Representative images of HCC showing the expression of different HLA and TLS densities in the tumoral and peritumoral regions.
The TLS density and HLA positive rate for each sample are summarized in Figure 7G. After comparing the TLS density with the expression of each HLA molecule in tumor tissues and peritumoral regions for each sample, we found that the trend of TLS density in paired tumor and nontumor tissues tended to be the same as the trend of HLA-ABC expression, and the opposite trend of HLA-E and HLA-G (i.e., when the TLS density in tumor tissues was lower than that in nontumor tissues, its corresponding HLA-ABC expression in tumor tissues was lower than that in nontumor tissues, and HLA-E and/or HLA-G expression were higher than that in nontumor tissues), and the results of the chi-square test were statistically significant (Figure 7H).
In summary, we speculated that HCC might inhibit the formation of TLSs and evade immune surveillance by downregulating HLA-ABC and upregulating HLA-E and/or HLA-G.
Discussion
Accurately predicting the prognosis of cancer patients through biomarker screenings remains a challenge. However, increasing evidence indicates that TLSs play a crucial role in both tumor prognosis and antitumor immunity [3, 4, 39, 40]. To improve prognosis assessment based on TLS properties, we developed TLSig, a prognostic signature that utilizes TLS-related genes.
Our findings showed that TLSs were unevenly distributed across most tumors, largely due to the inherent diversity of tumor types. Specifically, certain malignant tumors developed in immune-privileged organs where immune cells struggle to infiltrate [41], [42], [43], resulted in weak expression of the TLS signature. This phenomenon was most frequently observed in the brain, such as in GBM, lower-grade glioma (LGG), and UVM. Conversely, TGCT, which was also developed in an immune-privileged organ, exhibited notably high expressions of TLS-related gene features. This phenomenon requires further investigation. Furthermore, adrenal gland tumors, such as adrenocortical carcinoma (ACC), pheochromocytoma, and paraganglioma (PCPG), showed low expression of TLSs due to the immunosuppressive effects of corticosteroids produced by the adrenal gland [44].
Using the established TLS-related signature that predicts pan-cancer prognosis, we observed that the low-risk group had a better prognosis. A correlation analysis between TLS enrichment scores and TLS risk scores showed that the lower the risk, the higher the enrichment score. In the low-risk group, where more TLSs were present, patients had a better prognosis, consistent with previous studies [3, 4]. However, the combination of survival curves for each tumor showed no significant correlation or even an opposite trend in the survival analysis for GBM, TGCT, and UVM. This challenge of accurately describing the prognosis of TLSig is understandable due to the immune privilege of the organ where TLSs are located. In terms of immunotherapy, the good predictive power of TLSs for immunotherapy has been confirmed in several tumors in recent years [5], [6], [7, 45], [46], [47]. In the immunotherapy IMvigor210 dataset, better responses to immunotherapy in the low-risk group were validated. Finally, the analysis showed a significant positive correlation between TLS risk scores and the ES of EMT and the cell cycle. Thus, more abundant TLSs were associated with lower EMT and cell cycle activity, suggesting that TLSs may control tumor invasion and metastasis by affecting EMT and the cell cycle.
The results of both the bioinformatics analysis and the experiments showed that in HCC, there were fewer TLSs in the tumor tissues than in the nontumor tissues. TLSs are essentially aggregates of lymphocytes, mainly T cells and B cells [4], which cannot develop without an immune response [48]. The tumor microenvironment of HCC presents obvious immunosuppressive properties [49]. From this perspective, it is easy to understand that there are fewer TLSs in tumor tissues than in nontumor tissues, and similar results have been reported [50]. Furthermore, we observed differential HLA expression between tumor and nontumor tissues of HCC, and the trend of the differences in HLA-ABC, HLA-E, and HLA-G between tumor and nontumor tissues are well matched with the trend of the differences in TLS from the section data. Given that tumor cells usually evade immune surveillance by regulating the expression of HLA molecules [8], we speculate that HCC cells affect the formation of TLSs by regulating the expression of HLA.
Conclusions
In summary, our results demonstrated that TLS-related genes were strongly related to prognosis and provided new insights into prognostic prediction for pan-cancer. We validated the distribution differences of TLSs and explored the relationship between TLSs and HLA in HCC samples. Currently, the potential mechanisms of interaction between TLSs and the TME are unclear, and more extensive studies need to be conducted.
Funding source: Jiangsu Funding Program for Excellent Postdoctoral Talent
Award Identifier / Grant number: No. 2022ZB699
Acknowledgments
We thank all the authors involved in this study for data collection, preparation, quality control and manuscript writing.
-
Research ethics: The study was approved by the Institutional Ethics Committee of Nanjing Drum Tower Hospital (approval number: 2021-566-02).
-
Informed consent: Informed consent was obtained from all individuals included in this study.
-
Author contributions: The authors confirm their contribution to the paper as follows: Conceptualization: HL and BS; Methodology: HL; Analysis: WD, XH and RL; Data curation: FY and XL; Writing—original draft preparation: HL and WD; Writing—review and editing: WD and HL; Project administration: BS; Funding acquisition: HL. All authors reviewed the results and approved the final version of the manuscript.
-
Competing interests: Authors state no conflict of interest.
-
Research funding: This work was supported by “Jiangsu Funding Program for Excellent Postdoctoral Talent” (No. 2022ZB699).
-
Data availability: Gene expression and corresponding clinical data of cohorts were collected from publicly available databases, as detailed in Table S2. Analyzed codes during the current study is available from the corresponding author upon reasonable request.
References
1. Klein, CA. Cancer progression and the invisible phase of metastatic colonization. Nat Rev Cancer 2020;20:681–94. https://doi.org/10.1038/s41568-020-00300-6.Search in Google Scholar PubMed
2. Liu, H, Li, H, Luo, K, Sharma, A, Sun, X. Prognostic gene expression signature revealed the involvement of mutational pathways in cancer genome. J Cancer 2020;11:4510–20. https://doi.org/10.7150/jca.40237.Search in Google Scholar PubMed PubMed Central
3. Sautès-Fridman, C, Petitprez, F, Calderaro, J, Fridman, WH. Tertiary lymphoid structures in the era of cancer immunotherapy. Nat Rev Cancer 2019;19:307–25. https://doi.org/10.1038/s41568-019-0144-6.Search in Google Scholar PubMed
4. Schumacher, TN, Thommen, DS. Tertiary lymphoid structures in cancer. Science 2022;375:eabf9419. https://doi.org/10.1126/science.abf9419.Search in Google Scholar PubMed
5. Cabrita, R, Lauss, M, Sanna, A, Donia, M, Skaarup Larsen, M, Mitra, S, et al.. Tertiary lymphoid structures improve immunotherapy and survival in melanoma. Nature 2020;577:561–5. https://doi.org/10.1038/s41586-019-1914-8.Search in Google Scholar PubMed
6. Petitprez, F, de Reyniès, A, Keung, EZ, Chen, TW-W, Sun, C-M, Calderaro, J, et al.. B cells are associated with survival and immunotherapy response in sarcoma. Nature 2020;577:556–60. https://doi.org/10.1038/s41586-019-1906-8.Search in Google Scholar PubMed
7. Helmink, BA, Reddy, SM, Gao, J, Zhang, S, Basar, R, Thakur, R, et al.. B cells and tertiary lymphoid structures promote immunotherapy response. Nature 2020;577:549–55. https://doi.org/10.1038/s41586-019-1922-8.Search in Google Scholar PubMed PubMed Central
8. Bukur, J, Jasinski, S, Seliger, B. The role of classical and non-classical HLA class I antigens in human tumors. Semin Cancer Biol 2012;22:350–8. https://doi.org/10.1016/j.semcancer.2012.03.003.Search in Google Scholar PubMed
9. Cathro, HP, Smolkin, ME, Theodorescu, D, Jo, VY, Ferrone, S, Frierson, HFJr. Relationship between HLA class I antigen processing machinery component expression and the clinicopathologic characteristics of bladder carcinomas. Cancer Immunol Immunother 2010;59:465–72. https://doi.org/10.1007/s00262-009-0765-9.Search in Google Scholar PubMed PubMed Central
10. Geertsen, R, Boni, R, Blasczyk, R, Romero, P, Betts, D, Rimoldi, D, et al.. Loss of single HLA class I allospecificities in melanoma cells due to selective genomic abbreviations. Int J Cancer 2002;99:82–7. https://doi.org/10.1002/ijc.10284.Search in Google Scholar PubMed
11. Maleno, I, Aptsiauri, N, Cabrera, T, Gallego, A, Paschen, A, Lopez-Nevot, MA, et al.. Frequent loss of heterozygosity in the beta2-microglobulin region of chromosome 15 in primary human tumors. Immunogenetics 2011;63:65–71. https://doi.org/10.1007/s00251-010-0494-4.Search in Google Scholar PubMed
12. Curtis, C, Shah, SP, Chin, S-F, Turashvili, G, Rueda, OM, Dunning, MJ, et al.. The genomic and transcriptomic architecture of 2,000 breast tumours reveals novel subgroups. Nature 2012;486:346–52. https://doi.org/10.1038/nature10983.Search in Google Scholar PubMed PubMed Central
13. Chin, K, DeVries, S, Fridlyand, J, Spellman, PT, Roydasgupta, R, Kuo, W-L, et al.. Genomic and transcriptional aberrations linked to breast cancer pathophysiologies. Cancer Cell 2006;10:529–41. https://doi.org/10.1016/j.ccr.2006.10.009.Search in Google Scholar PubMed
14. Kao, K-J, Chang, K-M, Hsu, H-C, Huang, AT. Correlation of microarray-based breast cancer molecular subtypes and clinical outcomes: implications for treatment optimization. BMC Cancer 2011;11:1–15. https://doi.org/10.1186/1471-2407-11-143.Search in Google Scholar PubMed PubMed Central
15. Sabatier, R, Finetti, P, Cervera, N, Lambaudie, E, Esterni, B, Mamessier, E, et al.. A gene expression signature identifies two prognostic subgroups of basal breast cancer. Breast Cancer Res Treat 2011;126:407–20. https://doi.org/10.1007/s10549-010-0897-9.Search in Google Scholar PubMed
16. Lee, E-S, Son, D-S, Kim, S-H, Lee, J, Jo, J, Han, J, et al.. Prediction of recurrence-free survival in postoperative non-small cell lung cancer patients by using an integrated model of clinical information and gene expression. Clin Cancer Res 2008;14:7397–404. https://doi.org/10.1158/1078-0432.ccr-07-4937.Search in Google Scholar
17. Okayama, H, Kohno, T, Ishii, Y, Shimada, Y, Shiraishi, K, Iwakawa, R, et al.. Identification of genes upregulated in ALK-positive and EGFR/KRAS/ALK-negative lung adenocarcinomas expression profiles of ALK-positive and EGFR/KRAS/ALK-negative lung adenocarcinomas. Cancer Res 2012;72:100–11. https://doi.org/10.1158/0008-5472.can-11-1403.Search in Google Scholar PubMed
18. Rousseaux, S, Debernardi, A, Jacquiau, B, Vitte, A-L, Vesin, A, Nagy-Mignotte, H, et al.. Ectopic activation of germline and placental genes identifies aggressive metastasis-prone lung cancers. Sci Transl Med 2013;5:186ra66. https://doi.org/10.1126/scitranslmed.3005723.Search in Google Scholar PubMed PubMed Central
19. Hou, J, Aerts, J, Den Hamer, B, Van Ijcken, W, Den Bakker, M, Riegman, P, et al.. Gene expression-based classification of non-small cell lung carcinomas and survival prediction. PLoS One 2010;5:e10312. https://doi.org/10.1371/journal.pone.0010312.Search in Google Scholar PubMed PubMed Central
20. Lohavanichbutr, P, Méndez, E, Holsinger, FC, Rue, TC, Zhang, Y, Houck, J, et al.. A 13-gene signature prognostic of HPV-negative OSCC: discovery and external validation. Clin Cancer Res 2013;19:1197–203. https://doi.org/10.1158/1078-0432.ccr-12-2647.Search in Google Scholar PubMed PubMed Central
21. Mariathasan, S, Turley, SJ, Nickles, D, Castiglioni, A, Yuen, K, Wang, Y, et al.. TGFβ attenuates tumour response to PD-L1 blockade by contributing to exclusion of T cells. Nature 2018;554:544–8. https://doi.org/10.1038/nature25501.Search in Google Scholar PubMed PubMed Central
22. Riaz, N, Havel, JJ, Makarov, V, Desrichard, A, Urba, WJ, Sims, JS, et al.. Tumor and microenvironment evolution during immunotherapy with nivolumab. Cell 2017;171:934–49.e16. https://doi.org/10.1016/j.cell.2017.09.028.Search in Google Scholar PubMed PubMed Central
23. Kim, JY, Choi, JK, Jung, H. Genome-wide methylation patterns predict clinical benefit of immunotherapy in lung cancer. Clin Epigenetics 2020;12:119. https://doi.org/10.1186/s13148-020-00907-4.Search in Google Scholar PubMed PubMed Central
24. Hänzelmann, S, Castelo, R, Guinney, J. GSVA: gene set variation analysis for microarray and RNA-seq data. BMC Bioinform 2013;14:7. https://doi.org/10.1186/1471-2105-14-7.Search in Google Scholar PubMed PubMed Central
25. Kassambara, A, Kosinski, M, Biecek, P, Fabian, S. Drawing survival curves using ‘ggplot2’. R package survminer version 0.4.9; 2021. Available from: https://CRAN.R-project.org/package=survminer.Search in Google Scholar
26. Yu, G, Wang, LG, Han, Y, He, QY. clusterProfiler: an R package for comparing biological themes among gene clusters. Omics 2012;16:284–7. https://doi.org/10.1089/omi.2011.0118.Search in Google Scholar PubMed PubMed Central
27. Silina, K, Soltermann, A, Attar, FM, Casanova, R, Uckeley, ZM, Thut, H, et al.. Germinal centers determine the prognostic relevance of tertiary lymphoid structures and are impaired by corticosteroids in lung squamous cell carcinoma. Cancer Res 2018;78:1308–20. https://doi.org/10.1158/0008-5472.can-17-1987.Search in Google Scholar
28. Schneider, CA, Rasband, WS, Eliceiri, KW. NIH Image to ImageJ: 25 years of image analysis. Nat Methods 2012;9:671–5. https://doi.org/10.1038/nmeth.2089.Search in Google Scholar PubMed PubMed Central
29. Gu-Trantien, C, Loi, S, Garaud, S, Equeter, C, Libin, M, De Wind, A, et al.. CD4+ follicular helper T cell infiltration predicts breast cancer survival. J Clin Investig 2013;123:2873–92. https://doi.org/10.1172/jci67428.Search in Google Scholar PubMed PubMed Central
30. Coppola, D, Nebozhyn, M, Khalil, F, Dai, H, Yeatman, T, Loboda, A, et al.. Unique ectopic lymph node-like structures present in human primary colorectal carcinoma are identified by immune gene array profiling. Am J Pathol 2011;179:37–45. https://doi.org/10.1016/j.ajpath.2011.03.007.Search in Google Scholar PubMed PubMed Central
31. Messina, JL, Fenstermacher, DA, Eschrich, S, Qu, X, Berglund, AE, Lloyd, MC, et al.. 12-Chemokine gene signature identifies lymph node-like structures in melanoma: potential for patient selection for immunotherapy? Sci Rep 2012;2:765. https://doi.org/10.1038/srep00765.Search in Google Scholar PubMed PubMed Central
32. Finkin, S, Yuan, D, Stein, I, Taniguchi, K, Weber, A, Unger, K, et al.. Ectopic lymphoid structures function as microniches for tumor progenitor cells in hepatocellular carcinoma. Nat Immunol 2015;16:1235–44. https://doi.org/10.1038/ni.3290.Search in Google Scholar PubMed PubMed Central
33. Hennequin, A, Derangere, V, Boidot, R, Apetoh, L, Vincent, J, Orry, D, et al.. Tumor infiltration by Tbet+ effector T cells and CD20+ B cells is associated with survival in gastric cancer patients. Oncoimmunology 2016;5:e1054598. https://doi.org/10.1080/2162402x.2015.1054598.Search in Google Scholar PubMed PubMed Central
34. Kroeger, DR, Milne, K, Nelson, BH. Tumor-infiltrating plasma cells are associated with tertiary lymphoid structures, cytolytic T-cell responses, and superior prognosis in ovarian cancer. Clin Cancer Res 2016;22:3005–15. https://doi.org/10.1158/1078-0432.ccr-15-2762.Search in Google Scholar PubMed
35. Becht, E, de Reyniès, A, Giraldo, NA, Pilati, C, Buttard, B, Lacroix, L, et al.. Immune and stromal classification of colorectal cancer is associated with molecular subtypes and relevant for precision immunotherapy. Clin Cancer Res 2016;22:4057–66. https://doi.org/10.1158/1078-0432.ccr-15-2879.Search in Google Scholar PubMed
36. Dieu-Nosjean, M-C, Goc, J, Giraldo, NA, Sautès-Fridman, C, Fridman, WH. Tertiary lymphoid structures in cancer and beyond. Trends Immunol 2014;35:571–80. https://doi.org/10.1016/j.it.2014.09.006.Search in Google Scholar PubMed
37. Jacquelot, N, Tellier, J, Sl, N, Gt, B. Tertiary lymphoid structures and B lymphocytes in cancer prognosis and response to immunotherapies. Oncoimmunology 2021;10:1900508. https://doi.org/10.1080/2162402x.2021.1900508.Search in Google Scholar PubMed PubMed Central
38. Finkin, S, Yuan, D, Stein, I, Taniguchi, K, Weber, A, Unger, K, et al.. Ectopic lymphoid structures function as microniches for tumor progenitor cells in hepatocellular carcinoma. Nat Immunol 2015;16:1235–44. https://doi.org/10.1038/ni.3290.Search in Google Scholar
39. Trüb, M, Zippelius, A. Tertiary lymphoid structures as a predictive biomarker of response to cancer immunotherapies. Front Immunol 2021;12:1432. https://doi.org/10.3389/fimmu.2021.674565.Search in Google Scholar PubMed PubMed Central
40. Domblides, C, Rochefort, J, Riffard, C, Panouillot, M, Lescaille, G, Teillaud, J-L, et al.. Tumor-associated tertiary lymphoid structures: from basic and clinical knowledge to therapeutic manipulation. Front Immunol 2021;12:698604. https://doi.org/10.3389/fimmu.2021.698604.Search in Google Scholar PubMed PubMed Central
41. Streilein, JW. Ocular immune privilege: therapeutic opportunities from an experiment of nature. Nat Rev Immunol 2003;3:879–89. https://doi.org/10.1038/nri1224.Search in Google Scholar PubMed
42. Keino, H, Horie, S, Sugita, S. Immune privilege and eye-derived T-regulatory cells. J Immunol Res 2018;2018:1679197–12. https://doi.org/10.1155/2018/1679197.Search in Google Scholar PubMed PubMed Central
43. Engelhardt, B, Vajkoczy, P, Weller, RO. The movers and shapers in immune privilege of the CNS. Nat Immunol 2017;18:123–31. https://doi.org/10.1038/ni.3666.Search in Google Scholar PubMed
44. Siliņa, K, Soltermann, A, Attar, FM, Casanova, R, Uckeley, ZM, Thut, H, et al.. Germinal centers determine the prognostic relevance of tertiary lymphoid structures and are impaired by corticosteroids in lung squamous cell carcinoma. Cancer Res 2018;78:1308–20. https://doi.org/10.1158/0008-5472.can-17-1987.Search in Google Scholar PubMed
45. Vanhersecke, L, Brunet, M, Guégan, J-P, Rey, C, Bougouin, A, Cousin, S, et al.. Mature tertiary lymphoid structures predict immune checkpoint inhibitor efficacy in solid tumors independently of PD-L1 expression. Nat Cancer 2021;2:794–802. https://doi.org/10.1038/s43018-021-00232-6.Search in Google Scholar PubMed PubMed Central
46. Gao, J, Navai, N, Alhalabi, O, Siefker-Radtke, A, Campbell, MT, Tidwell, RS, et al.. Neoadjuvant PD-L1 plus CTLA-4 blockade in patients with cisplatin-ineligible operable high-risk urothelial carcinoma. Nat Med 2020;26:1845–51. https://doi.org/10.1038/s41591-020-1086-y.Search in Google Scholar PubMed PubMed Central
47. Meylan, M, Petitprez, F, Becht, E, Bougoüin, A, Pupier, G, Calvez, A, et al.. Tertiary lymphoid structures generate and propagate anti-tumor antibody-producing plasma cells in renal cell cancer. Immunity 2022;55:527–41.e5. https://doi.org/10.1016/j.immuni.2022.02.001.Search in Google Scholar PubMed
48. Gago da Graca, C, van Baarsen, LGM, Mebius, RE. Tertiary lymphoid structures: diversity in their development, composition, and role. J Immunol 2021;206:273–81. https://doi.org/10.4049/jimmunol.2000873.Search in Google Scholar PubMed
49. Lu, C, Rong, D, Zhang, B, Zheng, W, Wang, X, Chen, Z, et al.. Current perspectives on the immunosuppressive tumor microenvironment in hepatocellular carcinoma: challenges and opportunities. Mol Cancer 2019;18:130. https://doi.org/10.1186/s12943-019-1047-6.Search in Google Scholar PubMed PubMed Central
50. Li, H, Liu, H, Fu, H, Li, J, Xu, L, Wang, G, et al.. Peritumoral tertiary lymphoid structures correlate with protective immunity and improved prognosis in patients with hepatocellular carcinoma. Front Immunol 2021;12:648812. https://doi.org/10.3389/fimmu.2021.648812.Search in Google Scholar PubMed PubMed Central
Supplementary Material
This article contains supplementary material (https://doi.org/10.1515/oncologie-2023-0372).
© 2023 the author(s), published by De Gruyter, Berlin/Boston
This work is licensed under the Creative Commons Attribution 4.0 International License.
Articles in the same Issue
- Frontmatter
- Review Article
- Mesenchymal stem cell exosomes: a promising delivery system for glioma therapy
- Research Articles
- A multi-cancer analysis unveils ITGBL1 as a cancer prognostic molecule and a novel immunotherapy target
- MicroRNA-302a enhances 5-fluorouracil sensitivity in HepG2 cells by increasing AKT/ULK1-dependent autophagy-mediated apoptosis
- Integrated analysis of TCGA data identifies endoplasmic reticulum stress-related lncRNA signature in stomach adenocarcinoma
- Glioblastoma with PRMT5 gene upregulation is a key target for tumor cell regression
- BRCA mutation in Vietnamese prostate cancer patients: a mixed cross-sectional study and case series
- Microglia increase CEMIP expression and promote brain metastasis in breast cancer through the JAK2/STAT3 signaling pathway
- Integrative machine learning algorithms for developing a consensus RNA modification-based signature for guiding clinical decision-making in bladder cancer
- Transcriptome analysis of tertiary lymphoid structures (TLSs)-related genes reveals prognostic value and immunotherapeutic potential in cancer
- Prognostic value of a glycolysis and cholesterol synthesis related gene signature in osteosarcoma: implications for immune microenvironment and personalized treatment strategies
- Identification of potential biomarkers in follicular thyroid carcinoma: bioinformatics and immunohistochemical analyses
- Rapid Communication
- Comparison of the Molecular International Prognostic Scoring System (IPSS-M) and Revised International Prognostic Scoring System (IPSS-R) in predicting the prognosis of patients with myelodysplastic neoplasms treated with decitabine
- Case Reports
- Intrapericardial nonfunctional paraganglioma: a case report and literature review
- Treatment of central nervous system relapse in PLZF::RARA-positive acute promyelocytic leukemia by venetoclax combined with arubicin, cytarabine and intrathecal therapy: a case report