Three-dimensional scanning electron microscopy used as a profilometer for the surface characterization of polyethylene-coated paperboard
-
Javier Brugés Martelo

 ,
Mattias Andersson
,
Mattias Andersson

Abstract
In food packaging, low-density polyethylene (PE) coating is applied to paperboards to act as a functional barrier and to provide the smoothness required to enhance printability. These characteristics are related to the material’s surface roughness, the parameter monitored during the manufacturing process. Measurement of surface roughness using optical profilometry has gained importance in the paper industry. The optical instruments used to measure surface roughness are limited spatially by the relationship with the light wavelength at which they operate. A scanning electron microscope (SEM) is an alternative for overcoming the spatial resolution limitation, and the use of stereo-photogrammetry on SEM images can be seen as an alternative profilometry technique to measure surface roughness. In this investigation, the surface topography of industrially manufactured high-quality PE-coated paperboard was studied, comparing the SEM stereo-photogrammetry technique with a reference profilometry method, i. e., chromatic confocal microscopy (CCM). We found close agreement between the calculated surface roughness and the results of the techniques used and compared them according to the new ISO 25178 Geometric Product Specifications. We concluded that SEM stereo-photogrammetry provides comparable accurate alternative profilometry method for characterizing the surface roughness of PE-coated paperboard in the micrometer scale.
Introduction
Paperboard grades are classified depending on their functionality, with food packaging paperboard being higher in optical and surface quality. Different surface finishes and coatings are specified to produce the desired product functionalities and qualities. In the food packaging industry, polyethylene (PE) coating is applied to paperboards because of its excellent barrier functionality against moisture and the resulting smooth final surface texture, both of which are important for visual appeal and the intended product quality. Surface roughness is measured on the paperboard through its correlation with optical properties, such as gloss uniformity, which are related to the final product specifications (Béland and Bennett2000).
Industrial surface characterization of paperboard
In PE coating of paperboard, the measurement of surface roughness is used to monitor the smoothness of the final product, which is a surface parameter that affects printability. The standard for measuring surface roughness in the paper and board industry is based on the air leak method, i. e. Bendtsen, Bekk and Parker print surf (PPS) (Enomae and Onabe1997). The measurement instrument estimates surface roughness by measuring the rate at which air escapes from a system consisting of metal plates sandwiched between paperboard samples, and the results are correlated with the roughness parameter of the sample. The calibration used to estimate roughness values is limited by the range of spatial distribution of the surface of the product grade. Although what constitutes a good agreement between paper and paperboard grades and their surface parameters is well defined, the associated measurement methods cannot provide detailed information on surface texture or its spatial distribution (e. g. roughness variation) associated with product quality.
Emerging profilometry technologies for PE-coated paperboard characterization
A recent study compares a set of optical profilometers used to measure the surface roughness of various paper grades (Mettänen and Hirn2015). It demonstrated that the preferred and selected instrument depends on the spatial distribution of the surface roughness, and systematic deviations were present in all-optical measurement techniques at different stages of the measurements. The surface material’s optical and geometrical properties present a challenge when it comes to establishing a common technique for characterizing all paper grades. Optical devices such as confocal scanning microscopes (Jordan et al.1998) and scanning electron microscopes (SEMs) (Hawkes and Reimer2013) are valuable tools for surface characterization. Chromatic confocal microscope (CCM) is a variation within the former category of microscopes, and it has been included in the new ISO 25178 Geometric Product Specifications (Blateyron2011) for areal surface characterization. Up to 1 cm2 (i. e., relatively large) areas of paperboard can be analyzed by scanning the sample’s area laterally (i. e., along the Cartesian coordinate axis X–Y) with micrometer lateral accuracy and a depth resolution of tens of nanometers (Mettänen and Hirn2015). The high dynamic range of the SEM represents an advantage over other imaging techniques. SEM is employed for the surface characterization of paper and paperboard, with the paper and paperboard sample’s cross-section commonly being analyzed under this microscope. This technique provides information about the local structures in the material composition and their relationships with different surface parameters affecting the product quality. Cross-sectional micrographs of paperboard combined with digital image analysis were used to find correlations between the base sheet distribution of the board and its coating thickness uniformity (Dahlström and Uesaka2009). This approach has also been used to quantify different surface statistical parameters, including surface roughness, of commercial super-calender paper (Chinga et al.2007). Although these methods provide agreement as to how the local composition affects the paper quality, cross-sectional analysis is time-consuming and invasive. The sample’s preparation can result in a modification of the original structural properties, and the cross-section inspected is limited to small areas of the product.
As an imaging system, an SEM provides a greater dynamic range than does any optical system. Electrons have a shorter wavelength than do photons, allowing the SEM to analyze specimens using a larger field of view with a greater depth of field and greater magnification. It also permits observation of surface details, such as topographic texture and material contrast, up to nanometer resolution. The highly detailed topographic images acquired by an SEM are two-dimensional, and the gray-scale information lacks quantified depth information about the specimen. Software developers are now integrating stereo-photogrammetry to estimate surface topography (Marinello et al.2008) from SEM micrographs. Several photogrammetry techniques have been proposed, with stereo-photogrammetry being one of the most popular (Howell1978). Stereo-photogrammetry with an SEM uses two (i. e., a stereo pair) or more images of the same scene acquired from different angles of incidence. In the SEM, a sample mounted on a stage can be oriented towards the detector at different angles, contributing to changes in perspective relative to the same region of interest (ROI). This profilometry technique for characterizing paper samples using the SEM was reported by Enomae (Enomae et al.1993). It used stereo-photogrammetry after acquiring two images from two detectors positioned at both sides of the electron beam column, generating the disparity map necessary for calculating depth in the sample image. Most recently, instrument inter-comparison using optical coherence scanning interferometry and 3D SEM stereo-photogrammetry for dental implants was presented (Glon et al.2014). Surface roughness analysis was compared among the instruments, with the author selecting the root mean square roughness (Rq) and power spectral density function (PSD) surface parameters for statistical validation. PSD analysis provided a resource for instrument inter-comparison, using the spatial bandwidth limits of the instruments and the resulting integration limits for surface roughness calculations and to highlight the differences in the results.
Duparré (Duparré et al.2002) proposed studying larger-scale PSD in the topography of paper samples of various grades. Two profilometers with overlapping spatial bandwidth distributions were employed to extend the spatial wavelength analysis of the PSD. Similarly, multi-scale analysis using a focus variation optical profilometer has been proposed (Vernhes et al.2008) for the analysis of different grades of papers based on the new ISO 25178 specifications, with each measurement providing scale-limited surfaces within a finite range of spatial distributions. The surface parameters measured within different bandwidth limits describe the instrument performance along with the different bandwidth limits. An essential part of the inter-instrument comparison is to use the bandwidth limits of the instruments as information for validating the surface parameter characterization. To this end, bandwidth matching guidelines for inter-instrument comparison have been formally introduced by Leach (Leach and Haitjema2010).
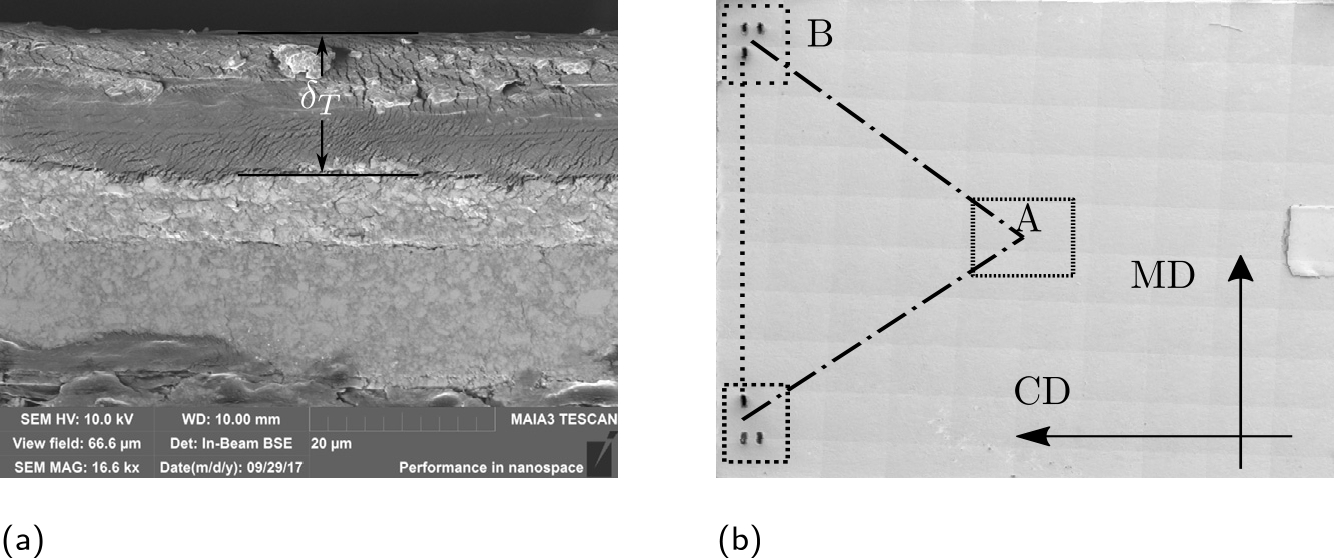
(a) SEM cross-sectional image showing the material distribution in the paperboard sample.
In this study, we compare surface parameters from different scanning imaging systems. The imaging systems project a beam spot on the sample, and the beam size defines both the spatial resolution of the instrument and the spatial bandwidth limits of the measurement. To carry out comparative instrumental studies, matching the number of pixels on the area of comparison is necessary. The spatial resolutions of CCMs and SEMs are limited by this beam spot characteristic and by the spectral wavelength of the particle that generates the image, i. e., photons or electrons.
Outline of the article
In this study, we measured the surface topography of an industrially manufactured, high-quality PE-coated paperboard using two complementary imaging techniques. The aim was to provide an alternative instrumental technique for the surface characterization of paperboard using 3D stereo-photogrammetry with a scanning electron microscope (SEM) and a valid comparison with reference optical profilometry using a chromatic confocal microscope (CCM). We described the use of the software tool MeX 6.0 (Alicona Imaging GmbH, Raaba/Graz, Austria), as it was included in the SEM software tools for obtaining the surface topography dataset of the sample. After obtaining the surface topography datasets, we calculated the areal surface roughness parameter, Sq, and the 1D-PSD function from both the sample’s machine direction (MD) and cross-machine direction (CD) (Alam et al.2011), using the results for the inter-instrument comparison validation. From the PSD curves, the one-dimensional roughness parameter, Rq, was calculated from both datasets. The following section describes the sample preparation, the instruments used in the measurements, and the methods for surface parameter extraction. Following that, we introduce the topography maps and the results of the metrology analysis. Finally, conclusions and future work are presented.
Materials and methods
This section presents the sample preparation and instrument selection and description. Furthermore, it describes the statistical parameters used for the analysis and comparison of the topographic datasets.
Samples
The sample selected for this study is a 20 × 20 mm sample from an industrially manufactured low-density polyethylene (PE)-coated paperboard sheet. Figure 1(a) shows the composition of the paperboard sample in a cross-sectional image acquired by an SEM. The thickness,
It was necessary to apply a metal coating on the sample surface to obtain high-contrast SEM images while reducing the noise generated by electron scattering from non-conductive materials in the sample. A 3 nm layer of iridium was sputtered on top of the sample surface; this coating material was selected because its smaller grain size would generate a more even coating distribution, in contrast to other conventional materials such as gold. All measurements used the same PE paperboard sample coated with a top layer of iridium to finally obtain the same surface topography.
Instruments
Chromatic confocal microscope
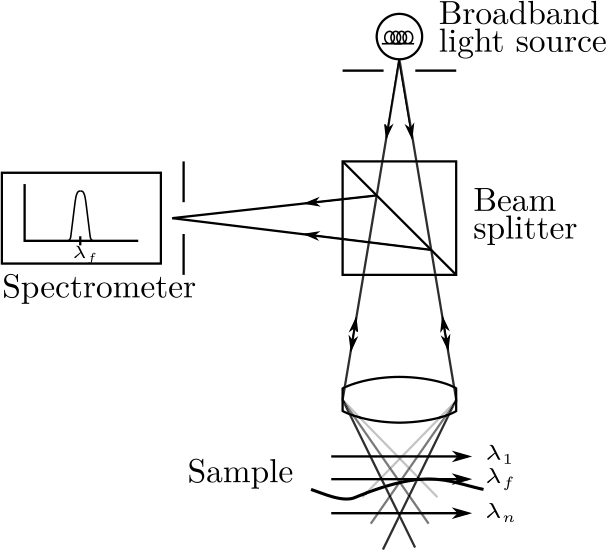
Chromatic confocal microscope (FRT MicroProf; Fries Research & Technology GmbH, Bergisch Gladbach, Germany) was employed as the reference device with which to obtain the surface texture and surface statistical parameters from the PE-coated paperboard sample; these parameters are included in the new ISO 25178 specifications for both instrument and statistical validation. The CCM is located in a laboratory with controlled and stable temperature and humidity, to ensure the repeatability of the results during the measurement acquisition time. Figure 2 shows a schematic of the CCM. A white light source (400–700 nm spectral range) is collimated through the system and focused on the inspected surface by a positive chromatic aberration lens. The chromatic aberration in the lens is specifically designed to be as great as possible, dispersing the light spectral range along with the beam spot. The light is reflected into the sensor, and an intensity peak centered at a particular wavelength in the system’s spectral range represents the local height variation of the sample. Light travels through a pinhole detector placed in front of a spectrometer. The spectrometer decodes the spectral information as the local height variation from the calibrated spectral range. The optical microscope employs no moving parts to obtain the local height, but it does require that the base move the sample in the X–Y direction until the entire area is scanned. A chromatic probe with a calibrated depth range of 300 µm and lateral resolution (i. e., beam spot size) of 1 µm was used as the objective sensor in the CCM.
The grating spectrometer provides instantaneous depth information, making such devices much faster than traditional confocal microscopes or profilometer techniques. The range of heights that this instrument can measure is limited by the design of the dispersive objective and the spectral range of the light source. Another drawback of this system is its limited ability to measure topographies in objects with steep local variations.
Chromatic confocal microscope.
Scanning electron microscope
Two-dimensional SEM micrographs of the sample were acquired using a TESCAN MIRA3 GMU (TESCAN Brno, s. r. o., Brno, Czechia). Multiple detectors are available for this SEM, and a secondary electron detector was chosen for pure topographic imaging. The electron beam voltage of 2 kV was selected, which corresponds to a beam spot size of 25 nm. To create the stereo-pair images, the eucentric tilting of the sample stage was used with a tilt of ±5° from a central tilted position of 20°. The sample stage could be tilted towards the detector to increase the electron yield from the sample–detector interaction and to obtain higher topographic contrast in the images. Before scanning the surface, it is necessary to co-localize the ROI. We used the MeX software co-localization tool, placing a 2D image from the CCM-measured topography into the live image from the SEM. The central tilted position (i. e., at 20°) described above was aligned with the texture information from the CCM image in the software. The texture information provided the necessary fiducial marks to center the SEM micrographs for the CCM measurement. The obtained stereo-pair SEM micrographs used a magnification of 554× with a field of view of 2 mm. The two resulting micrographs were cropped to a 4096 × 4096 pixel area with 488.28 nm lateral resolution.
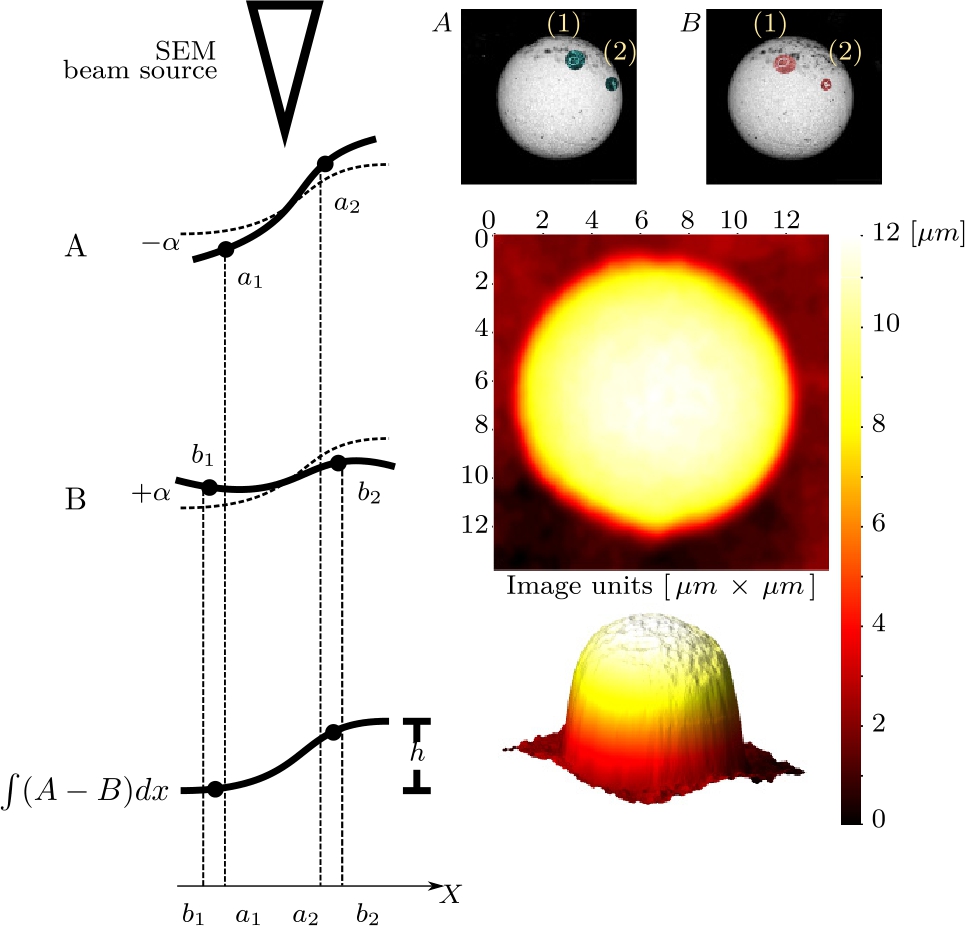
SEM stereo-photogrammetry requires at least two images from different perspectives, i. e., A and B. Image pixels in both images undergo lateral displacement, i. e., (1) and (2). By knowing how far identified features are displaced and the angle of perspective,
SEM stereo-photogrammetry
After locating ROI on the SEM live image and aligning with the CCM 2D image, stereo-pair images were acquired from two perspectives ±5° from a central tilted position of 20°. As shown in Figure 3, the stereo-pair images were used to create a disparity map showing the lateral distances of identical features located at slightly different positions in the two images. In Figure 3, a reference standard sphere consisting of Polystyrene Divinylbenzene and traceable diameter of 10 µm (4D-10, 4D Series Dry Microsphere Size Standards NIST, Thermo Scientific™) is captured on the SEM and arranged with relatively different orientations in each image. To estimate the 3D topography, the disparity map with the known tilt angles was used to calculate the topographic maps by triangulation. The sphere can be reconstructed in its 3D shape, but not the areas below the sphere occluded to the sensor. From the SEMs toolbox, we used the software MeX 6.0 (Alicona Imaging GmbH, Raaba/Graz, Austria) as a standard to create the topographic datasets. We downscaled the dataset using bilinear spline interpolation after the topographic maps were created. This step was necessary to adjust the lateral resolution of the CCMs topographic dataset.
The statistical parameters
To extract the different spatial components on a topographic dataset, different spatial filters are used. In the context of areal surface characterization, two filters are used, the S-filter and the L-filter. The former removes small-scale lateral components such as residual noise, and the latter limits the effects of large-scale components in the surface texture. The application of these filters results in a scale-limited surface. To obtain scale-limited surfaces from the topographic datasets, the general procedure presented in the ISO 25178-3 specifications (ISO 25178-32012) was followed. Second-order polynomial regression was used to derive the form from the extracted surfaces. The use of S and L Gaussian filters with 2.5 µm and 250 µm nesting indexes, respectively, resulted in a scale-limited (S-L) surface dataset. The lateral resolution of the CCM dataset, i. e., 1.36 µm, was used as the minimum possible value for the S-filter nesting index. Importantly for the bandwidth matching condition, each extracted dataset used for this comparison had the same number of pixels and equal lateral resolution. The generated S-L surface was conformable with the bandwidth characteristics of both profilometry systems.
Areal parameters, introduced in ISO 25178-2, are used for analysing surface texture. The areal root mean square surface heights (Sq) and the 1D power spectral density (1D-PSD) function in the axial directions, i. e., CD and MD, were calculated from the obtained S-L surface. The Sq parameter served as a comparison tool for analysing the overall areal roughness. However, it does not take into consideration directional features such as those encountered on anisotropic surfaces. To account for the directional anisotropy of the samples, the 1D-PSD 1 is used within the spatial bandwidth limits of the instruments, and the integration of the curve in the 1D-PSD results in the RMS surface roughness (2) for the MD and the CD.
Results and discussion
Topography dataset generation and representation
The surface topography of one PE-coated paperboard sample was determined using CCM and 3D SEM stereo-photogrammetry measurement techniques. The results are comparable only if the instruments’ spatial wavelengths match within the bandwidth limits of the measurements, so special care is taken to use appropriate filtering techniques to ensure adequate resulting topographies, as described in the “Materials and methods” section.
Figure 4 presents the surface topography of the sample. The region of interest (ROI) has been cropped to 1.6 × 0.8 mm. First, a low-pass filter (S-filter) with a 2.5 µm nested index was used and next a second-order polynomial regression to remove the form in the surface was applied to the topographic datasets to obtain the presented primary surfaces.
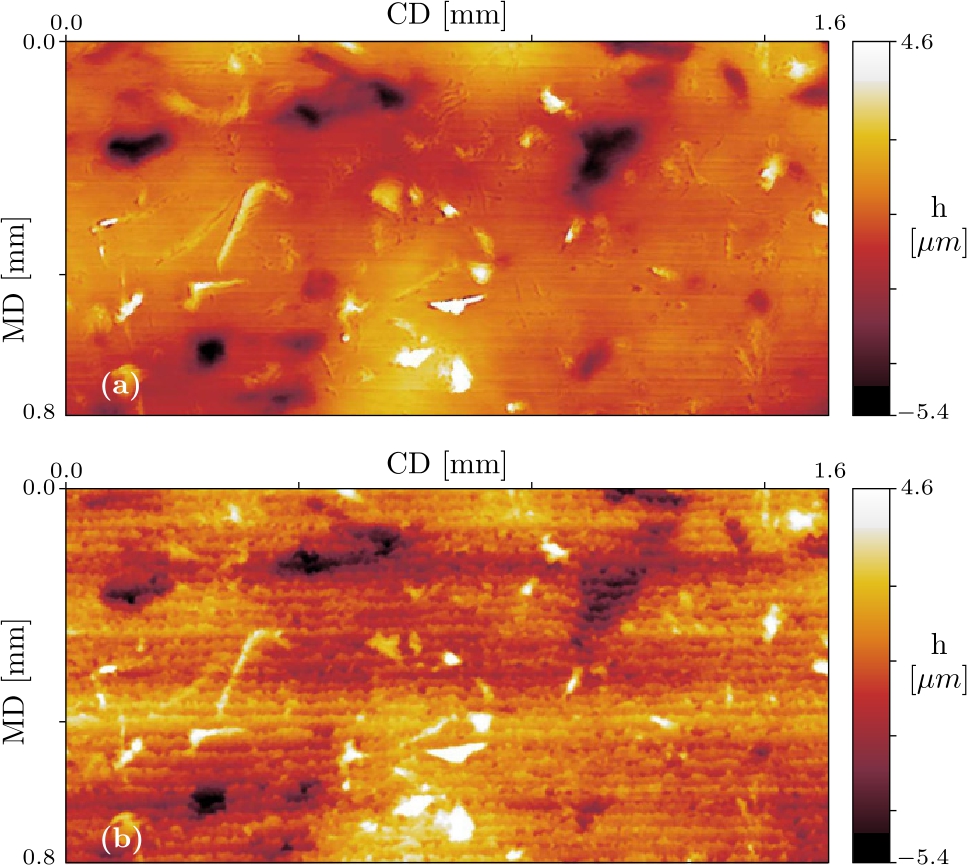
The primary surface resulting from the sample topography measurement using (a) a CCM and (b) a 3D stereo-photogrammetry SEM. An S-filter with a 2.5 µm nesting index was used in the primary and, later, in a second-order polynomial regression to extract the form from the filtered dataset.
Close agreement was found between the topographic datasets obtained from measurements using the two profilometry techniques. While the CCM benefits from the smooth surface of the PE-coated paperboard, allowing accurate measurement of the sample topography, SEM stereo-photogrammetry does not. The image shows that the topography obtained using the SEM stereo-photogrammetry technique suffers from uses artefacts. These artefacts formed on the axis along which the sample stage was tilted during stereo-pair image acquisition. Figure 4(b) is aligned with the CD of the paperboard manufacturing process. The many flat areas encountered on the surface and the low magnification of the SEM images affect the parallax photogrammetry conditions when estimating the disparity map, amplifying the artefact propagation along with the topography. This is a known limitation of photogrammetry techniques (Pouchou et al.2002).
A long-pass filter (L-Filter) with a 250 µm nesting index was applied to the primary surfaces obtained from both datasets, resulting in the bandwidth-matched S-L surface necessary for the statistical validation used during instrument inter-comparison. In total, 128 one-dimensional height profiles along the CD (i. e., horizontal axis) were extracted and averaged. Figure 5 compares the averaged profiles obtained from both measurement techniques. From the curves, in Figure 5, when calculated the normalized root mean square surface roughness of the averaged profiles, it shows that obtained surface roughness from the SEM topography is 6 % greater than that obtained using the reference method.
![Figure 5 A total of 128 averaged profiles from the S-F surface. The profiles were selected across the CD (mm) with topographic average heights h [µm].](/document/doi/10.1515/npprj-2021-0003/asset/graphic/j_npprj-2021-0003_fig_005.jpg)
A total of 128 averaged profiles from the S-F surface. The profiles were selected across the CD (mm) with topographic average heights h [µm].
Finally, Sq was calculated as well as the 1D-PSD in both machine directions on both the S-L surfaces, as shown in Figure 6. From the resulting 1D-PSD, we calculated the surface roughness parameter,
The roughness values from the surface texture, Sq, and the one-dimensional surface roughness,
We conclude that the calculated statistical parameters in both topographic datasets generally agree well. The differences found when comparing the areal parameter Sq and
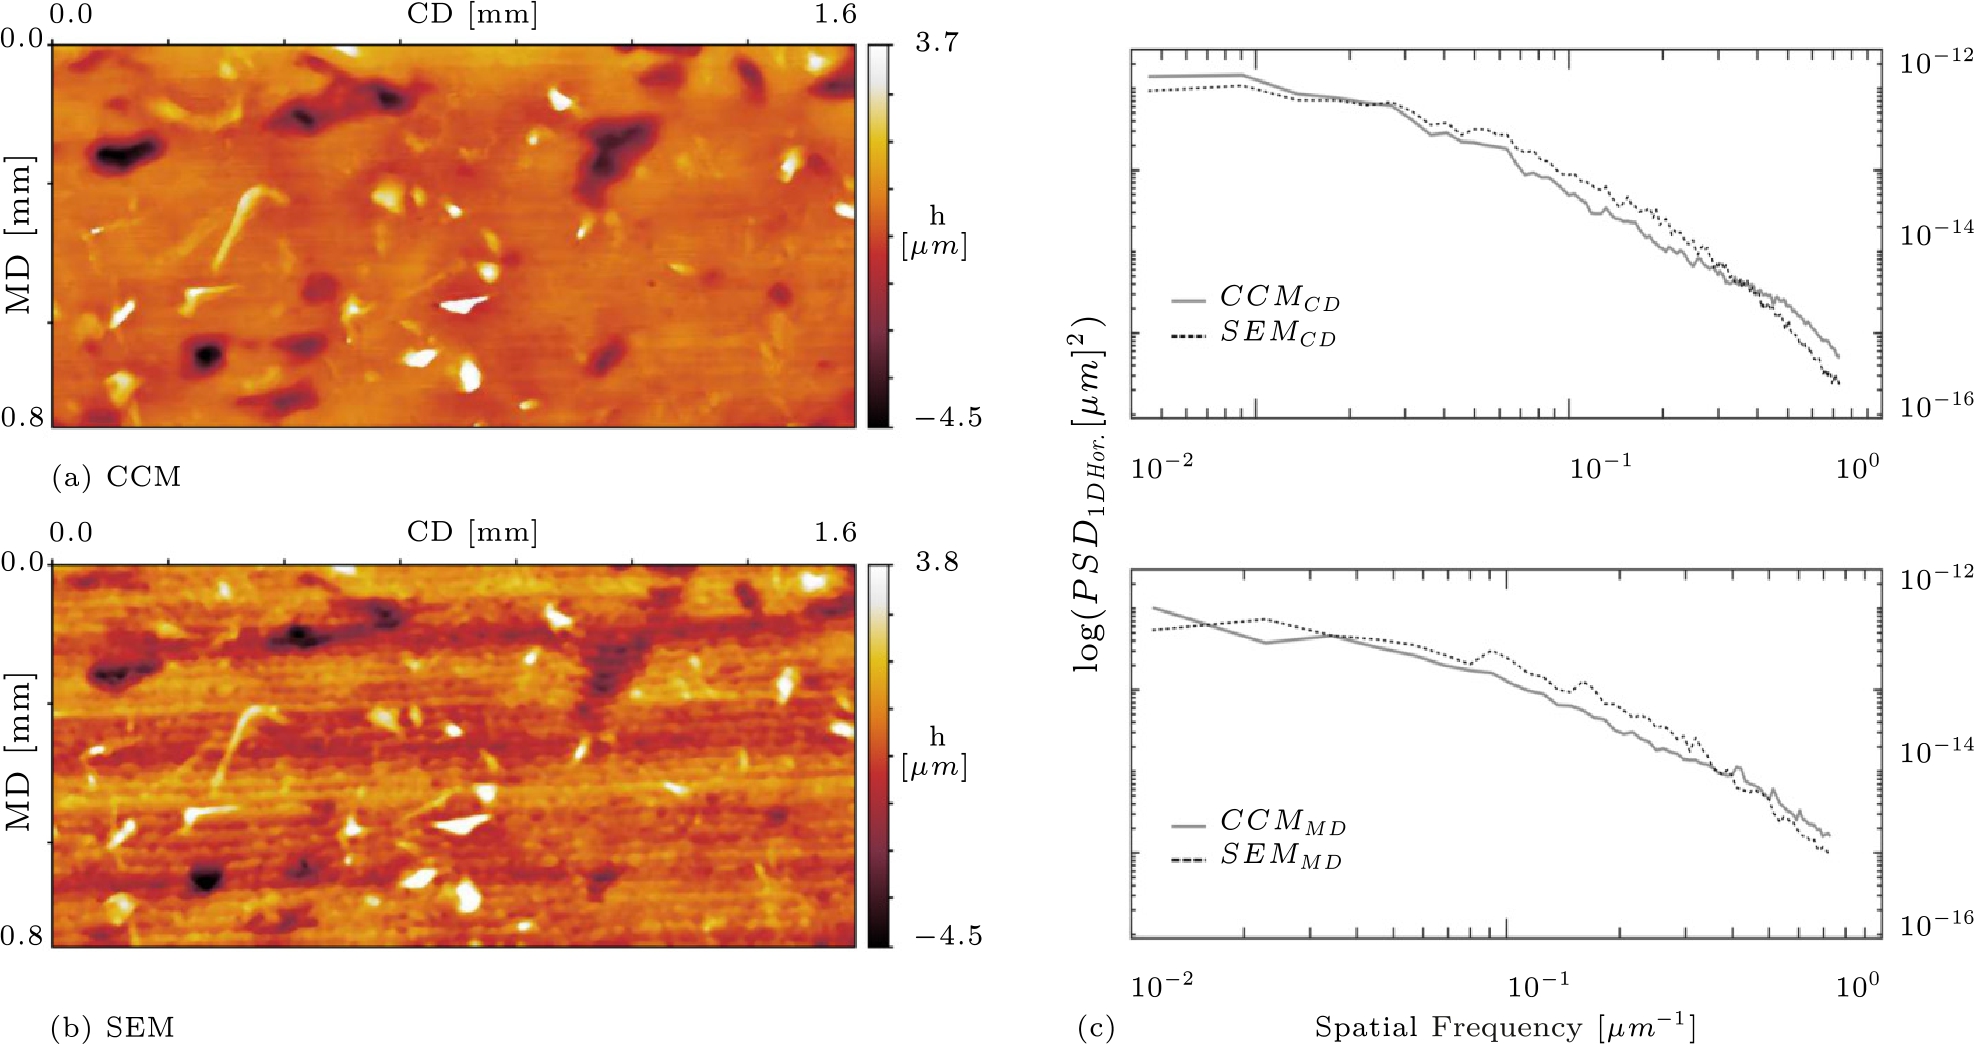
Roughness component of S-L surface obtained from (a) CCM and (b) SEM stereo-photogrammetry topography datasets. PSD was calculated from both topographies (c) in CD and MD to directly compare the orthogonal texture behaviour.
Calculated statistical parameters: Sq from areal topography and
| Sq [µm] | |||
| SEM | 1.07 | 1.05 | 1.14 |
| CCM | 0.97 | 1.11 | 0.94 |
Conclusion
SEM stereo-photogrammetry has been proposed as a profilometry technique for the surface roughness characterization of high-quality PE-coated paperboard. We demonstrated that this imaging tool in combination with the procedure to produce topographic height information can be used as a profilometry instrument in the paper and paperboard industry. In our study, surface roughness measurements from a reference profilometry method, i. e., CCM, were compared with those from the SEM stereo-photogrammetry topography of PE-coated paperboard, with special attention paid to implementing a bandwidth matching strategy, essential for valid instrument inter-comparison. Our results indicate good agreement between both topography datasets, and validation from the reference method indicates that SEM stereo-photogrammetry can be used for the surface roughness characterization of PE-coated paperboard. Despite the small differences on the surface parameter resulted from the artefacts inherent to the photogrammetry technique, affecting the accuracy of the results, the technique’s short acquisition time versus that of the reference method can be a key point in selecting one method over the other. Our study opens up the possibility of investigating the effects of different SEM parameters on the accuracy of the profilometry results. In a future study, we propose comparing different settings based on the SEM’s magnification, tilting angle, and voltage of the beam source, which could lead to improvements in the accuracy of the stereo-photogrammetry technique and compared a larger set of produced paperboard samples, including laminated paperboard composed of pigmented coatings.
Funding statement: This research received no external funding.
Conflict of interest: The authors declare no conflict of interest.
References
Alam, A., Thim, J., Manuilskiy, A., O’Nils, M., Westerlind, C., Lindgren, J., Liden, J. (2011) Investigation of the surface topographical differences between the Cross Direction and the Machine Direction for newspaper and paperboard. Nord. Pulp Pap. Res. J. 26(4):468–475.10.3183/npprj-2011-26-04-p468-475Suche in Google Scholar
Béland, M.-C., Bennett, J.M. (2000) Effect of local microroughness on the gloss uniformity of printed paper surfaces. Appl. Opt. 39(16):2719.10.1364/AO.39.002719Suche in Google Scholar PubMed
Blateyron, F. (2011) Chromatic Confocal Microscopy. In: Optical Measurement of Surface Topography. Springer Berlin Heidelberg, Berlin, Heidelberg. pp. 71–106.10.1007/978-3-642-12012-1_5Suche in Google Scholar
Chinga, G., Johnsen, P.O., Dougherty, R., Berli, E.L., Walter, J. (2007) Quantification of the 3D microstructure of SC surfaces. J. Microsc. 227(3):254–265.10.1111/j.1365-2818.2007.01809.xSuche in Google Scholar PubMed
Dahlström, C., Uesaka, T. (2009) New insights into coating uniformity and base sheet structures. Ind. Eng. Chem. Res. 48(23):10472–10478.10.1021/ie900819cSuche in Google Scholar
Duparré, A., Ferre-Borrull, J., Gliech, S., Notni, G., Steinert, J., Bennett, J.M. (2002) Surface characterization techniques for determining the root-mean-square roughness and power spectral densities of optical components. Appl. Opt. 41(1):154.10.1364/AO.41.000154Suche in Google Scholar
Enomae, T., Onabe, F. (1997) Characteristics of Parker Print-Surf roughness as compared with Bekk smoothness. J. Fiber Sci. Technol. 53(3):86–95.10.2115/fiber.53.86Suche in Google Scholar
Enomae, T., Onabe, F., Usuda, M. (1993) Application of new profilometry using topographic scanning electron microscope to paper surface topography. Tappi J. 76(1):85–90.Suche in Google Scholar
Glon, F., Flys, O., Lööf, P.J., Rosén, B.G. (2014) 3D SEM for surface topography quantification – A case study on dental surfaces. J. Phys. Conf. Ser. 483(1):012026.10.1088/1742-6596/483/1/012026Suche in Google Scholar
Hawkes, P.W., Reimer, L. Scanning Electron Microscopy: Physics of Image Formation and Microanalysis. Springer Series in Optical Sciences. Springer Berlin Heidelberg, 2013.Suche in Google Scholar
Howell, P.G. (1978) The derivation of working formulae for SEM photogrammetry at low instrumental magnifications. Scanning 1(4):230–232.10.1002/sca.4950010403Suche in Google Scholar
ISO 25178-3 (2012) Geometrical product specifications (GPS) – Surface texture: Areal Part 3: Specification operators. International Standards Organization, Geneva, Switzerland.Suche in Google Scholar
Jordan, H.J., Wegner, M., Tiziani, H. (1998) Highly accurate non-contact characterization of engineering surfaces using confocal microscopy. Meas. Sci. Technol. 9(7):1142–1151.10.1088/0957-0233/9/7/023Suche in Google Scholar
Leach, R., Haitjema, H. (2010) Bandwidth characteristics and comparisons of surface texture measuring instruments. Meas. Sci. Technol. 21(3):032001.10.1088/0957-0233/21/3/032001Suche in Google Scholar
Marinello, F., Bariani, P., Savio, E., Horsewell, A., De Chiffre, L. (2008) Critical factors in SEM 3D stereo microscopy. Meas. Sci. Technol. 19(6):065705.10.1088/0957-0233/19/6/065705Suche in Google Scholar
Mettänen, M., Hirn, U. (2015) A comparison of five optical surface topography measurement methods. Tappi J. 14(1):27–38.10.32964/10.32964/TJ14.1.27Suche in Google Scholar
Pouchou, J.L., Boivin, D., Beauchêne, P., Le Besnerais, G., Vignon, F. (2002) 3D reconstruction of rough surfaces by SEM stereo imaging. Mikrochim. Acta 139(1-4):135–144.10.1007/s006040200052Suche in Google Scholar
Vernhes, P., Bloch, J.F., Mercier, C., Blayo, A., Pineaux, B. (2008) Statistical analysis of paper surface microstructure: A multi-scale approach. Appl. Surf. Sci. 254(22):7431–7437.10.1016/j.apsusc.2008.06.023Suche in Google Scholar
© 2021 Brugés Martelo et al., published by De Gruyter
This work is licensed under the Creative Commons Attribution 4.0 International License.
Artikel in diesem Heft
- Frontmatter
- Review
- Aspects on bond strength in sheet structures from TMP and CTMP – a review
- Chemical pulping
- The impact of using different wood qualities and wood species on chips produced using a novel type of pilot drum chipper
- Temperature and effective alkali effect on brown pulp kraft cooking
- Mechanical pulping
- On the modeling of pulp properties in CTMP processes
- Paper technology
- Pulp pumping efficiency I – A critical review on loss and its estimation
- Pulp pumping efficiency II – Designing of a pulp pump
- Three-dimensional scanning electron microscopy used as a profilometer for the surface characterization of polyethylene-coated paperboard
- Paper chemistry
- Ageing mechanisms of the papers with zeolite and PCC fillers
- Synthesis of macro-RAFT agent containing M13-10 and its application in surface sizing agent
- Coating
- The role of MFC and hydrophobically modified ethyl(hydroxyethyl)cellulose in film formation and the barrier properties of methyl nanocellulose film
- Printing
- Fabrication of rosemary essential oil microcapsules and using in active packaging
- Packaging
- Development of a nonwetting coating for packaging substrate surfaces using a novel and easy to implement method
- Recycling
- Wet route pellets production using primary sludge from kraft pulp mill
- Chemical technology/modifications
- Modification of cellulosic filler with diisocyanates – volatile organic compounds emission assessment and stability of chemical structure over time
- Characterization and application of wood-ZrO2 sorbent for simultaneous removal of chromium (III) and chromium (VI) from binary mixture