Application of backpropagation neural network algorithm in e-commerce customer churn prediction
-
Dingjun Zhou


Abstract
In the increasingly dominant consumer market of contemporary e-commerce, it has become urgent for enterprises to have a deeper and more comprehensive understanding of their e-commerce customers. A new method combining the K-means clustering algorithm with a backpropagation neural network has been proposed in the study. Specifically, customer data are first preprocessed through K-means clustering. Then, the initial weight distribution of the data is determined based on the clustering results to optimize the initial weight setting of the backpropagation neural network, thereby accelerating convergence during model training and effectively avoiding the problem of getting stuck in local optima. The results showed that the use of K-means clustering on customer information had a greater impact on the prediction ability of the algorithm model. The Geometric Means (G-means) and F1-values of the prediction model combining K-means clustering and backpropagation neural network were about 15 % and 31 % higher than those of the C4.5 decision tree algorithm, Support Vector Machine (SVM), and Logistic Regression algorithms, respectively. The area under the curve, accuracy, precision, and recall were 0.045, 0.037, 0.042, and 0.021 higher than those of backpropagation neural networks, respectively. The experimental results meet expectations, indicating that the proposed model is suitable for predicting customer churn in e-commerce.
1 Introduction
In the contemporary era, characterized by rapid advancements in information and communication technologies, the e-commerce market has emerged as a dominant force in the consumer landscape [1]. With the rapid development of e-commerce, customer churn has become increasingly prominent and has become one of the core issues that enterprises urgently need to address [2]. Customer churn directly affects a company’s revenue and market share, and may also have a negative impact on brand reputation [3]. Therefore, how to effectively predict and prevent customer churn has become a hot topic of concern in both academia and industry. At present, research methods for predicting customer churn mainly include statistical analysis, machine learning, and deep learning [4].
However, the existing customer churn prediction models often cannot handle high-dimensional and non-linear data, making it difficult to adapt to the complex and ever-changing consumption data structure of e-commerce. These models often overlook the uncertainty of customer behavior, leading to limited accuracy and reliability of prediction results. In addition, traditional methods such as the C4.5 decision tree algorithm, Support Vector Machine (SVM), and Logistic Regression algorithms are not ideal for handling the sensitivity of outliers and interference from noisy data. To overcome the above limitations, the Backpropagation (BP) neural network is introduced in the study, aiming to construct an efficient E-Commerce Customer Churn Prediction (ECCP) model. BP neural network, with its powerful nonlinear mapping ability and adaptive learning ability, can better capture complex relationships in customer behavior patterns, providing more accurate analysis tools for customer churn prediction. However, a single BP neural network may face some challenges in practical applications, including slow convergence speed during training and the problem of easily getting stuck in local optima. These issues are particularly prominent when dealing with large and complex e-commerce data, leading to a decline in model performance and prediction accuracy [5].
To optimize the performance of BP, this study proposes to combine the K-means clustering algorithm with it. Firstly, K-means is used to perform clustering preprocessing on customer data, and the initial weight distribution of the data is determined based on the clustering results to optimize the initial weight setting of BP, thereby accelerating convergence during model training and effectively avoiding getting stuck in local optima. This method ensures that BP can learn and adapt to complex patterns in data more quickly, improving prediction accuracy and stability.
The innovation of the research lies in optimizing the performance of the customer churn prediction model by combining the K-means clustering algorithm with the BP neural network. K-means clustering is used for preprocessing customer data, initializing the weight distribution of the BP neural network through clustering results, which can overcome the problems of getting stuck in local optima and slow convergence speed during BP training. This integrated method improves the prediction accuracy and stability of the model, and has strong adaptability and generalization ability, providing a more effective solution for predicting customer churn in e-commerce.
The contribution of the research is mainly reflected in two aspects: theoretical innovation and practical application. In theory, the research expands the application of BP in customer churn prediction. By combining the K-means clustering algorithm with BP, the study enriches the research paradigm of algorithm integration and provides a new method to optimize the initial weight distribution of BP. This innovation lies in using the results of K-means clustering to guide the training process of BP, thereby improving the convergence speed and global optimality of the model. This method effectively solves the problems of traditional BP being prone to local optima and slow convergence speed, providing a more flexible and powerful tool for predicting customer churn.
In practical applications, the proposed method can provide e-commerce enterprises with more accurate and practical customer churn warning tools. By accurately predicting the risk of customer churn, enterprises can take targeted measures promptly, such as personalized marketing, customer care, and service improvement, thereby effectively reducing customer churn rates. At the same time, accurate churn prediction can also help companies optimize resource allocation, focus on retaining high-risk customers, and further enhance customer satisfaction and loyalty. This increases the company’s revenue and market competitiveness, and promotes long-term stability and development of customer relationships. In summary, the dual contributions of theoretical innovation and practical application in research provide new directions and tools for predicting customer churn, which has important practical significance for e-commerce enterprises.
2 Related work
Melian et al. [6] believed that the key to studying intelligent prediction of customer churn is to conduct a clear evaluation of customers. They developed an effective predictive model that can detect early warning signals when customer churn occurs and assign a ‘churn score’ to each customer. They attempted to analyze churn behavior using a large sample of customers from a telecommunications company, and the results were good. Panjasuchat et al. [7] believed that the difficulty of customer churn lies in the fact that customer behavior is uncontrollable and can change at any time, which can also lead to changes in data. Therefore, they proposed applying reinforcement learning techniques to customer churn prediction. The method was to select a customer churn dataset for classification tasks for learning, and simulate different distributed datasets through random sampling for experiments. The active learning model proposed in the study outperformed other classifiers in terms of accuracy, precision, recall, and F1-value. Amin et al. [8] proposed a new customer churn prediction method based on the concept of deterministic estimation using a distance factor classifier to divide the dataset into different regions. This method was used to predict customer churn and non-churn behavior with high and low certainty. The use of different excellent evaluation metrics (such as accuracy, f-measure, precision, and recall) for classifiers on different publicly available Telecommunications Industry (TCI) datasets showed that classifiers with high certainty data were more accurate.
Zhao et al. [9] used the Logistic Regression (Logistic) algorithm to build a customer churn prediction model and proposed a highly targeted win-back strategy. They analyzed the trend and reasons for customer churn through data mining algorithms, and answered questions about how customer churn occurs, the influencing factors of customer churn, and how companies win and lose customers. The results of the study helped the TCI to identify high-risk churned customers in advance, improve customer loyalty and stickiness, maintain “high-value” customers, continue to provide “value” to customers, and reduce the cost of maintaining customers. Amatare et al. [10] proposed a Convolutional Neural Network (CNN) model to predict TCI’s customer churn, eliminating the problem of human attribute selection. They also developed three other models, namely two Multi-Layer Perceptron (MLP) models and one CNN model. The research results indicated that the accuracy of the MLP1 and MLP2 models was 80 % and 81 %, respectively. The accuracy of the CNN model was 89 %. BP neural networks have been widely applied in various scientific fields in recent years due to their powerful functions. Many scholars have conducted research and discussions on it, and have also achieved fruitful research results. Li et al. [11] proposed an intelligent financial data mining and prediction model based on deep learning in response to the increasingly serious financial risks faced by enterprises in the market-oriented and internationalized economic environment. This model preprocesses the original financial data through data mining technology, significantly reducing human and time consumption. It also uses deep learning algorithms to identify potential financial risks, providing timely risk warnings and response strategies. The research results show that this model outperforms traditional models in predicting the accuracy of enterprise financial risks, effectively enhancing the intelligent level and decision-making efficiency of enterprise financial management.
Ling et al. [12] constructed a BP neural network-based accident source term backtracking model to quickly and accurately predict and evaluate the consequences of accidents. They introduced the Genetic Algorithm (GA) to optimize the weights and thresholds of the BP neural network to address its tendency to fall into local minima during training. Finally, simulation experiments were conducted. The results showed that the average relative error of the training and testing sample sets was less than 2 %, which improved the speed and accuracy of source term inversion. Chen et al. [13] proposed a non-destructive diagnosis method for total nitrogen content in Ailanthus altissima canopy leaves based on multiple features and an improved BP neural network. This method obtained image features of the leaves through digital image processing technology and selected four main component factors as input factors for the BP neural network. The experiment showed that this method could obtain more comprehensive and accurate experimental results, and the proposed method had higher reliability. Samantaray and Sahoo [14] used the BP neural network to establish a model to predict the relationship between rainfall and runoff, and selected the mean square error for training and testing. The performance of the model was evaluated using indicators such as root mean square error and coefficient of determination. The experimental results showed that the BP neural network was suitable for runoff assessment, and the model was helpful for planning, arranging, and managing the water conservancy structure of the watershed. Zhang et al. [15] proposed an improved backpropagation neural network method for the performance evaluation of enterprise employees to optimize the performance evaluation indicators. The evaluation was conducted from three dimensions: achievement, ability and attitude, achieving a high accuracy rate of 96.21 %, far exceeding support vector machines and standard BPNN, and having significant practical application value.
In summary, various methods such as Logistic, CNN, and MLP have been used in existing customer churn prediction. These methods have achieved significant results to some extent, especially in handling linear relationships and simple data structures. However, when faced with high-dimensional and nonlinear data, these traditional methods show significant shortcomings. Specifically, when dealing with complex data relationships and dynamically changing customer behavior patterns, it is often difficult to capture deep-level features in the data. In addition, these methods have limited ability to handle outliers and noisy data, which affects the accuracy and robustness of model predictions. Some models are prone to getting stuck in local optima during the training process, further limiting their application effectiveness. In contrast, the study utilizes the results of K-means clustering to properly initialize the initial weights of BP, improving the convergence speed and global optimality of the BP training process. Through this method, BP can converge to the optimal solution faster, avoiding the common problem of local optima in traditional methods. In addition, the preprocessing steps of K-means clustering also help improve the adaptability of the model to high-dimensional and complex data structures, enabling it to more accurately capture complex patterns and trends in customer behavior. The proposed method can significantly improve the accuracy and stability of prediction, making it perform better in handling large-scale, multidimensional, and nonlinear data. Therefore, this study combines a BP neural network algorithm and an optimized K-means clustering algorithm for ECCP, which has a certain promotional effect on the research of e-commerce customer churn.
3 Construction of ECCP model based on BP neural network algorithm
This section delves into the application of the BP neural network algorithm in predicting customer churn in e-commerce. Firstly, the specific implementation method of using a BP neural network for customer churn risk assessment is discussed. Then, the BP network is improved by integrating the K-means clustering algorithm to optimize the prediction model. This section aims to improve the prediction accuracy and application value of the model through algorithm combination and improvement.
3.1 Application of BP neural network in predicting customer loss in e-commerce
In e-commerce environments, customer churn prediction continues to be a central concern, as accurately predicting and effectively recovering potentially lost customers can bring significant economic benefits to an organization [16], [17], [18]. The BP algorithm, as a classical neural network training technique, has been widely used in this field. First of all, in e-commerce scenarios, customer data is rich and complex, including transaction history, browsing behavior, user feedback, and personal information. Integrating and cleaning these data is the initial step to provide suitable inputs for the neural network [19], 20]. Next, feature engineering methods are used to extract, transform, and select meaningful features from the raw data for predicting customer churn. The characteristics consist of three categories: behavioral characteristics, account characteristics, and situational characteristics. Behavioral characteristics include recent purchase intervals, purchase frequency, cumulative consumption amount, average browsing time, page visit depth, and customer service interaction times. Recent purchase intervals, purchase frequency, and cumulative consumption amount are used to reflect customer activity and value, while average browsing time, page visit depth, and customer service interaction times can reflect customer engagement. Account features include membership level, registration duration, automatic renewal status, diversity of payment methods, frequency of coupon usage, etc. The cost of losing high-level members is higher, and non-automatic renewal customers need to pay special attention. Diversity of payment methods and frequency of coupon usage are proxy variables for payment convenience and price sensitivity. The situational characteristics include the discount rate of the most recent purchase, the number of order cancellations, and the number of logistics delays, which can reflect the impact of service quality on customer satisfaction.
These features are used as inputs to the neural network, and the customer churn status is used as output. After several iterations of training, the BP algorithm gradually adjusts the weights of the neural network to achieve the best prediction on the training data. Once the model has been trained and validated as effective, it can be used to predict customers who may churn in the future and help organizations adopt practical retention strategies. The structure of the BP neural network algorithm is shown in Figure 1.

Structure diagram of BP neural network algorithm.
In Figure 1, x 1, x 2, …, x n represent the feature input nodes of the neural network, corresponding to the preprocessed customer feature data, including behavioral features (recent purchase interval, purchase frequency, average browsing time, etc.), account features (membership level, registration duration, diversity of payment methods, etc.), and situational features (recent discount rate, number of order cancellations, etc.). h 1, h 2, …, h n serve as the core computing unit, representing nonlinear combination and transformation of input features. It is mainly used to capture complex relationships between features and provide high-order representations for the output layer. y 1, y 2, …, y n indicate the prediction results of customer churn. The neural network structure mainly consists of three layers: input, hidden, and output. The input layer is mainly responsible for receiving and transmitting the information signal to the hidden layer. The hidden layer is mainly responsible for processing information, including forward and backward processing, and passing the processed information signal to the output layer after processing is completed. The output layer is mainly responsible for interfacing with the external interface and outputting the result information.
In the BP neural network algorithm, there are two aspects of forward and reverse transmission, which are the forward transmission of signal information and the reverse transmission of error information [21], 22]. During forward transmission, the information signal enters from the input layer, undergoes hidden layer processing, and is finally output from the output layer. During reverse transmission, the error signal is transmitted from the output layer to the hidden layer [23]. After being processed by the hidden layer, the weight parameters from the hidden layer to the output layer and from the input layer to the hidden layer are adjusted according to the processing results [24], 25]. Without considering special influences, the most direct linear weighting is used to value the net input value of the output neuron N in , as shown in equation (1).
In equation (1), l represents the number of features. The topology of the neuron is shown in Figure 2.

Topological structure of neurons.
In Figure 2, θ i is used to represent the threshold of reception of a neuron, which is activated when the transmitted neural signal reaches the threshold criterion. Comparing N in with θ i , the activation function is then used to judge the data for the purpose of controlling the output. The activation function is a range constraint function, usually using the Sigmod function. The Sigmod function converts the input signal value to a value in the interval [0, 1]. When the constraint range does not exist, the output value is controlled using the linear activation function, as shown in equation (2).
In equation (2), y j represents the output and f() represents the activation function. By fixing the first input value as x i and the weight value as w i , equation (2) can be simplified, and the output equation is shown in equation (3).
In equation (3), the study fixes an additional input x
0 = 1, that is, adds an input node with a value of 1, and sets its corresponding weight w
j0 as the bias term of neuron j. In this way, the net input of the neuron is
In equation (5),
In equation (6), ΔParam represents the change of parameter. The weights between the implied layer and the output layer are adjusted according to equation (6), as shown in equation (7).
In equation (7),
The functional properties of Sigmod is applied as shown in equation (9).
Combining the above equations, the weight adjustment scheme is derived as shown in equations (10) and (11).
The adjustment scheme of the weights between the input layer and the implied layer can be derived from equations (10) and (11), as shown in equation (12).
The solution e h of equation (12) is shown in equation (13).
From the learning process of BP neural network, a change of one v weight will cause a change of all β values. A BP neural network is trained to reduce the error value through continuous learning, and a termination signal is set to end this process. The termination signal is generally a reasonable error value, which is set according to the actual usage requirements. When the error value reaches the termination target, the recursion stops, the model reaches the optimal solution, and the training results are output. The BP algorithm can adaptively learn and capture complex relationships and patterns in e-commerce data [26], 27]. This self-adaptive capability is particularly suitable for dealing with variable and multidimensional customer behavior data in the e-commerce domain. Compared with traditional linear methods, BP algorithms can better handle nonlinear relationships and ensure the accuracy and robustness of predictions [28], 29]. In addition, the multi-layer structure of BP neural networks allows it to dig deeper into the deeper features in the data, thus providing a richer and more nuanced perspective in churn prediction. With the development of big data technology and computing power, BP algorithms can easily handle large amounts of customer data and provide real-time or near-real-time predictions, helping organizations to take quick action to reduce churn and thus gain an edge in the competitive marketplace [30], 31].
The structure of BP neural networks usually includes input layers, several hidden layers, and output layers. The number of input layer nodes corresponds to the feature dimension, the number of hidden layer nodes is adjusted according to experiments, and the number of output layer nodes matches the predicted target dimension. The Sigmoid activation function is suitable for hidden layers, and its output is suitable for interpreting as probability, especially for binary classification problems. Hyperparameters, such as learning rate, number of iterations, and number of hidden layer nodes, are precisely selected through techniques such as cross-validation to ensure the model’s generalization ability and avoid overfitting. The regularization techniques, L1 and L2 penalties, are also used to suppress model complexity. L1 regularization involves adding the sum of the absolute values of the weight parameters to the loss function, tending to compress some weights to 0 to automatically achieve feature selection. L2 regularization involves adding the sum of squares of weight parameters to the loss function, making the weights tend towards smaller non-zero values, smoothing the weight distribution, and alleviating the problem of multicollinearity. These strategies work together to improve the performance of the model on new data, which is the key to building an efficient and robust BP neural network.
3.2 Optimized customer churn prediction model based on K-means clustering improvement algorithm
In the e-commerce environment, due to the complexity and variability of customer behavior, traditional BP has certain limitations in predicting customer churn. It mainly manifests in poor performance in handling high-dimensional and nonlinear data, sensitivity to outliers and noisy data, and a tendency to fall into local optima during training. These issues limit the prediction accuracy and stability of the model. To overcome these limitations, K-means is introduced as an optimization method in the study. K-means, as an unsupervised learning algorithm, excels at quickly discovering the intrinsic structure and patterns of large-scale data. Its clustering results can serve as prior knowledge for BP neural networks, providing a more reasonable distribution of initial weights for the network. As a supervised learning algorithm, the BP neural network has strong nonlinear mapping ability and can further explore complex relationships in data. The combination of the two solves the problems of slow convergence and local optima caused by the randomness of initial weights in BP, and fully utilizes the dimensionality reduction and noise filtering capabilities of K-means for high-dimensional data, making the model more efficient and accurate in processing high-dimensional nonlinear data.
K-means clustering optimizes feature input by dividing data points into multiple groups with similar features, thereby enhancing the accuracy of the model in identifying potential consumer behavior patterns. K-means, with its simplicity and efficiency, is particularly suitable for large-scale datasets and can effectively reduce the impact of noise and outliers. By using clustering analysis to identify the characteristics and behavioral trends of different customer groups, K-means provides BP neural networks with more purified and strongly correlated data, thereby enhancing the network’s learning ability and predictive stability. To enhance the accuracy of BP-based algorithms in ECCP, it is necessary to consider the specificity of the e-commerce environment and further customize the optimization for the customer dataset. By adopting a clustering analysis strategy for deep adjustment of the processed dataset, the correlation and representativeness of the samples can be significantly enhanced, thereby reducing the noise components in the data and avoiding overfitting during model training. This study uses K-means clustering as a preprocessing module for the customer churn prediction model that enters the dataset of the model to achieve this process. The dataset is assumed to be
Then, the representation of the clustering center is shown in equation (15).
K-means iteratively classifies and converges on samples based on a predetermined number of clusters, resulting in multiple categories of data samples. The distance between categories is large, while the distance between samples within categories is small. Traditional K-means clustering has the problem of large randomness and easy to fall into a local optimum. K-means++ is used to select cluster centers, selecting K + m objects that are relatively far apart as initial cluster centers. This optimization can effectively solve the problem of high randomness in the initial clustering centers. The clustering centers are updated using the method of K-medoids to select the median of the samples, as shown in equation (16).
In equation (16), P denotes a sample point in the space and O l denotes the centroid of the cluster C l . The traditional K-means for updating the cluster centers is to use the square value calculation. Replacing this calculation with the absolute value can weaken the influence of outliers that may exist in the clusters and avoid the results from falling into local optimal solutions. Finally, stability adjustments are made to the clusters by relocating the central clusters to K and selecting new cluster centers, i.e., the pre-clusters are used as the initial clusters. The flow of the optimized and improved K-means clustering optimization algorithm is shown in Figure 3.
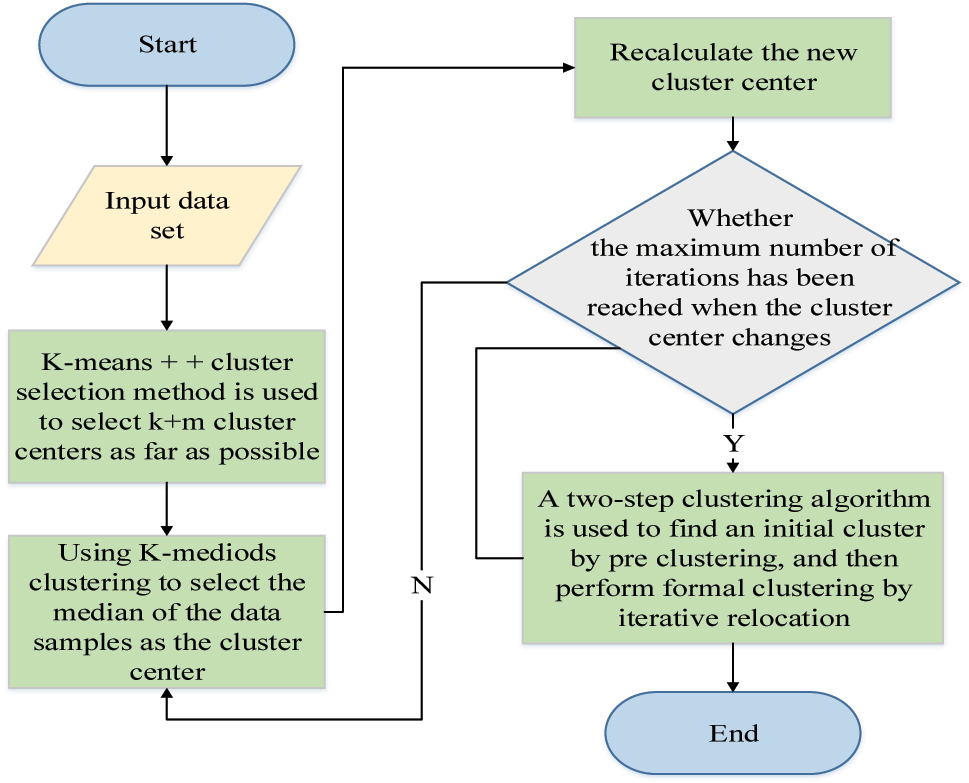
Flow chart of optimization algorithm based on K-means clustering.
As shown in Figure 3, the optimized K-means algorithm model first enters the data and then performs the initial selection with the initial cluster center selection method of K-means++ clustering, and a total of K + m data are selected. Then, the clustering center update method of K-medoids is used to continuously update the clustering centers until K + m initial clustering centers are selected. When all initial cluster centers are selected, a median is calculated, and the corresponding objects are assigned to the corresponding clusters and the method is repeated until the objective function value no longer changes. The above output is used as the initial condition for new clustering, and a new clustering operation is performed until K clustering centers are selected. The optimized method avoids the problem that the traditional K-means clustering method is highly influenced by the initial values and easily falls into local optimal solutions. The processing of the dataset using this method requires first normalizing the dataset, as shown in equation (17).
The normalized processed data are in the same range, which is convenient for processing. Then, the data are processed for features. Feature processing is the key to analyzing customer needs, and judging customer information according to the importance of feature information is the core basis for prediction. Some customer feature attributes are shown in Table 1.
Abbreviations and meanings of some customer characteristics.
| Feature name | Characteristic meaning |
|---|---|
| Transaction_date | Customer transaction date |
| Membership_expire_date | Customer due date |
| Registered_via | Customer registration method |
| Shopped_date | Customer shopping date |
| Registration_init_time | Customer registration time |
| Expiration_date | Customer deadline |
| Payment_method_id | Customer payment method |
| Plan_list_price | Planned payment price |
| Total_secs | Customer browsing duration |
| Payment_plan_days | Planned payment duration |
| Is_auto_renew | Automatic renewal |
| Actual_amount_paid | Actual paid price |
According to the analysis of multiple characteristic attributes and clustering data of customers, there are four typical customer groups, namely enterprise customers (K1), demand customers (K2), potential customers (K3), and value sensitive customers (K4). Their value attributes and churn risks are shown in Figure 4.

Customer segmentation matrix.
In Figure 4, demand customers belong to customers with high churn risk and are the focus of customer churn research. Secondly, value-sensitive customers have a higher risk of churn. Enterprise customers and potential customers have relatively low churn risk, but it does not mean that they will not churn. The prediction of this type of customer should instead be studied with higher standards in order to observe the accuracy of the algorithm. After data processing is completed, it enters the churn prediction stage. The overall framework of the complete ECCP model constructed by combining the BP neural network algorithm model is shown in Figure 5.
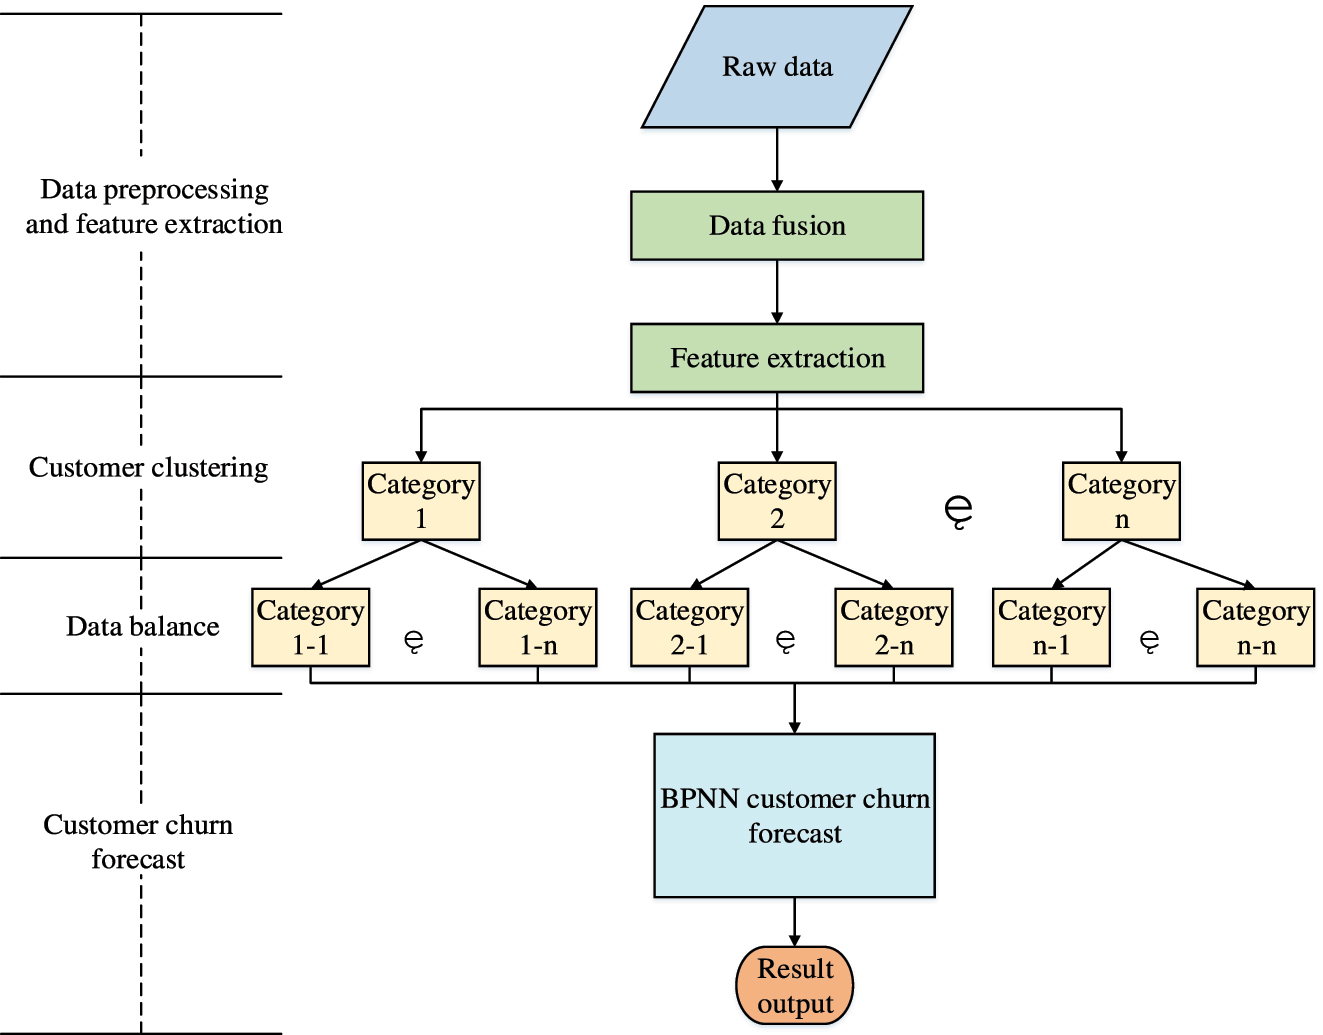
Prediction model of e-commerce customer churn based on BP neural network.
In Figure 5, the ECCP model based on BP algorithm first preprocesses customer data, including data cleaning, transformation, and normalization, to extract customer features and prepare for model training. The data preprocessing process includes the following steps: firstly, data cleaning is performed, including handling missing values and detecting outliers; Median interpolation is used to fill continuous features such as transaction date and purchase frequency; Z-score method is used to identify outliers in continuous features such as transaction amount and browsing time, and Winsorization method is used to scale them to a reasonable range to avoid the interference of extreme values on the model. Then, data conversion is performed on multiple classification features such as payment methods and registration channels. Single-hot encoding is used to generate dummy variables to ensure that the model correctly identifies non-ordered category differences. For ordered classification features such as membership levels, label encoding is used to retain level order information. Finally, data normalization is performed by using minimum maximum scaling to normalize the data to the [0, 1] interval, to reduce the impact of differences between features on the model. After preprocessing, the optimized K-means algorithm model is used to cluster the customers, and the clustered customers are processed for data balancing. The dataset is used to train the K-means-optimized BP neural network (K-BPNN), and independent datasets are used to evaluate the predictive ability of the model. Finally, customer information from real business scenarios is input into the BP ECCP model to make the final prediction of e-commerce customer churn and output the results, while continuously monitoring its performance.
4 Experiment and analysis of ECCP model based on BP neural network algorithm
The study is conducted in a hardware environment equipped with an Intel Core i7-4770 processor, 16 GB of RAM, 512 GB of solid-state memory, NVIDIA GTX 1060 graphics processor, and Windows 10, using Python 3.7 and MATLAB R2022a for experiments. All datasets are obtained through the official University of CaliforniaIrvine (UCI) website and loaded and preprocessed using data analysis libraries in programming languages such as Python. The UCl dataset (https://archive.ics.uci.edu/ml/index.php) is a widely used public dataset in machine learning, provided by the University of California, Irvine. It contains various types of datasets, such as classification, clustering, regression, etc., which cover multiple application fields such as finance, healthcare, biology, meteorology, etc. Each dataset is accompanied by detailed metadata, including data sources, variable descriptions, and other data background information that is helpful for understanding and application. These datasets are used to support academic research and educational purposes, facilitating researchers and students to test and compare their algorithms in an unrestricted environment. All experiments are conducted under the same hardware conditions. The experimental results are evaluated using the ten-fold cross-check method, i.e., the average value of 10 test results is taken as the evaluation result. Three standard datasets of UCI, yeast, pima and, glass are selected.
The BP-based ECCP model is compared with three other common customer churn prediction models, namely C4.5, Logistic, and SVM. The standard datasets provided by the UCI machine learning library include yeast, Pima Indians diabetes, and Glass Identification datasets. The yeast dataset consists of 1,484 samples with 8 attributes, including biologically relevant features, used for predicting protein localization classification. The Pima dataset contains 768 samples, including 8 medical diagnostic features, which are used to predict diabetes. The Glass dataset contains 214 samples with 9 attributes, aiming to classify different types of glass through component analysis. The dataset can be obtained through the UCI official website and loaded and preprocessed using data analysis libraries in programming languages such as Python and R. Specificity, Sensitivity, Accuracy, Precision, G-mean, and F1-value are used as evaluation metrics. The above-mentioned dataset is essentially the same as customer churn prediction in machine learning problems. Their common core is the classification problem, especially the binary classification problem (for example, diabetes: Yes/No; customer churn: yes/no). UCI datasets are the “standard test questions” in the field of machine learning and are widely used by researchers around the world. The results of comparisons made on such a platform are comparable and reliable. Secondly, these datasets can also verify the generalization ability of the model and focus the research on the effectiveness of the method itself rather than the characteristics of specific data.
The Area Under the Curve (AUC) evaluates binary classification models, which represent the area under the Receiver Operating Characteristic (ROC), and is used to measure the classifier’s ability to distinguish between positive and negative classes. The ROC curve is one of the commonly used tools for evaluating the performance of binary classification models. It displays the performance of the model under different classification conditions through different threshold settings. The ROC curve, with False Positive Rate (FPR) as the horizontal axis and True Positive Rate (TPR) as the vertical axis, can comprehensively evaluate the classification ability of the model. The ROC curve plots the true class rate and false positive class rate at different thresholds. The closer the AUC is to 1, the better the classification performance. Accuracy is the most intuitive performance metric, calculated by dividing the number of correctly classified samples by the total number of samples. However, in imbalanced datasets, accuracy may give overly optimistic predictive performance. Precision focuses on the proportion of predicted positive samples that are actually positive, calculated by dividing the number of true samples by the total number of predicted positive samples. In customer churn prediction, accuracy indicates how many customers predicted to be churned are actually churned. Recall rate or TPR, which focuses on the proportion of correctly identified positive cases among all actual positive cases, is calculated by dividing the number of true cases by the total number of actual positive cases. The recall rate is particularly important in customer churn prediction, as it measures how many of the truly lost customers are predicted by the model. The obtained results are shown in Figure 6.
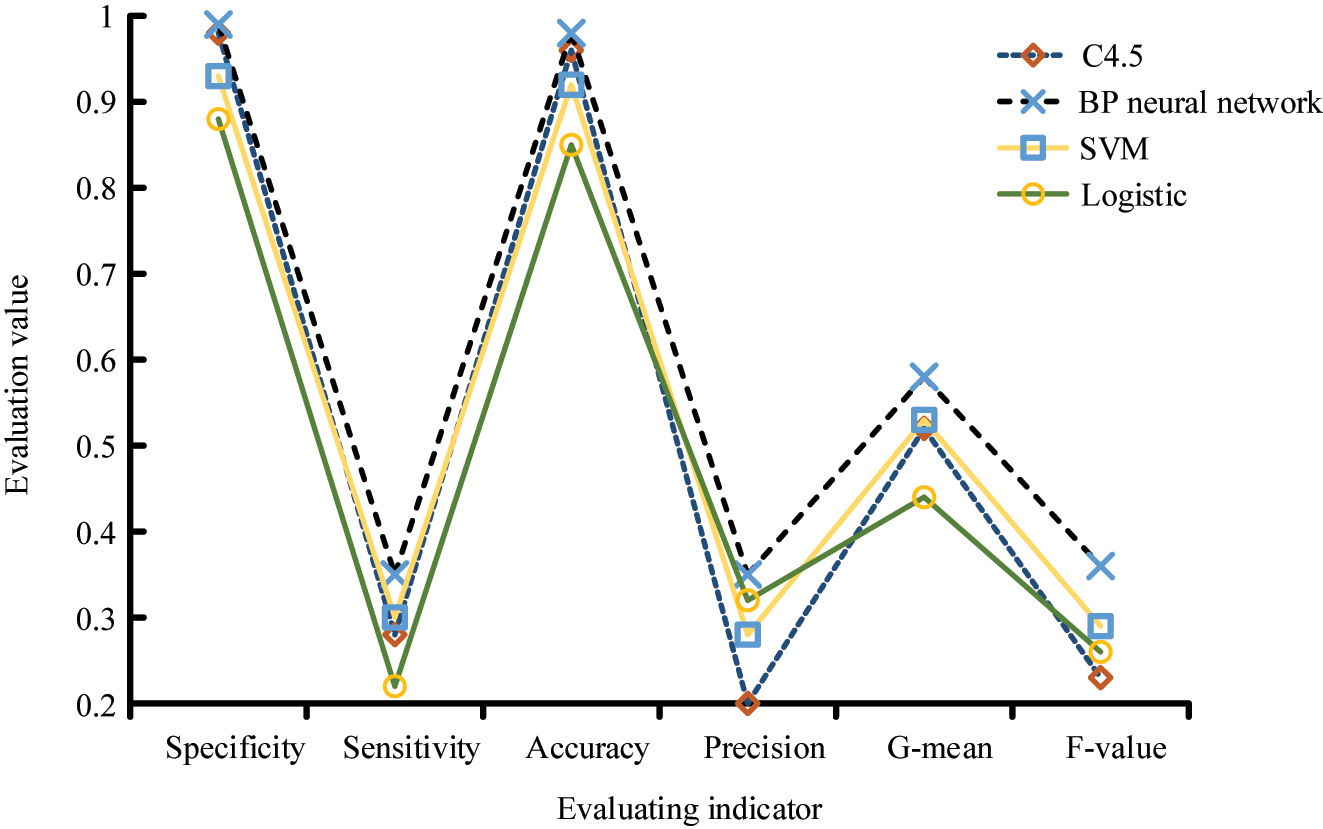
Comparison results of different evaluation indexes of four algorithms.
From Figure 6, the algorithms have better performance in terms of specificity and accuracy evaluation, among which the best performance is the BP model, followed by the C4.5 model. The SVM model and the Logistic model have relatively poor performance. In terms of the G-means index and F1-value index, the performance of each algorithm is less satisfactory. The BP model still performs the best among the four algorithms, followed by SVM, the C4.5 model, and the Logistic model perform the worst. The poor performance in the evaluation of the G-means index and the F1-value index does not mean that the algorithms cannot make good predictions of customer churn, but there are some problems in the processing of customer information. As the number of customers increases, their characteristics also become more diverse, leading to significant differences in algorithm classification of customers. Secondly, during the training of classifiers for each algorithm, certain customer information is constantly ignored, resulting in biased final prediction results. To observe this judgment, the optimized K-means model is matched with each algorithm to provide them with customer classification services, and the evaluation results of G-means metrics and F1-value metrics are re-observed. Among them, G-means is the geometric mean of sensitivity and specificity used to evaluate the performance of imbalanced data classification. The F1-value is the harmonic mean of accuracy and recall, used to evaluate the performance of a classification model, as shown in Table 2.
Evaluation results of G-means index and F1-value index after customer classification of each algorithm model.
| Model | Customer group | G-mean | F1-value |
|---|---|---|---|
| C4.5 | K1 | 0.52 | 0.3 |
| K2 | 0.75 | 0.44 | |
| K3 | 0.51 | 0.3 | |
| K4 | 0.74 | 0.44 | |
| BP neural network | K1 | 0.62 | 0.4 |
| K2 | 0.84 | 0.56 | |
| K3 | 0.61 | 0.4 | |
| K4 | 0.85 | 0.56 | |
| SVM | K1 | 0.52 | 0.3 |
| K2 | 0.73 | 0.38 | |
| K3 | 0.51 | 0.3 | |
| K4 | 0.78 | 0.4 | |
| Logistic | K1 | 0.5 | 0.3 |
| K2 | 0.61 | 0.44 | |
| K3 | 0.49 | 0.3 | |
| K4 | 0.66 | 0.43 |
In Table 2, after the classification of optimized K-means models, the evaluation results of each model in the G-means index and F1-value index are improved. This indicates that K-means optimization has a facilitating effect on customer churn prediction, which is in line with experimental expectations. After customer classification, the best-performing prediction model is the BP neural network, which is higher than other algorithms in all four customer classifications. The G-mean and F1-value ratings of K1 customers are about 19 % and 33 % higher than those of other algorithms. The G-mean and F1-value ratings of K2 customers are about 12 % and 27 % higher than those of other algorithms. The G-mean scores of K3 and K4 customers are about 20 % and 9 % higher than those of other algorithms, while the F1-value scores are about 33 % and 30 % higher than those of other algorithms. In summary, the G-mean score is about 15 % higher than that of other algorithms, and the F1-value score is about 31 % higher than those of other algorithms. The experimental results show that the K-BPNN model can accomplish the prediction task well, and its prediction performance is better than that of other prediction models. The results obtained by continuing to compare the ROC curves of various algorithms are shown in Figure 7.
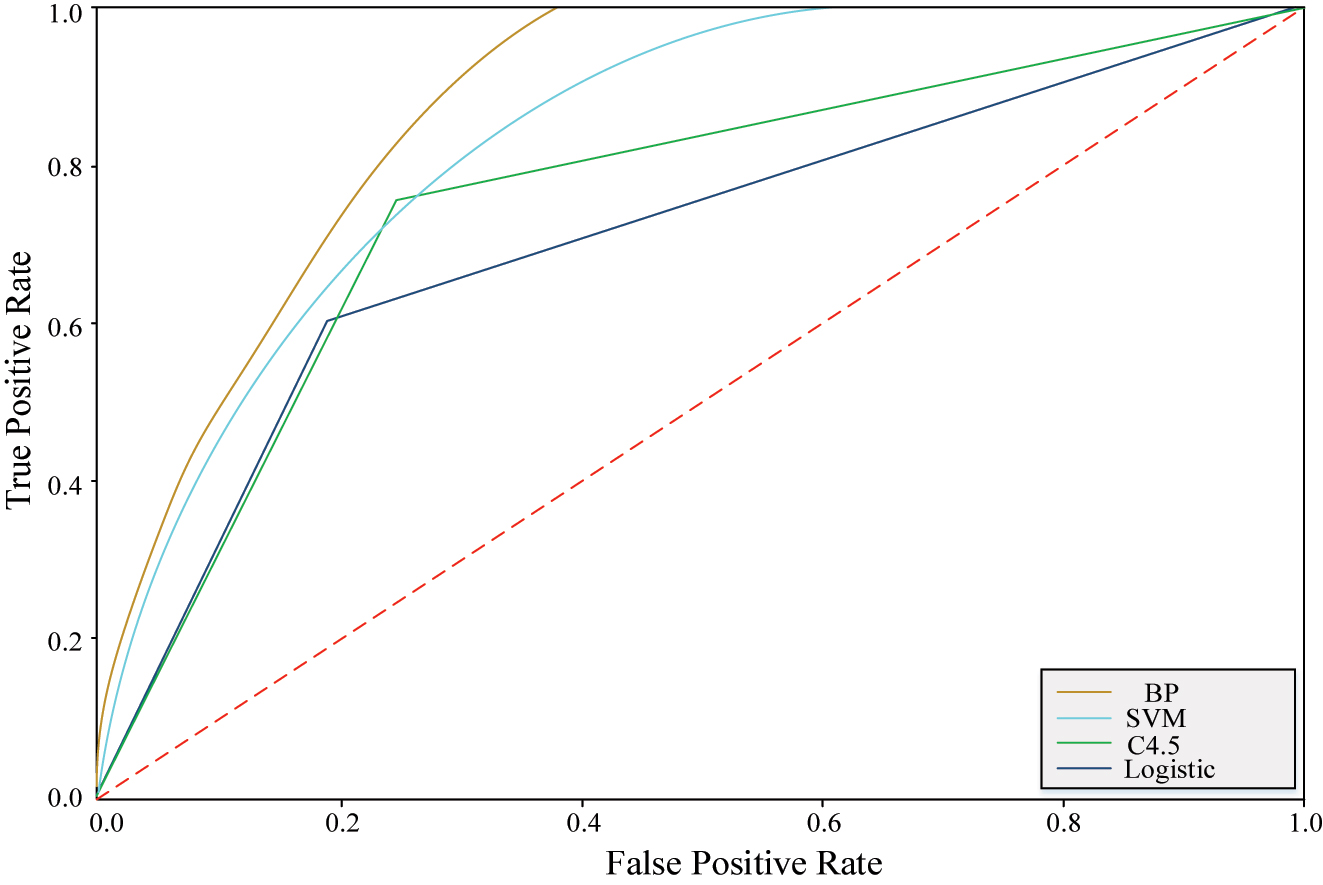
ROC curve of each algorithm model.
The ROC curve evaluates classifier performance by depicting the relationship between TPR and FPR at different thresholds. From the ROC curves of the four algorithm models, it is obvious to observe that the BP model has the best curve, which indicates that it is the best for customer churn prediction. The SVM model is the next best model, which is also capable of predicting customer churn. The C4.5 model and the Logistic model have a poor performance and show a broken line pattern, indicating that these two algorithms are somewhat incompetent when dealing with e-commerce customer data with a huge data volume. The BP algorithm exhibits the best ROC curve, which means it achieves better performance in balancing positive class recognition and false positives, significantly improving the accuracy and reliability of customer churn prediction. The prediction results of the four algorithms are compared with the combined K-BPNN algorithm using AUC, Accuracy, Precision, and Recall as the evaluation metrics, and the obtained results are shown in Figure 8.
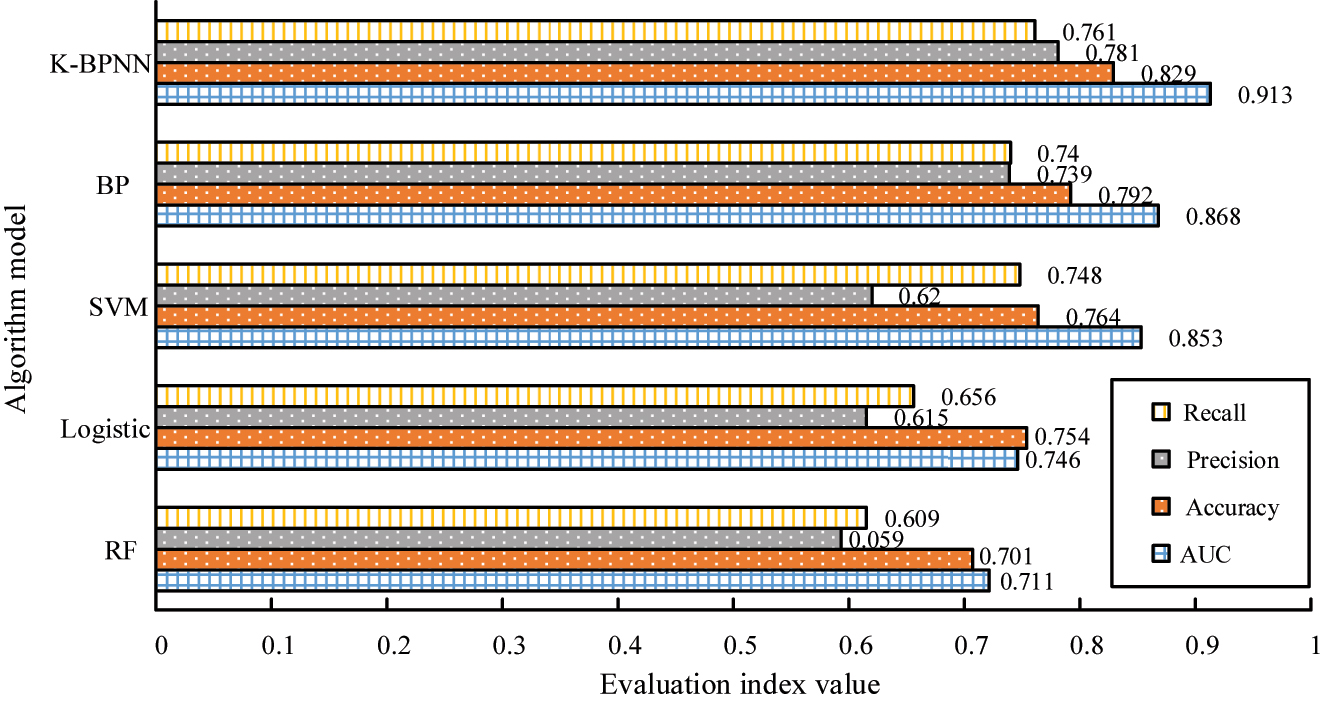
Comparison of prediction and evaluation of each algorithm model.
To better highlight the performance of the proposed model, this study compares and validates K-BPNN with traditional BP models, SVM in reference [23], Logistic in reference [24], and the Random Forest (RF) model in reference [25]. The results show that K-BPNN outperforms traditional BP, SVM, Logistic, and RF in key performance indicators such as AUC, Accuracy, Precision, and Recall. The AUC value of K-BPNN is 0.045 higher than that of BP, and the accuracy, precision, and recall are 0.037, 0.042, and 0.021 higher, respectively. This performance improvement is attributed to the optimization of features by K-means in the preprocessing stage, reducing the impact of data noise and outliers, and enhancing the ability of BP to handle complex data structures. In addition, the AUC, Accuracy, and Precision performance of the BP model are better than those of the Logistic and RF models, and the Recall index only slightly lags behind the SVM model. Therefore, compared with the good performance of the BP algorithm in predicting e-commerce customer churn, the K-BPNN model further improves the prediction accuracy. This demonstrates the significant advantage of K-BPNN in processing high-dimensional nonlinear e-commerce data, thus validating the novelty and contribution of K-BPNN in improving ECCP accuracy.
Figure 9 shows the F1-value results obtained by training each algorithm on two different datasets. As shown in Figure 9, with the increase of iteration times, the F1-value of K-BPNN is significantly higher than the other four algorithms. When the iteration reaches 50 times, all algorithms in the test and validation sets obtain the maximum value of the F1-value. In the test set, after 50 iterations, the maximum F1-values for K-BPNN, BP, SVM, Logistic, and RF are 96.01, 92.18, 85.49, 76.97, and 75.68, respectively. On the validation set, the maximum F1-values of K-BPNN, BP, SVM, Logistic, and RF are 98.46, 93.78, 87.29, 78.95, and 77.76, respectively. The F1-value of K-BPNN is significantly higher than the other four algorithms, indicating that the comprehensive performance of K-BPNN is better than the comparison methods, and it is less likely to have a mismatch between recall and accuracy.
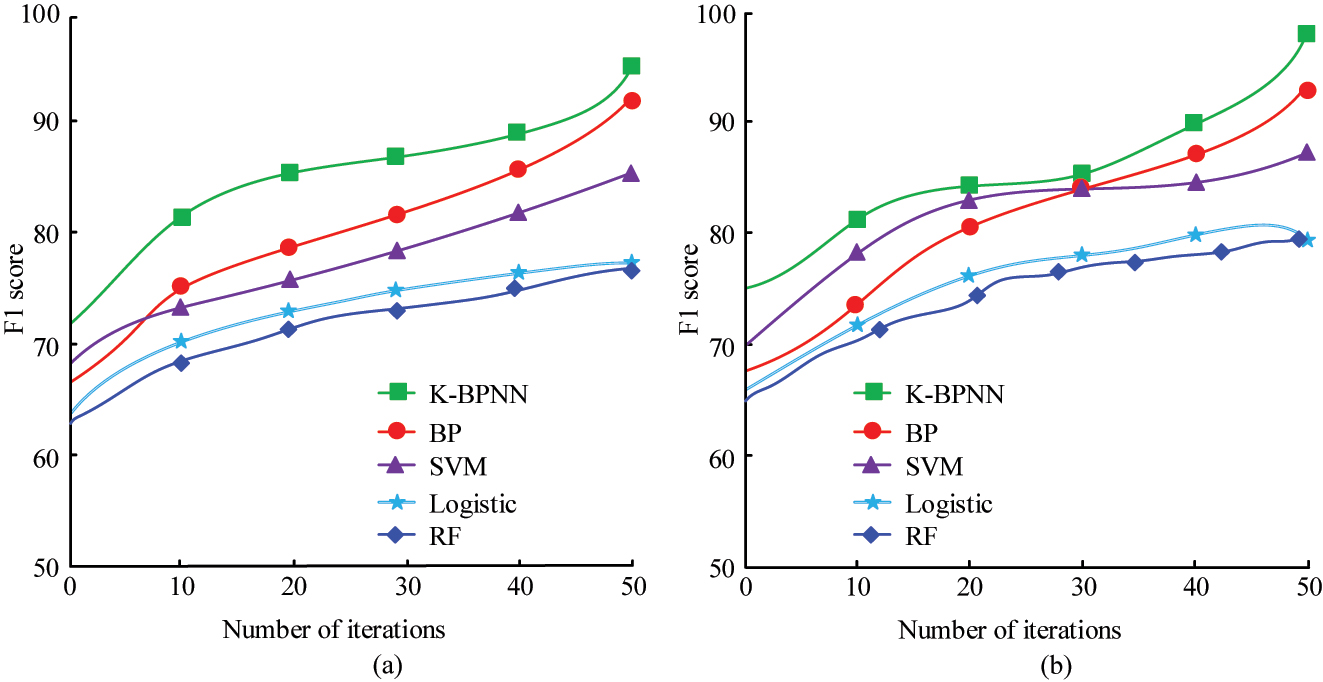
F1-values of the two datasets. (a) Testing set. (b) Verify set.
The Mean Absolute Percentage Error (MAPE) results obtained from testing two datasets are shown in Figure 10. As the number of iterations increases, the overall MAPE values of the five algorithms show a significant downward trend on different datasets. The MAPE value of the K-BPNN algorithm is significantly lower than that of other cross-border e-commerce performance evaluation models. From the average results of the two datasets, the MAPE values of K-BPNN, BP, SVM, Logistic, and RF are 0.102 %, 0.384 %, 0.445 %, 0.487 %, and 0.498 %, respectively. The average MAPE of the K-BPNN model is 0.282 %, 0.343 %, 0.385 %, and 0.396 % lower than the other three methods, respectively. The analysis of significant results shows that there is a significant difference in MAPE values between K-BPNN and the other four algorithms, indicating that K-BPNN has smaller errors and better performance in predicting customer churn.
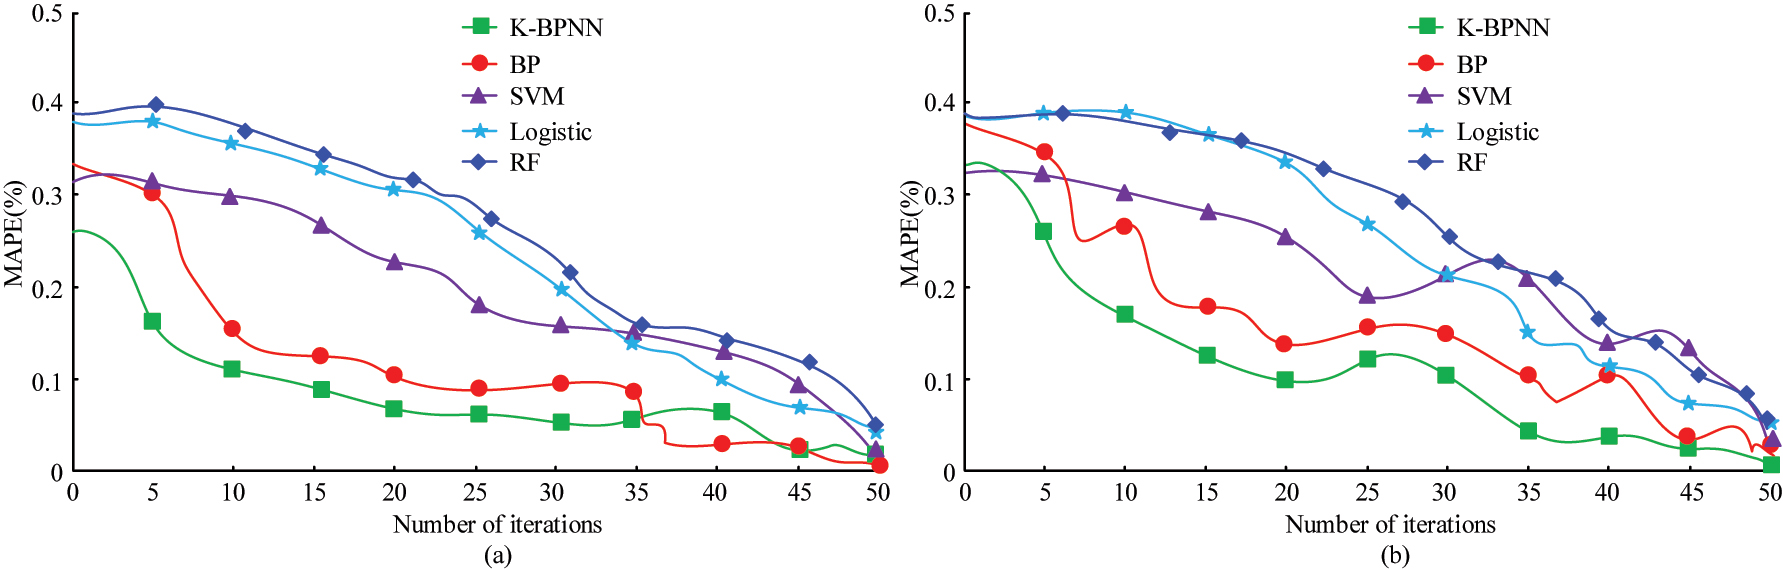
MAPE of the two datasets. (a) Testing set. (b) Verify set.
5 Discussion
With the rapid development of e-commerce, the problem of customer churn is gradually becoming a major obstacle to the sustained growth of organizations. Traditional churn prediction methods are facing various challenges, especially in the big data environment, which prompts researchers and practitioners to seek more advanced and accurate solutions. In this context, the study proposes a K-BPNN model based on BP with optimized K-means clustering, and achieves encouraging results on several evaluation metrics.
The results show that the F1-value of the K-BPNN model reaches 0.82, which is similar to the results obtained by Fatema et al. [20], but the K-BPNN model is significantly better. This is because the proposed method provides a more reasonable initial weight distribution for the BP through K-means clustering, avoiding the local optimum problem caused by traditional BP random initialization. The G-means of the K-BPNN model is 0.85, significantly higher than other methods. This is consistent with the conclusion of Chen et al. [22], and the proposed method is superior to Chen et al.’s method. This is because the K-BPNN model optimizes the data features of high churn risk customers, reduces noise interference, and enhances intra-class sample similarity, thereby significantly improving the recognition rate of churn customers in imbalanced data. Therefore, the K-BPNN model can help e-commerce enterprises effectively identify high-risk lost customers and adopt personalized marketing strategies promptly. It has important application value and wide applicability in the actual e-commerce environment.
To ensure higher feasibility of the research method in future implementations, data enhancement techniques, such as data expansion and data balancing, can be applied to the existing dataset to enhance the training effect of the model. In addition, when applied to different e-commerce platforms, the model parameters can be fine-tuned to adapt to the new data distribution and characteristics. In addition to predicting customer churn, the K-BPNN-based approach may be applied to customer segmentation and target market analysis, life cycle value prediction of new customers, and analysis of customers’ purchasing behavior and preferences. Moreover, the K-BPNN model may also be applied to a variety of business types, including, but not limited to, e-retail, financial services and banking, telecommunication, travel and hospitality, etc. The K-BPNN model, with their high accuracy in predicting customer churn, shows great potential for the future. As more data becomes available and computing power increases, the model can become a standard for many e-commerce platforms and other business sectors, providing them with in-depth customer insights and recommendations for action. As the model continues to be researched and optimized, its application scope and effectiveness may be further expanded and enhanced. However, the application of BP algorithms in ECCP, despite the significant advantages, is accompanied by a series of challenges. First, the training process of the BP algorithm is very sensitive to the choice of parameter initialization and learning rate, which may cause the network to fall into a local optimum or slow training speed. To address this challenge, a BP weight initialization method based on the C4.5 algorithm can be adopted. This method utilizes the information gain of decision trees to determine initial weights, which can effectively reduce initial errors, improve model classification accuracy, optimize the convergence ability of BP, and accelerate learning efficiency. Second, when dealing with large amounts of e-commerce data, the complexity of the neural network may lead to overfitting, which reduces the model’s generalization ability on new data. Regularization techniques, such as L1 and L2 regularization, can be used, or Dropout layers can be introduced in neural networks to improve the model’s generalization ability. In addition, the dynamic and diverse nature of e-commerce data means that models need to be regularly updated and fine-tuned to adapt to changing customer behavior patterns. This can be achieved through online or incremental learning methods, continuously introducing new data samples during the model training process and updating model parameters in real-time, thereby improving the adaptability of the model. Finally, while neural networks can provide strong predictive performance, their “black-box” nature makes model interpretation difficult, which can be a challenge for organizations looking to understand the causes of customer churn. To improve the interpretability of the model, feature importance analysis or local interpretation methods can be used to explain the decision-making process of the model.
This study theoretically proposes a K-BPNN model that combines K-means clustering with BP, optimizes data quality and initial weight settings, and improves prediction accuracy and model stability. In practice, K-BPNN exhibits higher adaptability and generalization ability on large-scale e-commerce datasets, providing an effective solution for predicting customer churn and having broad application potential.
6 Conclusions
Aiming at the key problem of e-commerce customer churn, this study successfully combined BP with an optimized K-means clustering method, and innovatively proposed a K-BPNN model. This model comprehensively utilized the powerful nonlinear mapping ability of BP to improve prediction accuracy, and optimized customer information through K-means clustering, providing high-quality input data for deep learning and enhancing model performance. The research results showed that after processing customer information using K-means clustering, the evaluation results of each algorithm model in the G-means index and F1-value index were improved. The G-mean score of the K-BPNN algorithm model was about 15 % higher than that of other algorithms, and the F1-value was about 31 % higher than that of other algorithms. In experiments on commercial customer datasets, the AUC, accuracy, Precision, and Recall values of K-BPNN were 0.045, 0.037, 0.042, and 0.021 higher than those of BPs. As a result, the study demonstrates the significant performance advantages of the K-BPNN model in predicting customer churn in e-commerce. The experiment verifies the statistically significant improvement of K-BPNN in AUC value, Accuracy, Precision, and Recall, demonstrating its high adaptability and predictive ability in predicting customer churn. This highlights the research significance and application potential of the integrated model in high-dimensional and nonlinear data processing.
Therefore, the K-BPNN model has achieved significant results in both theory and practice. At the theoretical level, K-BPNN combines K-means clustering with BP to optimize data quality and improve initial weight settings, thereby enhancing prediction accuracy and model stability. On a practical level, the K-BPNN model exhibits higher adaptability and generalization ability on large e-commerce datasets, effectively addressing the high-dimensional and nonlinear features of the data. This model provides a more accurate and reliable solution for predicting customer churn, demonstrating its extensive potential for application on various e-commerce platforms. However, despite the significant performance advantages of the K-BPNN model in predicting e-commerce customer churn, it still has some limitations. The constantly changing customer behavior and market environment may have a certain impact on the predictive performance of the model in practical applications. In the actual data collection process, there may be issues such as missing data and noise interference, and the integrity and quality of the data may affect the training effectiveness of the model. Future research should regularly update the dataset to ensure that the model can capture the latest market trends and developments promptly, and further strengthen data collection and cleaning work to improve data integrity and quality. Meanwhile, more efficient training algorithms, distributed computing techniques, or model pruning methods can be explored to reduce the computational complexity of the model and improve its feasibility in large-scale data scenarios. The combination of feature selection algorithms and interpretable machine learning techniques can improve the interpretability of models and provide deeper insights and decision support for enterprises.
-
Funding information: Author states no funding involved.
-
Author contributions: Dingjun Zhou: Conceptualization, Data curation, Formal analysis, Funding acquisition, Investigation, Methodology, Project administration, Resources, Software, Supervision, Validation, Visualization, Writing-original draft, Writing-review & editing. Author has accepted responsibility for the entire content of this manuscript and approved its submission.
-
Conflict of interest: Author states no conflict of interest.
-
Data availability statement: All data generated or analysed during this study are included in this published article.
References
1. Abtahi, AT, Shafique, T, Haque, TA, Siam, SAJ, Rahman, A. Exploring consumer preferences: the significance of personalization in e-commerce. Malays E Commer J 2024;8:1–7. https://doi.org/10.26480/mecj.01.2024.01.07.Suche in Google Scholar
2. Du, X, Niu, D, Chen, Y, Wang, X, Bi, Z. City classification for municipal solid waste prediction in mainland China based on K-means clustering. Waste Manag 2022;144:445–53. https://doi.org/10.1016/j.wasman.2022.04.024.Suche in Google Scholar PubMed
3. Sun, Z, Hu, Y, Li, W, Feng, S, Pei, L. Prediction model for short-term traffic flow based on a K-means-gated recurrent unit combination. IET Intell Transp Syst 2022;16:675–90. https://doi.org/10.1049/itr2.12165.Suche in Google Scholar
4. Mo, H. Customer churn prediction based on customer value and user evaluation emotions in online marketing. Int J Web Based Commun 2025;21:107–23. https://doi.org/10.1504/ijwbc.2025.145136.Suche in Google Scholar
5. Chen, W. Enterprise financial risk prediction and intelligent early warning model based on deep learning. Discov Artif Intell 2025;5:1–9. https://doi.org/10.1007/s44163-025-00497-1.Suche in Google Scholar
6. Melian, DM, Dumitrache, A, Stancu, S, Nastu, A. Customer churn prediction in telecommunication industry: a data analysis techniques approach. Postmod Open 2022;13:78–104. https://doi.org/10.18662/po/13.1sup1/415.Suche in Google Scholar
7. Panjasuchat, M, Limpiyakorn, Y. Applying reinforcement learning for customer churn prediction. J Phys Conf Ser 2020;1619:012016. https://doi.org/10.1088/1742-6596/1619/1/012016.Suche in Google Scholar
8. Amin, A, Al-Obeidat, F, Shah, B, Adnan, A, Loo, J, Anwar, S. Customer churn prediction in telecommunication industry using data certainty. J Bus Res 2019;94:290–301. https://doi.org/10.1016/j.jbusres.2018.03.003.Suche in Google Scholar
9. Zhao, M, Zeng, Q, Chang, M, Tong, Q, Su, J. A prediction model of customer churn considering customer value: an empirical research of telecom industry in China. Discrete Dyn Nat Soc 2021;2021:1–12. https://doi.org/10.1155/2021/7160527.Suche in Google Scholar
10. Amatare, SA, Ojo, AK. Predicting customer churn in telecommunication industry using convolutional neural network model. IOSR J Comput Eng 2021;22:54–9.Suche in Google Scholar
11. Li, X, Sha, Q. Intelligent financial data mining and prediction model in economic management decision making. IET Conf Proc 2025;2025:331–6. https://doi.org/10.1049/icp.2025.3072.Suche in Google Scholar
12. Ling, Y, Chai, C, Hou, W, Hei, D, Qing, S, Jia, W. A new method for nuclear accident source term inversion based on GA-BPNN algorithm. Neural Netw World 2019;29:71–82. https://doi.org/10.14311/nnw.2019.29.006.Suche in Google Scholar
13. Chen, ZL, Wang, XF, Chen, YQ, Xue, Y, Liu, JZ. Nondestructive diagnosis of total nitrogen content in canopy leaves of Dalbergia odorifera based on multi-features and improved BPN. Chin J Ecol 2019;38:275–82.Suche in Google Scholar
14. Samantaray, S, Sahoo, A. Prediction of runoff using BPNN, FFBPNN, CFBPNN algorithm in arid watershed: a case study. Int J Knowl Base Intell Eng Syst 2020;24:243–51. https://doi.org/10.3233/kes-200046.Suche in Google Scholar
15. Zhang, Y, Li, W. Improved back-propagation neural network applied to enterprise employee performance appraisal and evaluation. J Adv Comput Intell Intell Inf 2025;29:131–7. https://doi.org/10.20965/jaciii.2025.p0131.Suche in Google Scholar
16. Rahmaty, M, Daneshvar, A, Salahi, F, Ebrahimi, M, Chobar, AP. Customer churn modeling via the grey wolf optimizer and ensemble neural networks. Discrete Dyn Nat Soc 2022;2022:1–12. https://doi.org/10.1155/2022/9390768.Suche in Google Scholar
17. Wialldi, G, Febriansyah, H. Model evaluation and implementation strategy planning based on attrition predictive model in Perseroan Luar Negeri Ltd. J Account Financ Manag 2025;6:1777–88. https://doi.org/10.38035/jafm.v6i3.2252.Suche in Google Scholar
18. Luo, S, Zhang, Z, Yang, S. Research on early warning of enterprise financial risk based on neural network model. Adv Ind Eng Manag 2023;12.Suche in Google Scholar
19. Li, X, Wang, J, Yang, C. Risk prediction in financial management of listed companies based on optimized BP neural network under digital economy. Neural Comput Appl 2023;35:2045–58. https://doi.org/10.1007/s00521-022-07377-0.Suche in Google Scholar
20. Fatema, N, Farkoush, SG, Hasan, M, Malik, H. Deterministic and probabilistic occupancy detection with a novel heuristic optimization and back-propagation (BP) based algorithm. J Intell Fuzzy Syst 2022;42:779–91. https://doi.org/10.3233/jifs-189748.Suche in Google Scholar
21. Xu, Q, Liu, X. The utilization of artificial intelligence in enhancing English language instruction and fostering entrepreneurial education. J Comput Methods Sci Eng 2025;25:1593–605. https://doi.org/10.1177/14727978241302155.Suche in Google Scholar
22. Men, Y, Zhao, M. Hybrid machine learning techniques for improving student management and academic performance. Int J Inf Commun Technol 2025;26:93–108. https://doi.org/10.1504/ijict.2025.146666.Suche in Google Scholar
23. Papa, A, Shemet, Y, Yarovyi, A. Analysis of fuzzy logic methods for forecasting customer churn. Technol Audit Prod Reserves 2021;1:12–14. https://doi.org/10.15587/2706-5448.2021.225285.Suche in Google Scholar
24. Caigny, AD, Coussement, K, Bock, K, Lessmann, S. Incorporating textual information in customer churn prediction models based on a convolutional neural network. Int J Forecast 2019;36:1563–78.10.1016/j.ijforecast.2019.03.029Suche in Google Scholar
25. Mutanen, T, Nousiainen, S, Ahola, J. Customer churn prediction–a case study in retail banking. In: Data mining for business applications. Netherlands, Amsterdam: IOS Press; 2010:77–83 pp.Suche in Google Scholar
26. Akan, O, Verma, A, Sharma, S. Prediction of customer churn risk with advanced machine learning methods. Int J Data Sci 2025;10:70–95. https://doi.org/10.1504/ijds.2025.144832.Suche in Google Scholar
27. Singh, P, Anik, FI, Senapati, R, Sinha, A, Sakib, N, Hossain, E. Investigating customer churn in banking: a machine learning approach and visualization app for data science and management. Data Sci Manag 2024;7:7–16. https://doi.org/10.1016/j.dsm.2023.09.002.Suche in Google Scholar
28. Wei, Q. Personalized and contextualized data analysis for e-commerce customer retention improvement with Bi-LSTM churn prediction. IEEE Trans Consum Electron 2025;71:4406–14. https://doi.org/10.1109/tce.2024.3376672.Suche in Google Scholar
29. Anitha, MA, Sherly, KK. Churn prediction with GraphSAGE model based on the derived features using RFM and sentiment analysis. J Chin Inst Eng 2025;48:441–53. https://doi.org/10.1080/02533839.2025.2478185.Suche in Google Scholar
30. Le, F, Zhai, J. Research on cross-border e-commerce customer churn prediction based on enhanced XGBoost algorithm with temporal-spatial features. J Comput Methods Sci Eng 2025;25:4407–18. https://doi.org/10.1177/14727978251337888.Suche in Google Scholar
31. Vashistha, A, Tiwari, AK, Ghai, SS, Yadav, PK, Pandey, S. Enhancing customer churn prediction in the banking sector through hybrid segmented models with model-agnostic interpretability techniques. Natl Acad Sci Lett 2025;48:459–63. https://doi.org/10.1007/s40009-024-01493-2.Suche in Google Scholar
© 2026 the author(s), published by De Gruyter, Berlin/Boston
This work is licensed under the Creative Commons Attribution 4.0 International License.
Artikel in diesem Heft
- Research Articles
- The dynamics of prey–predator model with global warming on carrying capacity and wind flow on predation
- Analysis of traffic density dynamics under varied noise conditions using data-driven partial differential equations
- Soliton, stability, multistability, and diverse tools for identifying chaos in a nonlinear model with two modified methods
- An efficient recurrent neural network based confusion component construction and its application in protection of saliency in digital information
- SI Nonlinear Analysis and Design of Communication Networks for IoT Appl.APC
- A passive wireless sensor signal anti-interference method based on RFID
- SI: Advances in Nonlinear Dynamics and Control APC
- Application of backpropagation neural network algorithm in e-commerce customer churn prediction