Design of optical Kerr effect in multilayer hyperbolic metamaterials
-
Domenico Genchi

 ,
Francesca Dodici
,
Francesca Dodici

Abstract
The design of optical materials in nonlinear devices represents a fundamental step for their optimization and miniaturization, that would significantly contribute to the progress of advanced nanophotonics and quantum technologies. In this work, the effect of geometry and composition of multilayer hyperbolic metamaterials on their third-order nonlinear optical properties, i.e. the optical Kerr effect, is investigated. One figure of merit is provided to be used as a predictive tool to design and best exploit the local intensity enhancement in low-loss metamaterials to be used for various applications in nonlinear nanophotonics.
1 Introduction
In recent years, great interest of scientific research has grown in novel materials whose optical properties can be tailored as desired and actively controlled by external parameters in order to manipulate light at the nanoscale [1]. This is highly relevant for advanced applications in nonlinear nanophotonics, such as ultrafast all-optical switching [2], optical limiting [3] and frequency conversion [4], representing the heart of quantum technologies. One of the main challenges is the design of materials and devices properly featured to achieve an enhanced ultrafast nonlinear response with high efficiency at low-intensity excitation. To this scope, predicting, controlling and enhancing the nonlinear optical response becomes essential for the development of efficient and reconfigurable nonlinear optical devices with optimized properties to be used in integrated optical circuits [5].
In this framework, near-zero-index (NZI) materials offer new interesting features that can be used for light control in photonic devices [6]. Indeed, their refractive index reaches a very low value (close to zero), thus producing an increase in the normal field component at the boundary with an isotropic medium
Epsilon-near-zero (ENZ) materials are one of the most promising class of non-magnetic NZI media potentially employable as platforms for these applications [9], and several intriguing phenomena useful for their operation and miniaturization have been predicted and observed, such as radiation phase pattern tailoring [10], electromagnetic energy squeezing [11], subwavelength light guiding [12], and time refraction [13]. At the ENZ wavelength (λ ENZ) of these materials, where the real part of the dielectric permittivity crosses the zero, a strong electric field enhancement is obtained, which is able to induce important ultrafast nonlinear optical responses under light excitation, thus making them very appealing for several nonlinear optical applications [8], [14]. Among these, all-optical switching is one of the most important to fulfill the ON/OFF function needed for ultrafast optical signal processing [15]–[18]. One method to achieve it is based on the optical Kerr effect (OKE), namely the dependence of the nonlinear refractive index and the nonlinear absorption coefficient of a medium on the intensity of the pump field, which permits the modulation of the local refractive index and absorption coefficient on the picosecond and femtosecond time scale [19]–[21]. The OKE can be significantly enhanced in ENZ media near λ ENZ [22]–[24]. However, their performances are typically limited by their intrinsic losses, that can suppress the NZI effects regardless of how close to zero is the refractive index. Indeed, the ENZ regime typically coincides with the NZI regime in the absence of losses. Differently, with non-negligible losses, the NZI regime is distinguished from the ENZ regime, with the former generally redshifted in the spectrum compared to the latter, and shown to be more beneficial for the efficiency of nonlinear optical effects [25]. Thus, in nonlinear ENZ materials the near-zero permittivity is not the only sufficient condition for the nonlinear response enhancement, but also the intrinsic losses have to be reduced.
Hyperbolic metamaterials (HMs) emerge among the highest-potential ENZ materials. As a matter of fact, unlike plasmonic metals (Au, Ag, Cu, …) and transparent conductive oxides (ITO, AZO, …) showing natural ENZ properties at their plasma frequencies respectively fixed in the ultraviolet or infrared ranges of the electromagnetic spectrum, HMs offer a broadband spectral tunability of their λ ENZ at visible wavelengths thanks to the tailorability of their compositional and morphological features. The combination of a metal and a dielectric in a multilayered geometry or their arrangement as metal nanorods in a dielectric matrix allows to obtain an extremely anisotropic uniaxial dielectric tensor whose components are opposite in sign [26]. This gives rise to a topological transition from elliptical to hyperbolic dispersion, and adjustable optical properties, which can be engineered by changing the metal filling fraction and controlled by external parameters [27], [28]. Recently, in the field of nonlinear nanophotonics, enhanced third-order nonlinearities in HMs have been reported [24], [29], and their angle and polarization tunability has been demonstrated [30], [31]. Then, HMs have been proposed as platforms for OKE-based all-optical modulators [15], [20], [32].
Multilayer HMs are particularly attractive for the simplicity of their fabrication through lithography-free nanofabrication methods, and the capability of integrating them within optical devices using current technologies. Moreover, they behave as effective waveguides made up of coupled optical nanocavities where the spatial mode matching between the surface plasmon polaritons (SPPs) supported at the metal-dielectric interfaces gives rise to highly confined plasmonic modes with very large wavevectors and slow light nature that can be excited by free-space light [33]. In the literature, several names are used to call these modes, such as bulk plasmon polaritons [34], volume plasmon polaritons [35], high-k modes [36], Ferrell–Berreman modes [37], Bloch plasmon polaritons [38], and multilayer plasmons [39]. Due to the heterogeneous denomination, here we prefer to call them with a more general definition of plasmon polaritons (PPs). Such PPs permit to obtain large field enhancement and a huge increase of the optical density of states, so producing resonances with narrow linewidths that can be exploited in subwavelength optics for achieving large optical nonlinearities [31], enhanced photoluminescence [40] and high-sensitivity optical sensing [41].
In the present work, we show how to finely tailor the nonlinear optical properties in multilayer hyperbolic metamaterials by geometry and composition. We demonstrate the enhancement of the optical Kerr effect favoured by PPs at λ ENZ in a spectral range far from the interband transitions of the metal component and where its optical losses are minimum. We introduce one figure of merit to be used for designing ENZ multilayer metamaterials with strong third-order optical nonlinearities, best exploiting the local intensity enhancement generated by their ENZ resonances in different angle and polarization configurations, and to optimize them for nonlinear optical applications.
2 Results and discussion
The optimization of the geometrical and compositional features of HMs represents a crucial step for their implementation in nonlinear photonic devices whose properties and performances have to be customizable and accurately controllable. In this work we engineer HMs by changing the metal filling fraction f m , which is changed by varying the thickness of the dielectric layers (t d ) while maintaining that of the metal layers constant (t m = 15 nm) (see Section 4). In such a way, λ ENZ is tuned across the optical spectrum [28]. In particular, we want λ ENZ beyond the region of the metal interband absorption. For instance, the real part of the parallel component of the effective permittivity (Re[ɛ ‖]) calculated by effective medium theory (EMT, see Section 4) for Au/Al2O3 HMs is shown in Figure 1(a): λ ENZ is redshifted by decreasing f m , that is by increasing t d . The absorptance calculated by EMUstack at normal incidence for Au/Al2O3 HMs is depicted in Figure 1(b) as a function of t d . Up to t d = 30 nm the metamaterial exhibits a wide absorption band between 300 nm and 500 nm produced by the interband transitions of gold [42], and an abrupt change of character at the ENZ wavelength owing to the topological transition from elliptic to hyperbolic dispersion occurring at this wavelength [27], [43]. For t d > 40 nm additional peaks appear, and the optical response can be importantly modulated, even in the interband region. The origin of these peaks stems from the spatial mode matching between the SPPs sustained at the metal-dielectric interfaces in the HMs, whose coupling gives rise to PPs [36]. Indeed, the HMs act like photonic crystals made up of multiple stacked optical nanocavities where a very high electric field confinement occurs [31], [44]. This effect is evidenced by the field distribution in the stack, reported as an example in Figure S1(b) of Supplementary Material for the metamaterial with t d = 85 nm at its λ ENZ (666 nm, red profile). For comparison, the field distribution is also depicted at λ = 500 nm (green profile), namely close to the gold interband transitions region, where the plasmonic effect is weaker due to metal losses. With sufficiently thin metal layers and thick dielectric layers, a standing wave is formed inside the nanocavities, so that the coupling effect becomes more significant and multiple plasmonic resonances can occur. This effect has been also explained in terms of optical tunneling experienced by the photons travelling within each nanocavity composing the multilayers, which globally behave as gratings so that the PP modes can be excited without special momentum matching techniques [44]–[46]. In Figure 1(b), the increase of the dielectric thickness corresponds to a decrease in the metal filling fraction of the HMs. This lowers the losses and the effective refractive index of the metamaterial, so promoting the SPP coupling inside it and allowing the activation of a larger number of PPs, whose existence is corroborated by the multiple dips appearing in the reflectance spectra plotted in Figure S1(c) of Supplementary Material (connected with the absorptance peaks in Figure 1(b)), which are the distinctive features of PP modes [47]. The properties of these resonances (e.g. their number, spectral distance, and quality factor) depend on the geometrical features of the multilayer (i.e. layers thickness and number of cavities) [44], [46], [47]. The condition for these resonances to be sustained is given by the ratio between the real part and the imaginary part of the metal refractive index, and a critical value of this ratio (n m /κ m = 0.2) has been found by Caligiuri et al. [45], thus defining the so-called “hermiticity limit”. The n m /κ m ratio for Au is plotted in Figure S1(d) of Supplementary Material. In Au-based systems the cavity resonances can be sustained in the Hermitian region at λ > 550 nm where n m /κ m < 0.2, and cannot exist in the non-Hermitian interband region (λ < 550 nm, n m /κ m > 0.2).
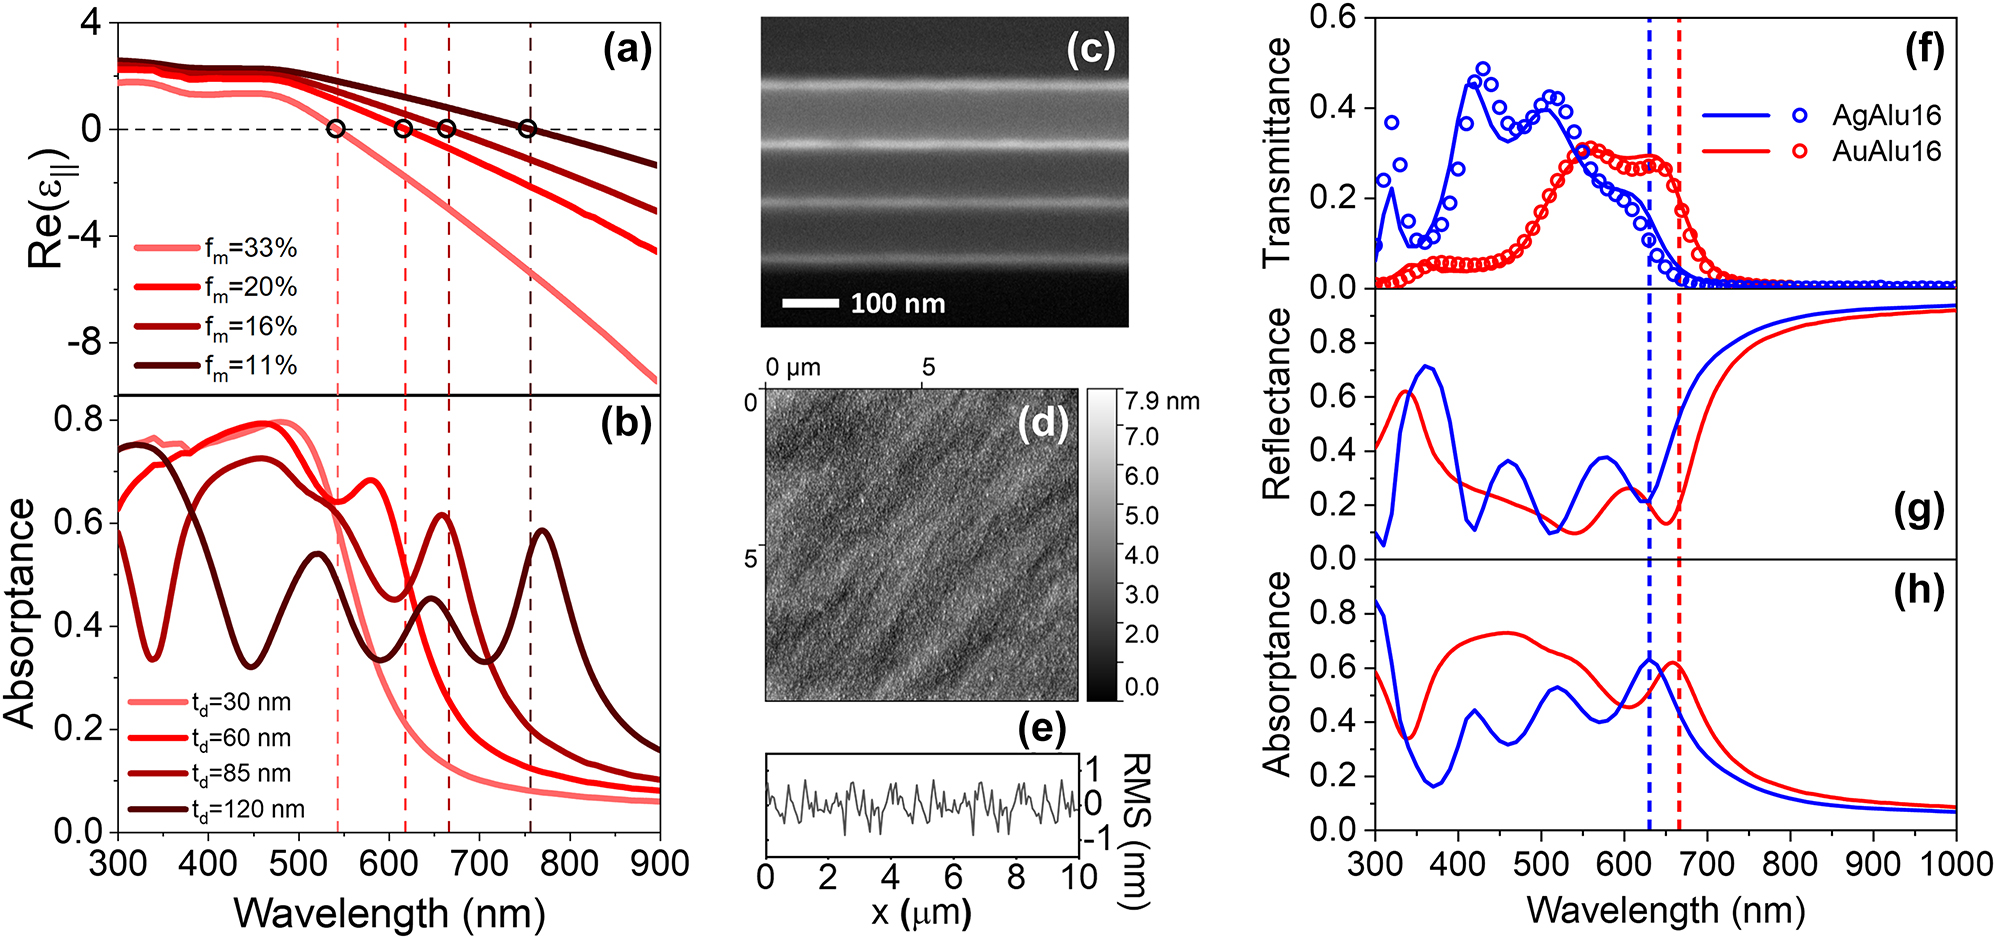
Optical and morphological properties of multilayer hyperbolic metamaterials. (a) Effective permittivity (parallel, real part) and (b) absorptance of Au/Al2O3 HMs with different metal filling fraction, varied by changing the thickness of the dielectric layers while maintaining that of the metal layers equal to 15 nm. (c) Cross-sectional SEM image (acquired using backscattered electrons), (d) AFM surface topography, (e) RMS roughness profile of the sample AuAlu16. (f–h) Experimental (open symbols) and simulated (solid lines) optical spectra of the samples AuAlu16 (red) and AgAlu16 (blue). The vertical dashed lines in panels (a–b) and (f–h) indicate the λ ENZ of each sample.
Experimentally, we fabricate hyperbolic multilayers corresponding to those considered in Figure 1(a), (b). The constituent materials (gold and alumina) are chosen owing to their high chemical stability. Details about the synthesis and characterization are reported in Section 4. As an example, Figure 1(c) displays the cross-sectional SEM image acquired with backscattered electrons for the 16/85 Au/Al2O3 metamaterial with f m = 16 % (AuAlu16): the metal layers (light gray) and dielectric layers (dark gray) are clearly distinguished thus evidencing the four-period structure of the stack. The AFM topography and the RMS roughness (R RMS) profile of the sample are shown in Figure 1(d), (e), revealing a continuous unvoided surface with an average RMS roughness equal to 0.9 ± 0.1 nm, indicating a good quality of the films growth during the depositions. The spectroscopic ellipsometry (SE) data measured for AuAlu16 are reported in Figure S2 of Supplementary Material, which are used to evaluate the quality of the multilayers in terms of thickness homogeneity, surface roughness and interfaces definition. The morphological parameters extracted by AFM and SE for all the metamaterials fabricated in the present work are tabulated in Table S1 of Supplementary Material. The optical transmittance of AuAlu16 is illustrated in Figure 1(f) (red curve), showing a good agreement between the experimental data and the simulations by EMUstack. The simulated reflectance and absorptance are plotted in Figure 1(g), (h). The existence of PP modes supported by the metamaterials is evidenced by the reflectance dips, corresponding to the transmittance and absorptance peaks [37], [47], [48]. Since the propagation and coupling of SPPs within HMs strongly depend on the thickness of the layers constituting the coupled nanocavities [44], we study the evolution of the optical properties in Au/Al2O3 HMs with different geometrical features (see Figure S4 in Supplementary Material). The results show that the transparency window for light propagation through the metamaterial can be broadened by increasing the thickness of the dielectric layers, that is lowering the metal filling fraction, so that a higher number of PP modes are sustained. Moreover, the SPP coupling plays a more important role in metamaterials with low filling fraction, significantly modifying the spectral shape of their optical features, strongly modulated by increasing the thickness of the layers. As shown in Figure S1(d) of Supplementary Material, the Hermitian spectral range where the cavity resonances are sustained can be extended by using Ag due to its lower optical damping and a blueshifted interband region at λ < 350 nm [45]. Then, we fabricate an Ag/Al2O3 HM (named as AgAlu16), equivalent to AuAlu16 (i.e. having t m = 16 nm, t d = 85 nm, f m = 16 %) in order to compare their optical properties and give insights into the role of composition on the plasmonic response of HMs. A very thin (4 nm) alumina capping layer is also deposited on its top to increase the chemical stability of the sample, preventing oxidation of the upper Ag layer without affecting the optical properties of the metamaterial. The SE spectra and a SEM image of the sample are shown in Figure S2(c), (d) of Supplementary Material, while the measured morphological parameters are reported in Table S1(b) of Supplementary Material. A good agreement is obtained between the experimental and simulated transmittance in Figure 1(f), showing a higher number of optical resonances associated with PP modes, whose number corresponds to the number of optical nanocavities constituting the metamaterial. The ENZ wavelength determined for AgAlu16 is λ ENZ = 632 nm.
Considering the main points highlighted so far, we introduce a figure of merit (FOM) to be used as a tool for tailoring the geometry and composition of HMs and better take advantage of the contribution given by the ENZ and PP modes in order to obtain enhanced third-order optical nonlinearities, which are enabling properties for nonlinear optical applications, like all-optical switching, optical limiting and mode-locking. The basic idea of this FOM is to maximize the local intensity promoted by the confinement of PPs and minimize the optical damping given by the metallic component or by the reflection losses in order to favour the nonlinear optical response in a high-transmission metamaterial. In such a way, the FOM allows to find the optimal trade-off between these effects, and devices with high nonlinear efficiency and high output signal can be designed. The FOM is defined as:
Here, T and R are, respectively, the transmittance and reflectance of the metamaterial, Im[ɛ m ] is the imaginary part of the permittivity of the metal constituent, and ϕ m is an effective filling fraction (see Section 4) which accounts for the local intensity enhancement in the metamaterials and plays the main role in controlling their optical nonlinearities, as demonstrated in Ref. [31]. It is worth to underline that all the parameters included in the FOM are wavelength-dependent. Besides, T, R and ϕ m are angle-dependent. Consequently, the FOM depends on both wavelength and angle, and thus it can be used for any spectral and angular configuration. Hereafter we make use of the FOM to study the effect of the dielectric thickness, metal thickness, and composition on the third-order nonlinear optical properties of HMs. However, it is worth to point out that the FOM includes important parameters that can be useful for a broader range of applications, such as in optical sensing [41] and radiative decay engineering [40].
Figure 2(a) shows the FOM calculated at normal incidence in the visible spectrum for a four-period Au/Al2O3 HM with 15 nm metal thickness and varying dielectric thickness (10–200 nm). The white dashed line and green solid line are the locus of points of the ENZ wavelengths calculated respectively by EMT [43] and inverse scattering matrix method (ISMM) [49] for each geometrical combination. In the contour plot, three claw-like bands appear for multilayers with t
d
> 30 nm above λ = 500 nm. These correspond to PP modes existing in the Hermitian region of the spectrum (see Figure S1(d) of Supplementary Material) where ENZ resonances can be sustained by the coupled nanocavities in the HMs [45]. In particular, the rightmost band corresponds to PP modes occurring near the ENZ wavelength of the metamaterials. The PP band and the ENZ curves intersect at a point corresponding to a structure having 85-nm-thick dielectric layers (AuAlu16, marked with the star). This crossing can represent the limit of validity of EMT against ISMM for the considered four-period multilayer structure, and it can be used as a benchmark for multilayer periodic structures possessing the optical properties of coupled nano-waveguides but still describable as ENZ metamaterials in a quite good approximation. Indeed, the values of λ
ENZ calculated by the two methods (white = EMT, green = ISMM) coincide within a 1 % error up to t
d
= 85 nm, whereas the two curves start to diverge for larger dielectric thickness. The percent deviation between
![Figure 2:
Contour plots of (a, d) the FOM, (b, e) nonlinear absorption coefficient β, and (c, f) nonlinear refractive index n
2 calculated for HMs with 15-nm-thick metal layers and different dielectric layers thickness, arranged in four-period stacks. Panels (a–c) refer to Au/Al2O3 HMs, whereas panels (d–f) to Ag/Al2O3 HMs. The FOM (a, d) is calculated by Eq. (1), whereas β and n
2 are computed by our model using the effective filling fraction [31]. The dashed green curves correspond to the ENZ wavelengths extracted by EMT, whereas the solid green curves represent those extracted by ISMM. The stars mark a metamaterial structure made up of 15 nm metal layers and 85 nm metal layers.](/document/doi/10.1515/nanoph-2024-0169/asset/graphic/j_nanoph-2024-0169_fig_002.jpg)
Contour plots of (a, d) the FOM, (b, e) nonlinear absorption coefficient β, and (c, f) nonlinear refractive index n 2 calculated for HMs with 15-nm-thick metal layers and different dielectric layers thickness, arranged in four-period stacks. Panels (a–c) refer to Au/Al2O3 HMs, whereas panels (d–f) to Ag/Al2O3 HMs. The FOM (a, d) is calculated by Eq. (1), whereas β and n 2 are computed by our model using the effective filling fraction [31]. The dashed green curves correspond to the ENZ wavelengths extracted by EMT, whereas the solid green curves represent those extracted by ISMM. The stars mark a metamaterial structure made up of 15 nm metal layers and 85 nm metal layers.
The highly confined PPs produce a local intensity enhancement (represented by ϕ
m
in Figure S7(a), (b) of Supplementary Material) that potentially favours the nonlinear response of the metamaterials. Figure 2(b), (c) show the nonlinear absorption coefficient β and the nonlinear refractive index n
2 calculated by following the approach described in our previous work [31] (see Section 4). A strong nonlinear response is obtained around λ = 500 nm due to the interband contribution of gold, producing a large peak of β and a sign inversion from negative to positive n
2. A change of sign is also obtained in the β coefficient at λ < 500 nm. The sign reversal of both the nonlinear parameters corresponds to a sign variation of the third-order susceptibility of gold
The details of the FOM features depend on the compositional properties of the HMs. As a matter of fact, the field confinement within the stack can be varied by changing the dielectric contrast between the metal and dielectric constituents. Besides, the metal mostly affects the optical damping and the capability to support ENZ resonances depending on the spectral position of the interband absorption. The FOM can be increased with Ag-based HMs, in which the optical losses are largely dropped because the interband absorption of silver occurs in the near-UV spectral range, thus also widening the Hermitian region supporting ENZ resonances (see Figure S1(d) of Supplementary Material). For example, as shown in Figure 2(d), in the case of the Ag/Al2O3 HM a 3-fold increase of the FOM and a larger number of PP modes exist in a wider spectral region compared to Au-based HM. The greater prominence of the PP bands in the Ag/Al2O3 stacks is related to the better decoupling of these modes from the interband region. As a consequence, the nonlinear optical response in the visible range is predicted to be larger than in Au-based HM. Indeed, as shown in Figure 2(e), (f), the nonlinear parameters β and n 2 are predicted to be 10 times higher: the highest optical nonlinearities still occur near λ ENZ, where β changes its sign from positive to negative and n 2 exhibits a maximum. Even in this case the λ ENZ curves calculated by EMT (dashed green) and ISMM (solid green) overlap up to t d = 85 nm (Δλ ENZ = ±2 %, see Figure S5(a) in Supplementary Material), and they intersect the rightmost resonance band of the FOM with a 15/85 nm multilayer (AgAlu16, marked with the star). The effective permittivity of AgAlu16 calculated by EMT and ISMM is shown in Figure S6(b) of Supplementary Material.
It is worth to stress that the presented calculations predict the highest third-order nonlinearities near the ENZ wavelength, and not at the NZI condition where the metamaterial has the minimum refractive index (n), that would occur at λ > λ
ENZ as shown in other works [6], [25]. For example, according to EMT, AuAlu16 and AgAlu16 respectively exhibit the lowest n at 837 nm and 830 nm, as shown in Figure S8(a), (b) of Supplementary Material where the effective optical functions of the metamaterials are plotted. Therefore, a high nonlinear response might be expected near these wavelengths due to NZI effects. Nevertheless, in this spectral region the metamaterials exhibit high values of their extinction coefficient κ and reflectance, so that losses play an important role in the definition of the NZI regime, and limit the nonlinear response. Thus, since κ cannot be neglected in the case of hyperbolic metamaterials with effective parameters, we considered the modulus of the complex effective refractive index (
The loss properties of the metamaterials and the ability of SPPs to propagate and couple at their inside drastically depend on the thickness of the metal layers [44]. For a comprehensive investigation, we study the evolution of the FOM and the nonlinear parameters as a function of the thickness of the metal layers in the metamaterials. The contour plots in Figure 3 display the spectrally-resolved FOM (panels (a, d)) and nonlinear OKE parameters β (panels (b, e)) and n
2 (panels (c, f)) as a function of t
m
in four-period metamaterials with fixed thickness of the dielectric layers (t
d
= 85 nm). As described above, this dielectric thickness corresponds to the value at which the establishment of λ
ENZ by EMT is at its limit (as seen in Figure 2), and λ
ENZ matches a PP mode (see Figure 1(b)). The plots in Figure 3(a)–(c) correspond to Au/Al2O3 multilayers. The FOM contour plot in Figure 3(a) shows the presence of local maxima at λ > 500 nm (namely over the gold interband absorption region) related to the SPP modes coupling for t
m
< 30 nm. The bands become progressively less intense and less separated as t
m
increases, and completely disappear with t
m
> 30 nm. The decrease in the absolute value of the FOM is due to the fact that, by increasing t
m
with fixed t
d
, the metamaterial has a gradually larger metal filling fraction, thus leading to larger absorption and reflection. Furthermore, thicker metal layers provide a smaller penetration depth bringing to the breakdown of long-range SPPs [52], then to a low T/R ratio and low output signal, thus making the metamaterials of less practical use in applications like all-optical switching where high transmitted signals are needed. On the other hand, the decrease in the bands separation is due to the fact that, when t
m
is increased, the coupling between the cavities is weakened by the increasingly strong decay of the field in the metal layers. As the coupling decreases, so does the splitting between the cavity modes. The highest FOM values are predicted for the band around λ = 650 nm occurring near the minimum of Im[ɛ
Au]. Furthermore, it is worth to notice that the FOM peak at larger wavelengths is located in proximity of λ
ENZ, which corresponds to a higher local field enhancement in the metamaterial as demonstrated by the strongest peak of ϕ
m
in Figure S7(c), (d) of Supplementary Material, and the spectral position of the FOM peak follows the blueshift of λ
ENZ with increasing t
m
. The curves of the ENZ wavelengths calculated by EMT (dashed green) and ISMM (solid green) nearly follows the same trend with a small divergence (within 2%, see Figure S5(b) in Supplementary Material) over t
m
= 15 nm (marked with the horizontal dashed gray line). As already discussed above, the ENZ condition is essential to enhance the OKE in the metamaterials far from the spectral region associated with the interband contribution of the metal component. This is evidenced in Figure 3(b), (c), where we plot the calculated nonlinear parameters as a function of the metal layers thickness in Au/Al2O3 metamaterials with t
d
= 85 nm. The larger nonlinear response is predicted around λ = 500 nm owing to the high
![Figure 3:
Contour plots of (a, d) the FOM, (b, e) nonlinear absorption coefficient β, and (c, f) nonlinear refractive index n
2 calculated for HMs with 85-nm-thick dielectric layers and different metal layers thickness, arranged in four-period stacks. Panels (a–c) refer to Au/Al2O3 HMs, whereas panels (d–f) to Ag/Al2O3 HMs. The FOM (a, d) is calculated by Eq. (1), whereas β and n
2 are computed by our model using the effective filling fraction [31]. The dashed green curves correspond to the ENZ wavelengths extracted by EMT, whereas the solid green curves represent those extracted by ISMM. The horizontal dashed gray line indicate t
m
= 15 nm.](/document/doi/10.1515/nanoph-2024-0169/asset/graphic/j_nanoph-2024-0169_fig_003.jpg)
Contour plots of (a, d) the FOM, (b, e) nonlinear absorption coefficient β, and (c, f) nonlinear refractive index n 2 calculated for HMs with 85-nm-thick dielectric layers and different metal layers thickness, arranged in four-period stacks. Panels (a–c) refer to Au/Al2O3 HMs, whereas panels (d–f) to Ag/Al2O3 HMs. The FOM (a, d) is calculated by Eq. (1), whereas β and n 2 are computed by our model using the effective filling fraction [31]. The dashed green curves correspond to the ENZ wavelengths extracted by EMT, whereas the solid green curves represent those extracted by ISMM. The horizontal dashed gray line indicate t m = 15 nm.
The FOM and the nonlinear parameters calculated for Ag/Al2O3 metamaterials are shown in Figure 3(d)–(f) for comparison. As discussed above, the resonances observed in the FOM are sharper and higher in absolute value compared to those observed for the Au/Al2O3 stacks, as a consequence of the better decoupling of the PP modes from the interband region of Ag and a larger Hermitian spectral region where they are supported (see Figure S1(d) of Supplementary Material). The bands become progressively less intense and less separated at higher values of t m due to the increasing metallic character of the metamaterials and their larger optical losses. The resonance bands related to the PP modes exist for t m < 40 nm, and the one around λ = 500 nm exhibits the highest FOM values in a region where Im[ɛ Ag] is very low. The modes at larger wavelengths (around λ = 650 nm) are associated with the ENZ regime of the metamaterial, and the band follows the blueshift of λ ENZ with increasing t m . Even in this case the ENZ curves calculated by EMT (dashed green) and ISMM (solid green) approximately overlap (Δλ ENZ = 2 %) up to t m = 15 nm (marked with the horizontal dashed gray line), over which the divergence starts to become more significant, even larger than in the case of Au-based metamaterials (see Figure S5 in Supplementary Material). By comparing the contour plots of the OKE parameters with those of the FOM, local maxima of the nonlinear parameters are found at the same wavelengths where the FOM bands related to the PP modes appear. Compared to the case of Au/Al2O3 metamaterials, these peaks are more distinct due to their better decoupling from the interband absorption region of Ag, which is shifted below λ = 300 nm. Together with the lower optical damping of Ag, this leads to a stronger nonlinear response compared to the Au-based metamaterials. The highest nonlinear parameters are obtained in correspondence of the ENZ wavelength. The peak band of both β and n 2 follows the same trend of the λ ENZ curve, thus blueshifting with growing t m due to the increasing metal filling fraction.
Considering the insights emerged from the use of the FOM, and in order to stress its validity for the design of optimized nonlinear multilayer metamaterials, we experimentally investigate the nonlinear optical response of the produced four-period Au/Al2O3 and Ag/Al2O3 ENZ metamaterials with 15/85 nm layers structure in the visible range around their λ
ENZ by the z-scan technique [55] (see Section 4). The measurements are performed at an average intensity of 350 MW/cm2, chosen to be sufficiently high to activate the nonlinear response of the HM while being below the damage threshold of Au and Ag. In Figure 4 we plot (full symbols) the nonlinear refractive index n
2 (panel a) and nonlinear absorption coefficient β (panel b) measured at normal incidence for AuAlu16 (red) and AgAlu16 (blue). The error bars are determined on the basis of repeated measurements, as well as considering the variability of the parameters in the function used for fitting the experimental z-scan curves with good agreement. In agreement with the simulations shown in Figures 2 and 3, AuAlu16 exhibits a peak of positive n
2 and β around its λ
ENZ = 666 nm, respectively associated with self-focusing (SF) and reverse saturable absorption (RSA). The open aperture (OA) and closed aperture (CA) z-scan curves measured for AuAlu16 at λ
ENZ = 666 nm are reported in Figure S9(a), (b) of Supplementary Material as examples, from which β = 4 × 10⁻⁵ cm/W and n
2 = 3 × 10⁻¹⁰ cm2/W are extracted. The largest nonlinear response (positive β and negative n
2) is observed at λ < 550 nm (red area), namely in the region of gold interband absorption, as a consequence of the large
![Figure 4:
Nonlinear refractive index (a) and nonlinear absorption coefficient (b) of AuAlu16 (red) and AgAlu16 (blue). The experimental data (full symbols) are compared to the curves calculated by our model using the effective filling fraction [31] (solid lines). The measurements are taken at an intensity of 350 MW/cm2. The vertical dashed lines indicate the λ
ENZ of each sample, namely 666 nm for AuAlu16 and 632 nm for AgAlu16. The red area indicates the interband absorption region of gold.](/document/doi/10.1515/nanoph-2024-0169/asset/graphic/j_nanoph-2024-0169_fig_004.jpg)
Nonlinear refractive index (a) and nonlinear absorption coefficient (b) of AuAlu16 (red) and AgAlu16 (blue). The experimental data (full symbols) are compared to the curves calculated by our model using the effective filling fraction [31] (solid lines). The measurements are taken at an intensity of 350 MW/cm2. The vertical dashed lines indicate the λ ENZ of each sample, namely 666 nm for AuAlu16 and 632 nm for AgAlu16. The red area indicates the interband absorption region of gold.
The third-order nonlinear optical properties of ENZ metamaterials has been recently demonstrated to be tunable by changing the polarization and the incidence angle of the exciting light [30], [31]. In particular, in our previous work [31] we demonstrated that in hyperbolic multilayers this effect is due to the modulation of the local field at their inside as a consequence of a change of interaction between the SPPs in the stacked nanocavities with changing angle, an effect being especially evident in the ENZ region far from the metal interband transitions region. Hence, we calculate the FOM for different incidence angles with TE and TM polarizations at λ
ENZ (extracted by ISMM), where the largest nonlinear response is expected. We map the computed FOM as a function of the layers thickness in order to evaluate the potential metamaterial geometries giving enhanced optical nonlinearities at their ENZ wavelength. For example, the FOM contour plots obtained for four-periods Au/Al2O3 HMs are illustrated in Figure 5 for the following configurations: (a) normal incidence, (b) 60° with TE polarization, and (c) 60° with TM polarization. These contour plots can be used as a control box for choosing multilayer configurations with optimized nonlinear optical properties at λ
ENZ. The stars reported with their labels indicate the samples fabricated in the present work. The labels next to the stars are the n
2 values measured experimentally for the considered multilayers. In particular, the yellow and green dashed lines respectively indicate HMs with f
m
= 16% and f
m
= 33 %, having the same λ
ENZ, respectively 666 nm and 543 nm. The data show that at each angle and polarization configuration, the higher is the FOM, the higher is the n
2. The trend of n
2 for these two series of HMs is also shown in the graphs of Figure S11 in Supplementary Material. The measured n
2 and β with their uncertainties for the HMs of this work are reported in Table S2 of Supplementary Material. However, it is worth to distinguish two regions in the countour plots of Figure 5, separated by the white dotted line (corresponding to HMs with f
m
∼ 25%). The HMs above this line have λ
ENZ far from the spectral region of gold interband absorption. Instead, for the HMs below the line, λ
ENZ falls inside this region, where the interband contribution and the large
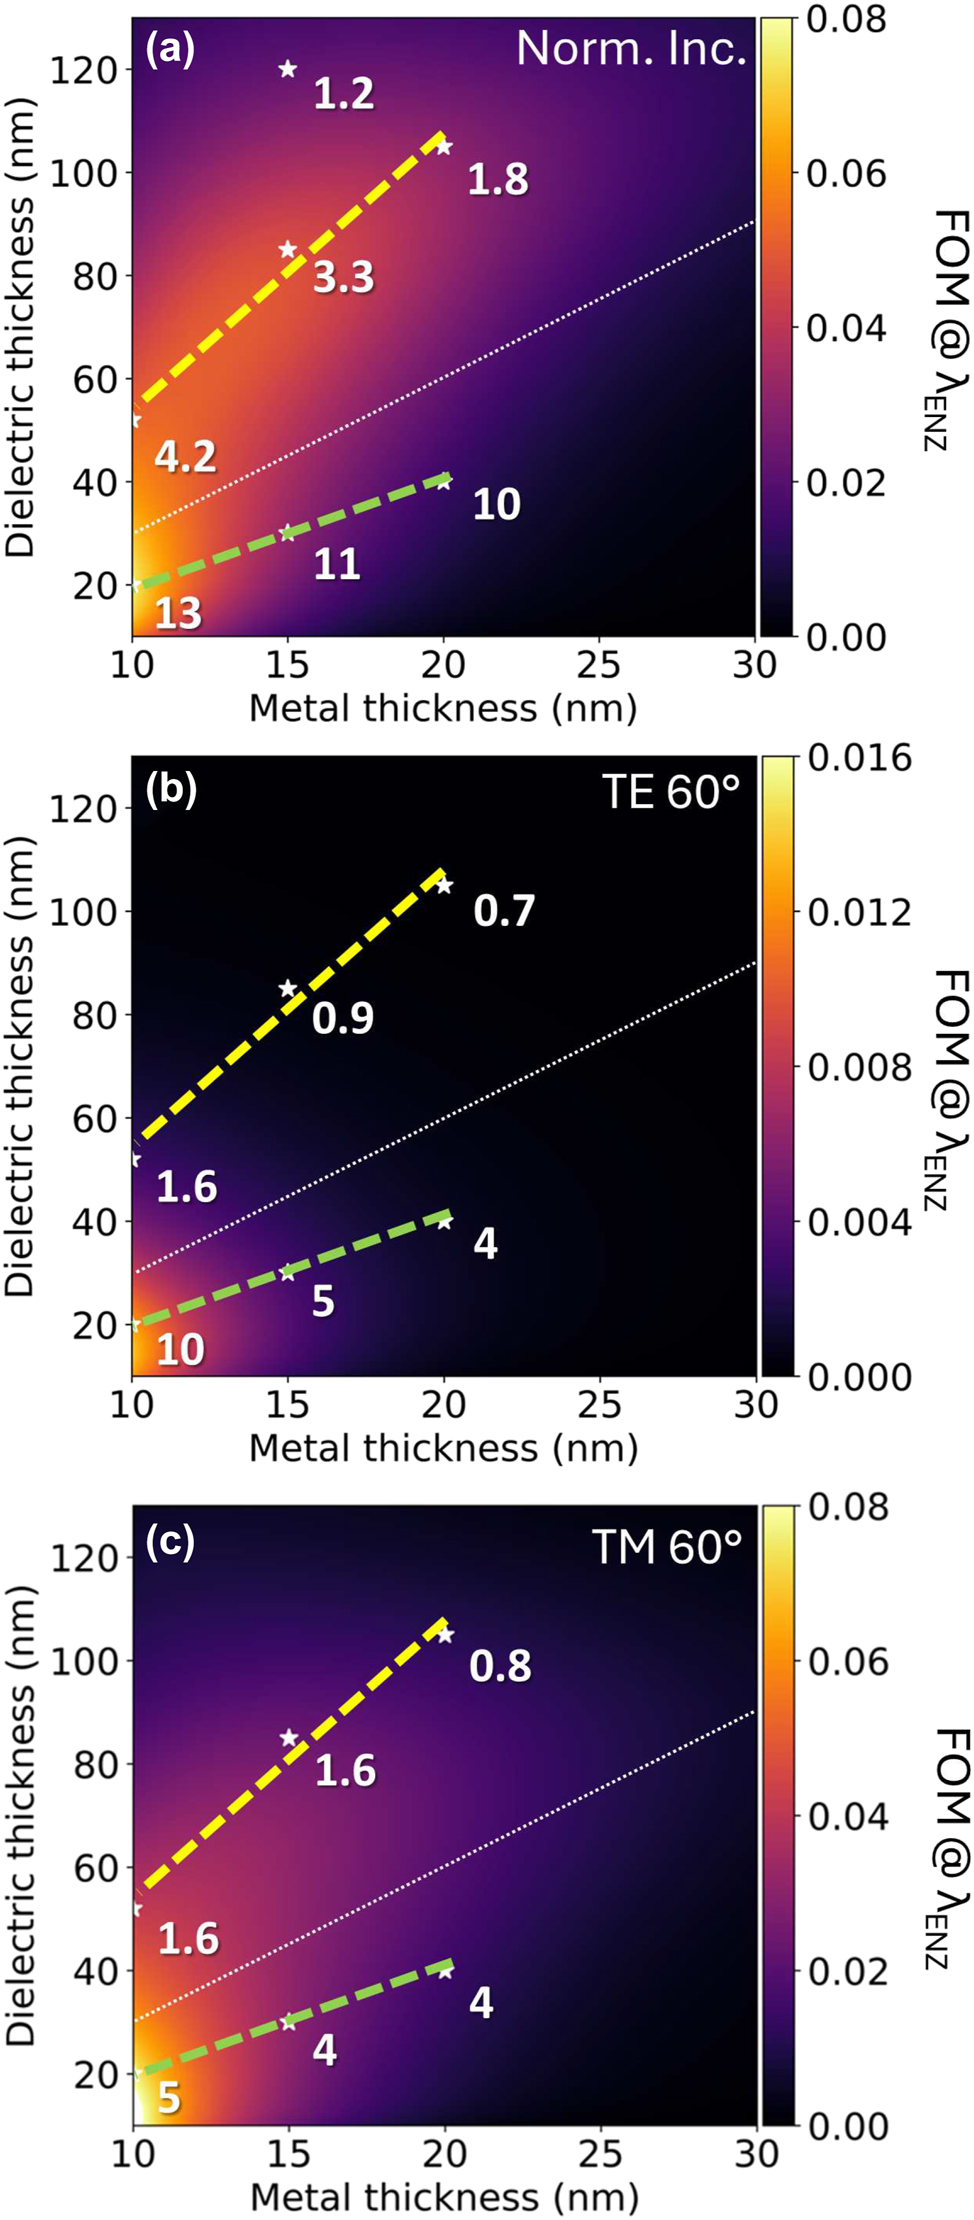
Contour plots of the FOM calculated by Eq. (1) at (a) normal incidence, (b) 60° (TE polarization) and (c) 60° (TM polarization) at the ENZ wavelengths (extracted by ISMM) of four-period Au/Al2O3 HMs with variable thickness layers. The stars indicate the samples fabricated in the present work, and the labels indicate their n 2 (10−10 cm2/W) measured experimentally. The white dotted line separates the geometries having the ENZ regime far from the interband absorption of gold (λ ENZ > 550 nm, above the line), and close to it (λ ENZ < 550 nm, below the line). The yellow dashed line and the green dashed lines respectively are the series of HMs with f m = 16% (λ ENZ = 666 nm) and f m = 33% (λ ENZ = 543 nm).
3 Conclusions
We show how to finely tailor the nonlinear optical properties in multilayer hyperbolic metamaterials by changing their structural and compositional parameters. We evidence that tailoring the ENZ regime in a spectral range where plasmon polariton modes are supported and the optical damping of the metal component approaches its minimum (i.e. far from the interband absorption region) gives rise to high Kerr-like optical nonlinearities, which can be further enhanced in low-loss metamaterials with high index contrast between their metal and dielectric constituents. We introduce one figure of merit to optimize the geometry and composition of multilayer metamaterials, and take full advantage of the local intensity enhancement favoured by the plasmonic effects in the ENZ regime together with high transmission and low losses. The figure of merit provides a predictive tool for the design of ENZ multilayer metamaterials with high Kerr nonlinear optical response to be used at different angles and polarizations, which are enabling for the development of nonlinear optical devices, such as all-optical switches, optical limiters and passive mode-lockers. The outcomes suggest that further studies could be done in hyperbolic metamaterials with ultrathin layers, potentially having boosted nonlinear optical properties owing to quantum size effects. The features included in the FOM can be also useful for a broader range of applications, like optical sensing and radiative decay engineering.
4 Methods
4.1 Numerical methods
The complex anisotropic effective permittivity of multilayer hyperbolic metamaterials is calculated by effective medium theory (EMT) [43] and inverse scattering matrix method (ISMM) [49]. The values of λ ENZ for the considered metamaterials are extracted by the zero-crossing of Re[ɛ ‖], where ɛ ‖ = f m ɛ m + [1 − f m ]ɛ d is the parallel component of the effective permittivity. Here f m is the geometrical metal filling fraction calculated as f m = t m /(t m + t d ), where t m and t d are the thickness of the metal and dielectric layers, respectively.
The linear optical properties of the metamaterials, namely their transmittance (T), reflectance (R) and absorptance (A = 1 − R − T), and the electromagnetic field distribution within them is calculated by the scattering matrix method (SMM) via EMUstack [60].
The nonlinear refractive index and the nonlinear absorption coefficient are calculated as
All the parameters are calculated in the VIS-NIR wavelength range (λ = 300–1000 nm). A sketch of the metamaterial structure implemented for the numerical simulation is depicted in Figure S1(a) of Supplementary Material. The stack is made up of metal and dielectric layers arranged in a four-period structure with the metal on the top of each period. One period corresponds to one metal-dielectric bilayer, that is the unit cell of the metamaterial, which is repeated along the z-axis. The number of periods is chosen since it corresponds to the minimum value for the EMT applicability to be valid [61]. The semi-infinite half-spaces surrounding the stack are air and substrate (glass).
4.2 Samples synthesis and characterization
The synthesis of Au/Al2O3 and Ag/Al2O3 multilayer hyperbolic metamaterials is carried out by magnetron sputtering depositions. Glass substrates are cleaned beforehand in an acidic piranha solution (1:3 H2O2:H2SO4) at 80 °C for 1 h and then rinsed in ultra-pure Milli-Q water. The depositions are performed in an inert Ar atmosphere (p = 5 × 10⁻³ mbar) using a DC source for the metallic targets and a RF one for the dielectric ones. The targets are equipped with mechanical shutters to allow the alternate deposition of the different materials. The sample holder is kept in continuous rotation during the process to promote homogeneity and thickness uniformity of the layers. Thin films of Au, Ag and Al2O3 with the same thickness of the metal and oxide layers in the structural unit (one bilayer) of the metamaterials are also deposited as reference samples.
The structure of the produced multilayers is checked in cross-section with a field-emission scanning electron microscopy (SEM) using a Zeiss Sigma HD FE-SEM. The surface roughness and the total thickness are evaluated by atomic force microscopy (AFM, NT-MDT Solver Pro). The layers thickness is determined by variable-angle spectroscopic ellipsometry (SE, J.A. Wollam V-VASE). Ellipsometric measurements on the reference samples are also carried out to measure the dielectric functions of the constituent materials in the multilayers. The transmittance of the samples is measured with a UV-VIS spectrophotometer (JASCO V670).
4.3 Nonlinear optical characterization
The z-scan technique [55] is used to measure the OKE parameters of the samples, i.e. the nonlinear refractive index n 2 and the nonlinear absorption coefficient β. The third harmonic (λ = 355 nm) of a mode-locked Nd:YAG laser (Leopard, by Continuum) emitting 18 ps pulses with a repetition rate of 10 Hz is used as the pump source. An optical parametric amplifier (TOPAS, by Light Conversion) is employed to spectrally tune the laser beam in the wavelength range 420–2400 nm. Optical density (OD) filters are used to vary the beam intensity. The beam is spatially filtered to obtain a TEM00 Gaussian mode. The beam is focused by a 200 nm converging lens onto the sample, which is mounted on a motorized stage and translated along the focal axis of the lens. The beam waist at the lens focus is w 0 = 19 μm at λ = 600 nm measured by the knife-edge method [62]. A beam splitter is positioned at the end of the motorized stage to send the light transmitted by the sample to two Si photodetectors, allowing simultaneous open aperture (OA) and closed aperture (CA) measurements. The CA detector is preceded by an iris diaphragm with linear transmittance S = 0.3 to make the measurement sensitive to phase distortions. Another beam splitter is positioned before the focusing lens to send half of the input beam to another Si-photodetector, to be used as a reference. This allows the normalization of the CA and OA signals to the reference one, compensating for fluctuations of the input laser intensity. To further minimize signal noise, each point of the scans is collected by averaging at least 150 laser pulses. The measurements are taken at intensities around I = 350 MW/cm2. To account for the fraction of intensity lost by reflection, we estimate I =(1 − R)I 0 as the intensity actually entering the sample and causing its nonlinear response, where I 0 is the intensity of the laser beam at the focus of the lens, and R is the reflectance of the sample at each considered wavelength. The OKE parameters β and n 2 are evaluated by fitting the normalized transmittance curves from the OA and CA lines (T OA and T CA), respectively, using the method described in Ref. [31]. Z-scan measurements are also performed on the reference samples in order to evaluate the nonlinear response of the individual components of the multilayers.
Funding source: Italian MUR Departments of Excellence
Award Identifier / Grant number: Grant “Quantum Frontiers” 2023-2027
Funding source: Dipartimento di Fisica e Astronomia, Università degli Studi di Padova
Award Identifier / Grant number: PRD-BIRD2022-Cesca
Acknowledgments
The authors thank Dr. Carlo Scian for the technical support in the nanofabrication and SEM characterization, and Dr. Ionut Gabriel Balasa for the help with the EMUstack software.
-
Research funding: The work was supported by the Department of Physics and Astronomy at the University of Padua with the project PRD-BIRD22-Cesca, and it is supported in part by the Italian MUR Departments of Excellence grant 2023-2027 “Quantum Frontiers”.
-
Author contributions: Experimental investigation – DG and FD; coding, simulations, data analysis and visualization – DG and FD; writing – DG (original draft) and FD; review – TC and GM; editing – DG and TC; conceptualization – DG, TC and GM; supervision – TC and GM; project administration – TC and GM. All authors have accepted responsibility for the entire content of this manuscript and approved its submission.
-
Conflict of interest: Authors state no conflicts of interest.
-
Informed consent: Informed consent was obtained from all individuals included in this study.
-
Ethical approval: The conducted research is not related to either human or animals use.
-
Data availability: The datasets generated during and/or analyzed during the current study are available from the corresponding author on reasonable request.
References
[1] A. F. Koenderink, A. Alù, and A. Polman, “Nanophotonics: shrinking light-based technology,” Science, vol. 348, no. 6234, pp. 516–521, 2015. https://doi.org/10.1126/science.1261243.Search in Google Scholar PubMed
[2] S. A. Mann, et al.., “Ultrafast optical switching and power limiting in intersubband polaritonic metasurfaces,” Optica, vol. 8, no. 5, pp. 606–613, 2021. https://doi.org/10.1364/optica.415581.Search in Google Scholar
[3] H. Qian, et al.., “Nanoscale optical pulse limiter enabled by refractory metallic quantum wells,” Sci. Adv., vol. 6, no. 20, pp. 1–7, 2020. https://doi.org/10.1126/sciadv.aay3456.Search in Google Scholar PubMed PubMed Central
[4] M. Rahmani, et al.., “Nonlinear frequency conversion in optical nanoantennas and metasurfaces: materials evolution and fabrication,” Opto-Electron. Adv., vol. 1, no. 10, pp. 1–12, 2018. https://doi.org/10.29026/oea.2018.180021.Search in Google Scholar
[5] N. Engheta, “Circuits with light at nanoscales: optical nanocircuits inspired by metamaterials,” Science, vol. 317, no. 5845, pp. 1698–1702, 2007. https://doi.org/10.1126/science.1133268.Search in Google Scholar PubMed
[6] L. Vertchenko, M. Nikitin, and A. Lavrinenko, “Near-zero-index platform in photonics: tutorial,” J. Opt. Soc. Am. B, vol. 40, no. 6, p. 1467, 2023. https://doi.org/10.1364/josab.489055.Search in Google Scholar
[7] N. Kinsey, C. DeVault, A. Boltasseva, and V. M. Shalaev, “Near-zero-index materials for photonics,” Nat. Rev. Mater., vol. 4, no. 12, pp. 742–760, 2019. https://doi.org/10.1038/s41578-019-0133-0.Search in Google Scholar
[8] O. Reshef, I. D. Leon, M. Z. Alam, and R. W. Boyd, “Nonlinear optical effects in epsilon-near-zero media,” Nat. Rev. Mater., vol. 4, no. 8, pp. 535–551, 2019. https://doi.org/10.1038/s41578-019-0120-5.Search in Google Scholar
[9] X. Niu, X. Hu, S. Chu, and Q. Gong, “Epsilon-near-zero photonics: a new platform for integrated devices,” Adv. Opt. Mater., vol. 6, no. 10, pp. 1–36, 2018. https://doi.org/10.1002/adom.201701292.Search in Google Scholar
[10] A. Alù, M. G. Silveirinha, A. Salandrino, and N. Engheta, “Epsilon-near-zero metamaterials and electromagnetic sources: tailoring the radiation phase pattern,” Phys. Rev. B, vol. 75, no. 15, pp. 1–13, 2007. https://doi.org/10.1103/physrevb.75.155410.Search in Google Scholar
[11] M. Silveirinha and N. Engheta, “Tunneling of electromagnetic energy through subwavelength channels and bends using ɛ-near-zero materials,” Phys. Rev. Lett., vol. 97, no. 15, pp. 157403–157410, 2006. https://doi.org/10.1103/physrevlett.97.157403.Search in Google Scholar PubMed
[12] I. Liberal and N. Engheta, “Near-zero refractive index photonics,” Nat. Photonics, vol. 11, no. 3, pp. 149–158, 2017. https://doi.org/10.1038/nphoton.2017.13.Search in Google Scholar
[13] E. Galiffi, et al.., “Photonics of time-varying media,” Adv. Photonics, vol. 4, no. 1, pp. 1–32, 2022. https://doi.org/10.1117/1.ap.4.1.014002.Search in Google Scholar
[14] A. R. Rashed, B. C. Yildiz, S. R. Ayyagari, and H. Caglayan, “Hot electron dynamics in ultrafast multilayer epsilon-near-zero metamaterials,” Phys. Rev. B, vol. 101, no. 16, p. 165301, 2020. https://doi.org/10.1103/physrevb.101.165301.Search in Google Scholar
[15] A. D. Neira, G. A. Wurtz, P. Ginzburg, and A. V. Zayats, “Ultrafast all-optical modulation with hyperbolic metamaterial integrated in Si photonic circuitry,” Opt. Express, vol. 22, no. 9, p. 10987, 2014. https://doi.org/10.1364/oe.22.010987.Search in Google Scholar PubMed
[16] Z. Chai, X. Hu, F. Wang, X. Niu, J. Xie, and Q. Gong, “Ultrafast all-optical switching,” Adv. Opt. Mater., vol. 5, no. 7, 2017. https://doi.org/10.1002/adom.201600665.Search in Google Scholar
[17] J. Kuttruff, et al.., “Ultrafast all-optical switching enabled by epsilon-near-zero-tailored absorption in metal-insulator nanocavities,” Commun. Phys., vol. 3, no. 1, pp. 1–7, 2020. https://doi.org/10.1038/s42005-020-0379-2.Search in Google Scholar
[18] Y. Yang, et al.., “Femtosecond optical polarization switching using a cadmium oxide-based perfect absorber,” Nat. Photonics, vol. 11, no. 6, pp. 390–395, 2017. https://doi.org/10.1038/nphoton.2017.64.Search in Google Scholar
[19] C. Fruhling, M. G. Ozlu, S. Saha, A. Boltasseva, and V. M. Shalaev, “Understanding all-optical switching at the epsilon-near-zero point: a tutorial review,” Appl. Phys. B Lasers Opt., vol. 128, no. 2, pp. 1–12, 2022. https://doi.org/10.1007/s00340-022-07756-4.Search in Google Scholar
[20] Z. T. Xie, Y. Sha, J. Wu, H. Y. Fu, and Q. Li, “Ultrafast dynamic switching of optical response based on nonlinear hyperbolic metamaterial platform,” Opt. Express, vol. 30, no. 12, pp. 21634–21636, 2022. https://doi.org/10.1364/oe.457875.Search in Google Scholar
[21] D. England, et al.., “Perspectives on all-optical Kerr switching for quantum optical applications,” Appl. Phys. Lett., vol. 119, no. 16, 2021. https://doi.org/10.1063/5.0065222.Search in Google Scholar
[22] M. Z. Alam, I. D. Leon, and R. W. Boyd, “Large optical nonlinearity of indium tin oxide in its epsilon-near-zero region,” Science, vol. 352, no. 6287, pp. 795–797, 2016. https://doi.org/10.1126/science.aae0330.Search in Google Scholar PubMed
[23] L. Caspani, et al.., “Enhanced nonlinear refractive index in ϵ-near-zero materials,” Phys. Rev. Lett., vol. 116, no. 23, pp. 233901–233906, 2016. https://doi.org/10.1103/physrevlett.116.233901.Search in Google Scholar PubMed
[24] S. Suresh, O. Reshef, M. Z. Alam, J. Upham, M. Karimi, and R. W. Boyd, “Enhanced nonlinear optical responses of layered epsilon-near-zero metamaterials at visible frequencies,” ACS Photonics, vol. 8, no. 1, pp. 125–129, 2021. https://doi.org/10.1021/acsphotonics.0c01178.Search in Google Scholar
[25] L. Vertchenko and A. Lavrinenko, “Implications of low-refractive mode index on nonlinear optical interactions,” Laser Photonics Rev., vol. 17, no. 9, pp. 1–7, 2023. https://doi.org/10.1002/lpor.202200741.Search in Google Scholar
[26] A. Poddubny, I. Iorsh, P. Belov, and Y. Kivshar, “Hyperbolic metamaterials,” Nat. Photonics, vol. 7, no. 12, pp. 948–957, 2013. https://doi.org/10.1038/nphoton.2013.243.Search in Google Scholar
[27] H. N. S. Krishnamoorthy, Z. Jacob, E. Narimanov, I. Kretzschmar, and V. M. Menon, “Topological transitions in metamaterials,” Science, vol. 336, no. 6078, pp. 205–209, 2012. https://doi.org/10.1126/science.1219171.Search in Google Scholar PubMed
[28] R. Maas, J. Parsons, N. Engheta, and A. Polman, “Experimental realization of an epsilon-near-zero metamaterial at visible wavelengths,” Nat. Photonics, vol. 7, no. 11, pp. 907–912, 2013. https://doi.org/10.1038/nphoton.2013.256.Search in Google Scholar
[29] R. M. Kaipurath, et al.., “Optically induced metal-to-dielectric transition in epsilon-near-zero metamaterials,” Sci. Rep., vol. 6, no. 1, pp. 1–7, 2016. https://doi.org/10.1038/srep27700.Search in Google Scholar PubMed PubMed Central
[30] A. D. Neira, N. Olivier, M. E. Nasir, W. Dickson, G. A. Wurtz, and A. V. Zayats, “Eliminating material constraints for nonlinearity with plasmonic metamaterials,” Nat. Commun., vol. 6, no. 1, pp. 1–8, 2015. https://doi.org/10.1038/ncomms8757.Search in Google Scholar PubMed PubMed Central
[31] D. Genchi, I. G. Balasa, T. Cesca, and G. Mattei, “Tunable third-order nonlinear optical response in ϵ-near-zero multilayer metamaterials,” Phys. Rev. Appl., vol. 16, no. 6, p. 064020, 2021. https://doi.org/10.1103/physrevapplied.16.064020.Search in Google Scholar
[32] M. Shoaei, M. K. Moravvej-Farshi, and L. Yousefi, “All-optical switching of nonlinear hyperbolic metamaterials in visible and near-infrared regions,” J. Opt. Soc. Am. B, vol. 32, no. 11, p. 2358, 2015. https://doi.org/10.1364/josab.32.002358.Search in Google Scholar
[33] N. Vasilantonakis, M. E. Nasir, W. Dickson, G. A. Wurtz, and A. V. Zayats, “Bulk plasmon-polaritons in hyperbolic nanorod metamaterial waveguides,” Laser Photonics Rev., vol. 9, no. 3, pp. 345–353, 2015. https://doi.org/10.1002/lpor.201570070.Search in Google Scholar
[34] I. Avrutsky, I. Salakhutdinov, J. Elser, and V. Podolskiy, “Highly confined optical modes in nanoscale metal-dielectric multilayers,” Phys. Rev. B, vol. 75, no. 24, pp. 2–5, 2007. https://doi.org/10.1103/physrevb.75.241402.Search in Google Scholar
[35] S. V. Zhukovsky, O. Kidwai, and J. E. Sipe, “Physical nature of volume plasmon polaritons in hyperbolic metamaterials,” Opt. Express, vol. 21, no. 12, p. 14982, 2013. https://doi.org/10.1364/oe.21.014982.Search in Google Scholar PubMed
[36] M. Mahmoodi, S. H. Tavassoli, O. Takayama, J. Sukham, R. Malureanu, and A. V. Lavrinenko, “Existence conditions of high-k modes in finite hyperbolic metamaterials,” Laser Photonics Rev., vol. 13, no. 3, pp. 1–12, 2019. https://doi.org/10.1002/lpor.201800253.Search in Google Scholar
[37] W. D. Newman, C. L. Cortes, J. Atkinson, S. Pramanik, R. G. DeCorby, and Z. Jacob, “Ferrell–Berreman modes in plasmonic epsilon-near-zero media,” ACS Photonics, vol. 2, no. 1, pp. 2–7, 2015. https://doi.org/10.1021/ph5003297.Search in Google Scholar
[38] N. Maccaferri, T. Isoniemi, M. Hinczewski, M. Iarossi, G. Strangi, and F. D. Angelis, “Designer Bloch plasmon polariton dispersion in grating-coupled hyperbolic metamaterials,” APL Photonics, vol. 5, no. 7, p. 076109, 2020. https://doi.org/10.1063/5.0008687.Search in Google Scholar
[39] J. Schilling, “Uniaxial metallo-dielectric metamaterials with scalar positive permeability,” Phys. Rev. E – Stat. Nonlinear Soft Matter Phys., vol. 74, no. 4, pp. 1–8, 2006. https://doi.org/10.1103/physreve.74.046618.Search in Google Scholar PubMed
[40] L. Y. Beliaev, O. Takayama, P. N. Melentiev, and A. V. Lavrinenko, “Photoluminescence control by hyperbolic metamaterials and metasurfaces: a review,” Opto-Electron. Adv., vol. 4, no. 8, 2021. https://doi.org/10.29026/oea.2021.210031.Search in Google Scholar
[41] K. V. Sreekanth, et al.., “Extreme sensitivity biosensing platform based on hyperbolic metamaterials,” Nat. Mater., vol. 15, no. 6, pp. 621–627, 2016. https://doi.org/10.1038/nmat4609.Search in Google Scholar PubMed PubMed Central
[42] P. B. Johnson and R. W. Christy, “Optical constant of the nobel metals,” Phys. Rev. B, vol. 6, no. 12, pp. 4370–4379, 1972. https://doi.org/10.1103/physrevb.6.4370.Search in Google Scholar
[43] T. Tumkur, Y. Barnakov, S. T. Kee, M. A. Noginov, and V. Liberman, “Permittivity evaluation of multilayered hyperbolic metamaterials: ellipsometry vs. reflectometry,” J. Appl. Phys., vol. 117, no. 10, 2015. https://doi.org/10.1063/1.4914524.Search in Google Scholar
[44] V. Caligiuri, M. Palei, G. Biffi, and R. Krahne, “Hybridization of epsilon-near-zero modes via resonant tunneling in layered metal-insulator double nanocavities,” Nanophotonics, vol. 8, no. 9, pp. 1505–1512, 2019. https://doi.org/10.1515/nanoph-2019-0054.Search in Google Scholar
[45] V. Caligiuri, M. Palei, G. Biffi, S. Artyukhin, and R. Krahne, “A semi-classical view on epsilon-near-zero resonant tunneling modes in metal/insulator/metal nanocavities,” Nano Lett., vol. 19, no. 5, pp. 3151–3160, 2019. https://doi.org/10.1021/acs.nanolett.9b00564.Search in Google Scholar PubMed
[46] V. Caligiuri, G. Biffi, A. Patra, R. D. Pothuraju, A. D. Luca, and R. Krahne, “One-dimensional epsilon-near-zero crystals,” Adv. Photonics Res., vol. 2, no. 7, p. 2100053, 2021. https://doi.org/10.1002/adpr.202100053.Search in Google Scholar
[47] K. V. Sreekanth, A. D. Luca, and G. Strangi, “Experimental demonstration of surface and bulk plasmon polaritons in hypergratings,” Sci. Rep., vol. 3, no. 1, pp. 1–7, 2013.10.1038/srep03291Search in Google Scholar PubMed PubMed Central
[48] V. Caligiuri, M. Palei, M. Imran, L. Manna, and R. Krahne, “Planar double-epsilon-near-zero cavities for spontaneous emission and Purcell effect enhancement,” ACS Photonics, vol. 5, no. 6, pp. 2287–2294, 2018. https://doi.org/10.1021/acsphotonics.8b00121.Search in Google Scholar PubMed PubMed Central
[49] G. T. Papadakis, P. Yeh, and H. A. Atwater, “Retrieval of material parameters for uniaxial metamaterials,” Phys. Rev. B, vol. 91, no. 15, pp. 1–12, 2015. https://doi.org/10.1103/physrevb.91.155406.Search in Google Scholar
[50] R. W. Boyd, Z. Shi, and I. D. Leon, “The third-order nonlinear optical susceptibility of gold,” Opt. Commun., vol. 326, pp. 74–79, 2014, https://doi.org/10.1016/j.optcom.2014.03.005.Search in Google Scholar
[51] K. J. Palm, et al.., “Achieving scalable near-zero-index materials,” Adv. Photonics Res., vol. 3, no. 9, pp. 1–7, 2022. https://doi.org/10.1002/adpr.202200109.Search in Google Scholar
[52] O. Lysenko, M. Bache, and A. Lavrinenko, “Third-order susceptibility of gold for ultrathin layers,” Opt. Lett., vol. 41, no. 2, p. 317, 2016. https://doi.org/10.1364/ol.41.000317.Search in Google Scholar
[53] N. N. Lepeshkin, A. Schweinsberg, G. Piredda, R. S. Bennink, and R. W. Boyd, “Enhanced nonlinear optical response of one-dimensional metal-dielectric photonic crystals,” Phys. Rev. Lett., vol. 93, no. 12, pp. 1–4, 2004. https://doi.org/10.1103/physrevlett.93.123902.Search in Google Scholar PubMed
[54] C. L. Cortes, W. Newman, S. Molesky, and Z. Jacob, “Quantum nanophotonics using hyperbolic metamaterials,” J. Opt., vol. 14, no. 6, p. 063001, 2012. https://doi.org/10.1088/2040-8978/14/6/063001.Search in Google Scholar
[55] M. Sheik-Bahae, A. A. Said, T. H. Wei, D. J. Hagan, and E. W. V. Stryland, “Sensitive measurement of optical nonlinearities using a single beam,” IEEE J. Quantum Electron., vol. 26, no. 4, pp. 760–769, 1990. https://doi.org/10.1109/3.53394.Search in Google Scholar
[56] K. M. McPeak, et al.., “Plasmonic films can easily be better: rules and recipes,” ACS Photonics, vol. 2, no. 3, pp. 326–333, 2015. https://doi.org/10.1021/ph5004237.Search in Google Scholar PubMed PubMed Central
[57] R. A. Maniyara, et al.., “Tunable plasmons in ultrathin metal films,” Nat. Photonics, vol. 13, no. 5, pp. 328–333, 2019. https://doi.org/10.1038/s41566-019-0366-x.Search in Google Scholar
[58] J. Sukham, O. Takayama, A. V. Lavrinenko, and R. Malureanu, “High-quality ultrathin gold layers with an APTMS adhesion for optimal performance of surface plasmon polariton-based devices,” ACS Appl. Mater. Interfaces, vol. 9, no. 29, pp. 25049–25056, 2017. https://doi.org/10.1021/acsami.7b07181.Search in Google Scholar PubMed
[59] H. Qian, Y. Xiao, and Z. Liu, “Giant Kerr response of ultrathin gold films from quantum size effect,” Nat. Commun., vol. 7, no. 1, p. 13153, 2016. https://doi.org/10.1038/ncomms13153.Search in Google Scholar PubMed PubMed Central
[60] B. C. Sturmberg, et al.., “EMUstack: an open source route to insightful electromagnetic computation via the bloch mode scattering matrix method,” Comput. Phys. Commun., vol. 202, pp. 276–286, 2016. https://doi.org/10.1016/j.cpc.2015.12.022.Search in Google Scholar
[61] J. Sukham, et al.., “Investigation of effective media applicability for ultrathin multilayer structures,” Nanoscale, vol. 11, no. 26, pp. 12582–12588, 2019. https://doi.org/10.1039/c9nr02471a.Search in Google Scholar PubMed
[62] J. M. Khosrofian and B. A. Garetz, “Measurement of a Gaussian laser beam diameter through the direct inversion of knife-edge data,” Appl. Opt., vol. 22, no. 21, p. 3406, 1983. https://doi.org/10.1364/ao.22.003406.Search in Google Scholar PubMed
Supplementary Material
This article contains supplementary material (https://doi.org/10.1515/nanoph-2024-0169).
© 2024 the author(s), published by De Gruyter, Berlin/Boston
This work is licensed under the Creative Commons Attribution 4.0 International License.
Articles in the same Issue
- Frontmatter
- Editorial
- Current trends in nanophotonics
- Review
- Applications of surface enhanced Raman scattering (SERS) spectroscopy for detection of nucleic acids
- Research Articles
- Design of optical Kerr effect in multilayer hyperbolic metamaterials
- A tiny Drude scatterer can accurately model a coherent emitter in nanophotonics
- Strong coupling spontaneous emission interference near a graphene nanodisk
- Long-range molecular energy transfer mediated by strong coupling to plasmonic topological edge states
- Thermal radiation forces on planar structures with asymmetric optical response
- Molecular surface coverage standards by reference-free GIXRF supporting SERS and SEIRA substrate benchmarking
- Effect of magnesium doping on NiO hole injection layer in quantum dot light-emitting diodes
- Anomalous reflection for highly efficient subwavelength light concentration and extraction with photonic funnels
- Nanometric probing with a femtosecond, intra-cavity standing wave
- Considerations for electromagnetic simulations for a quantitative correlation of optical spectroscopy and electron tomography of plasmonic nanoparticles
- Free-electron coupling to surface polaritons mediated by small scatterers