Chemiluminescent carbon nanodots as sensors for hydrogen peroxide and glucose
-
Cheng-Long Shen
 ,
Yang-Li Ye
,
Yang-Li Ye

Abstract
Hydrogen peroxide (H2O2) is an important product generated in the body and related to many pathophysiological processes and glucose metabolism disorder can cause many fatal diseases in living bodies. Therefore, the sensing of H2O2 and glucose is of great significance in disease diagnostics and treatment. Fluorescent carbon dots (CDs) are one new class of nanoprobes for H2O2 and glucose. Nevertheless, the CD-based sensor is always based on its fluorescence response, which is influenced by the auto-fluorescent interference. Herein, efficient fluorescent CDs were synthesized by one-pot solvothermal method, and the CDs exhibit bright and persistent deep-red (DR) chemiluminescence (CL) in bis(2,4,6-trichlorophenyl) oxalate and H2O2 solution with a CL quantum yield of (8.22 ± 0.30) × 10−3, which is amongst the highest values in ever reported nanomaterials for chemical analysis. Employing the CDs as CL nanoprobes, sensitive sensing for H2O2 has been achieved with a detection limit of 11.7 μM, and further for glucose detection with a detection limit of 12.6 μM. The DR CL CDs is promising to be applied in blood glucose analysis or in vivo biosensor.
1 Introduction
Glucose, as the primary fuel for glycolysis and the downstream pathways of aerobic and anaerobic respiration, is served as an energy reserve in most organisms and responsible to generate enough energy for growth and reproduction. The diseases of glucose metabolism, such as diabetes, glycogenosis, and hypoglycemia, have been one of the most serious diseases threatening human health [1], [2], [3], [4]. Moreover, hydrogen peroxide (H2O2) is a product of glucose/glucose oxidase (GOD) reaction and the sensing strategy through detecting the H2O2 with GOD has been developed as one promising approach for the detection of glucose [5], [6], [7], [8]. Fluorescent carbon nanodots (CDs), known as their high photoluminescence (PL) quantum yield (QY), unique chemical stability, tunable emissive wavelength, good low-cost and excellent bio-compatibility, have found applications in optoelectronics devices, bioimaging, photocatalysis, and chemical sensors, etc. [9], [10], [11], [12], [13], [14], [15], [16], [17]. For instance, Zhang et al. prepared a selective sensor for cyanide ion (CN−) with CDs as the fluorophore. And Sooksin et al. designed a highly selective fluorescent enhancement CDs as sensor for Al3+ [10], [11]. Recently, there are several researchers reporting the CDs-based sensor for H2O2 and glucose sensing [6], [18]. Nevertheless, the CDs-based sensors are always based on its fluorescence response, which is influenced by the auto-fluorescent interference and need quite expensive instrument. Therefore, it is significant to develop more facile and low-cost analytic technology with the luminescent CDs.
Chemiluminescence (CL), in which light emission is induced by chemical reactions, has been widely used for chemical detection and bioanalysis due to its high efficiency, low detection limit, simple analysis instrument, low background interference, etc. [3], [19], [20], [21], [22], [23], [24], [25], [26], [27], [28], [29], [30], [31], [32], [33]. Recently, various CD-based CL in different chemical reaction has been observed and reported [34], [35], [36], [37], [38], [39]. For example, Lin et al. reported the CL of CDs in NaNO2–H2O2 solution and Dong et al. observed the CL of CDs in alkali solution [34], [35]. Moreover, the CL induced by the CL emitter, peroxalate fuel and H2O2 has been used to sense and image H2O2 and glucose in vitro and in vivo in recently years [20], [21], [22], [23], [24], [25], [26], [27], [28], [29]. Nevertheless, the CL emitter in peroxalate–H2O2 reaction is always limited in organic small-molecular dyes, such as Rhodamine B, Rhodamine 6G and Pentacene, most of which encounter serious obstacles in practical application due to their potential biotoxicity, low photostability, or poor bio-compatibility. Without potential biotoxicity, CDs can be acted as reporter in the CL system to realize the application of analysis and detection. Besides, CDs exhibit excellent light emission ability and the luminescence properties can be tuned by different methods. Especially, the CDs with emission wavelength at deep-red region can be prepared with different method, which is suit for biosensing due to the deep tissue penetration. Besides, the abundant surface radicals and good biocompatibility endow CDs as potential sensing ability and low risk when used. With the CDs as chemiluminescent sensor for H2O2 and glucose with peroxalate, it is facile to achieve the all-in-one nanoreporters with high sensitivity and adaptability in biological detection [20], [21], [22], [23], [24]. Therefore, it is very promising to develop the CDs as CL emitter to sensors H2O2 and glucose through the CL reaction of peroxalate and H2O2.
In this work, fluorescent CDs have been synthesized with one-pot solvothermal method by using citric acid, urea and N,N-diethylformamide (DMF) as reagents and solvents. The fluorescent CDs exhibit bright deep-red (DR) fluorescence under the illumination of 365 nm UV lamp, and bright DR CL after added into the mixture of bis(2,4,6-trichlorophenyl) oxalate (TCPO) and H2O2. The CD-based CL exhibit a CL QY of (8.22 ± 0.30) × 10−3, which is amongst the highest values in ever reported nanomaterials for chemical analysis. With the CDs as probe in a CL analysis instrument, sensitive sensing for H2O2 has been achieved with a detection limit of 11.7 μM, and further for glucose detection with a detection limit of 12.6 μM. With emission wavelength at DR region, the CDs-based CL is promising to be applied in blood glucose analysis and in vivo biosensor.
2 Experimental
2.1 Materials
The chemicals reagents were analytical grade and used as received without further purification.
2.2 Synthesis of the chemiluminescent CDs
The CDs were synthesized by citric, urea and DMF with one-pot solvothermal method. Herein, 1 g citric acid and 2 g urea were dispersed into 10 mL DMF solvent. And the mixtures were added into Teflon-lined stainless autoclave (20 mL). Then the sealed autoclave vessel was placed into an electric oven, which was set at 160 °C and hold for 4 h. The CDs solution was treated with 8000 rpm min−1 centrifugal to remove the solid. And then the supernatant was re-dispersed in 50 mL absolute ethanol and acquired the CDs powder with 8000 rpm min−1 centrifugation for three times. The CDs powder was dried and re-dispersed into ethanol (3 mg mL−1) for using.
2.3 Characterization
The surface morphology of the CD was characterized by a high-resolution transmission electron microscope (HRTEM, JEOL JSM-IT100) and scanning electron microscope (SEM, JSM-6700F). The dynamic light scattering (DLS) was obtained on a Zetasizer Nano ZS laser particle size analyzer (Malvern). The absorption spectrum of the CDs was measured on a Hitachi UH-4150 UV–VIS–NIR spectrophotometer. The fluorescence spectrum of the CDs solution was measured by a spectrophotometer (Hitachi F-7000). The fluorescence lifetime and quantum yield of the CDs solution was measured by Horiba FL-322 using a 370 nm Nano-LED monitoring the emission at 654 nm. The Fourier transform infrared spectrum (FTIR) of the CDs was recorded on a Bio-Rad Excalibur spectrometer (Bruker vector 22). X-ray photoelectron spectroscopy (XPS) was captured by the (Thermo Scientific K-Alpha) XPS spectrometer.
2.4 CL induced by the CDs
The CL spectrum was measured by the F-7000 spectrophotometer with the lamp off. Herein, the CL spectrum was measured after 10 s of adding 1 mL CD ethyl alcohol solution (3 mg mL−1) into the mixture of 1 mL TCPO ethyl acetate solution (0.2 mM) and 1 mL H2O2 ethanol solution (0.01 M).
The CL intensity detection was conducted on a laboratory-built flow injection CL system, which was consisted of an IFFM-E flow injection system (Ruimai Electronic Science Co., China), Photomultiplier tube (PMT), IFFS-A luminometer (Ruimai Electronic Science Co.) and a computer. The CL signals were monitored by the PMT adjacent to the flow CL cell. The relationship between CL signals and the concentration of three reactants was measured in this work. 30% H2O2 was dispersed in ethyl alcohol for different concentrations (1, 0.25, 0.125, 0.0625, 0.03125, and 0.015625 M). TCPO was dispersed into ethyl acetate for different concentrations (2, 1, 0.5, 0.25, and 0.125 mM). CDs were dispersed into ethyl alcohol for different concentrations (3, 1.5, 0.75, 0.325, and 0.1526 mg mL−1). Three flow lines were used for CL flow-injection system. TCPO was firstly mixed with CD solution and H2O2 was then mixed with the mixture in the cell. With different concentrations of reactant, the CL intensity signals were recorded by the PMT.
2.5 CL analysis
The strategy of sensing H2O2 was shown as follow: 30% H2O2 aqueous was dispersed in aqueous for different concentration (0, 1, 5, 15, 25, and 50 mM), 1.2 mg mL−1 CDs ethyl alcohol solution was selected as probe and 10 mg mL−1 TCPO ethyl acetate solution was used as reactant. Then, three flow lines were used for CL flow-injection system. TCPO was firstly mixed with CDs solution and then the sample was mixed with the mixture in the cell. With different concentrations of H2O2, the CL intensity signals were recorded by the PMT.
For glucose sensing, glucose was dispersed in aqueous for different concentrations (0, 1, 5, 10, 15, and 50 mM). The glucose oxidase was added into the solution and dispersed for 0.45 μg mL−1. The mixture of glucose and glucose oxidase was treated at 40 °C for 30 min. Then, three flow lines were used for CL flow-injection system using the mixture as sample as similar as H2O2 sensing
3 Results and discussion
In this work, the CDs are synthesized by citric, urea, and DMF reacted as illustrated in Section 2. As shown in Figure 1a, transmission electron microscopy (TEM) is employed to investigate the morphologies and the CDs display a broad size distribution of 3.9 ± 2.6 nm. The high-resolution TEM (HRTEM) image reveals a well-resolved lattice spacing of 0.21 nm, corresponding to the (100) crystallographic plane of graphitic carbon. Besides, the dynamic light scattering (DLS) of the CDs aqueous solution illustrates a hydrodynamic diameter of 3.2 ± 2.4 nm, which is in accordance with the TEM results shown in Figure 1b. The X-ray diffraction (XRD) pattern (Figure 1c) exhibits a broad peak at 23°, which is attributed to the graphitic structure with spacing (100). And the sharp peak at 27° can be attributed to the graphitic structure with interlayer spacing (002). Raman spectrum of the CDs (Figure 1d) illustrates a large intensity ratio of G band (1580 cm−1) to D band (1350 cm−1) of about 1:1, revealing high degree of crystallinity of the CDs [14]. Moreover, the chemical composition and functional groups of the CDs have been investigated by FTIR and XPS. As shown in Figure 1e, the FTIR peaks around 3420 and 3200 cm−1 can be attributed to the stretching vibration of O–H and N–H, and the peaks around 1670, 1600, and 1400 cm−1 are attributed to the stretching vibration of C=O, C=C, and C–O/C–N. The survey XPS spectrum reveals the composition of C (284.0 eV), N (400.0 eV), and O (532.4 eV) elements as illustrated in Figure 1f, which is consistent with the FTIR analysis. The C1s envelope can be deconvoluted into three Gaussian peaks corresponding to sp2 C (C–C/C=C) at 284.3 eV, sp3 C (C–N) at 285.0 eV, and (C=O)–O at 287.7 eV. Moreover, the high-resolution XPS N1s spectrum can be deconvoluted into two Gaussian peaks corresponding to amino N at 399.1 eV and pyrrolic N at 399.8 eV and the O1s envelope can be deconvoluted into two Gaussian peaks corresponding to Quinone O at 530.9 eV and Carbonyl O at 531.8 eV (Figure S1). The FTIR and XPS survey imply the –COOH, –OH, and –NH2 functional group on the surface of the CDs.
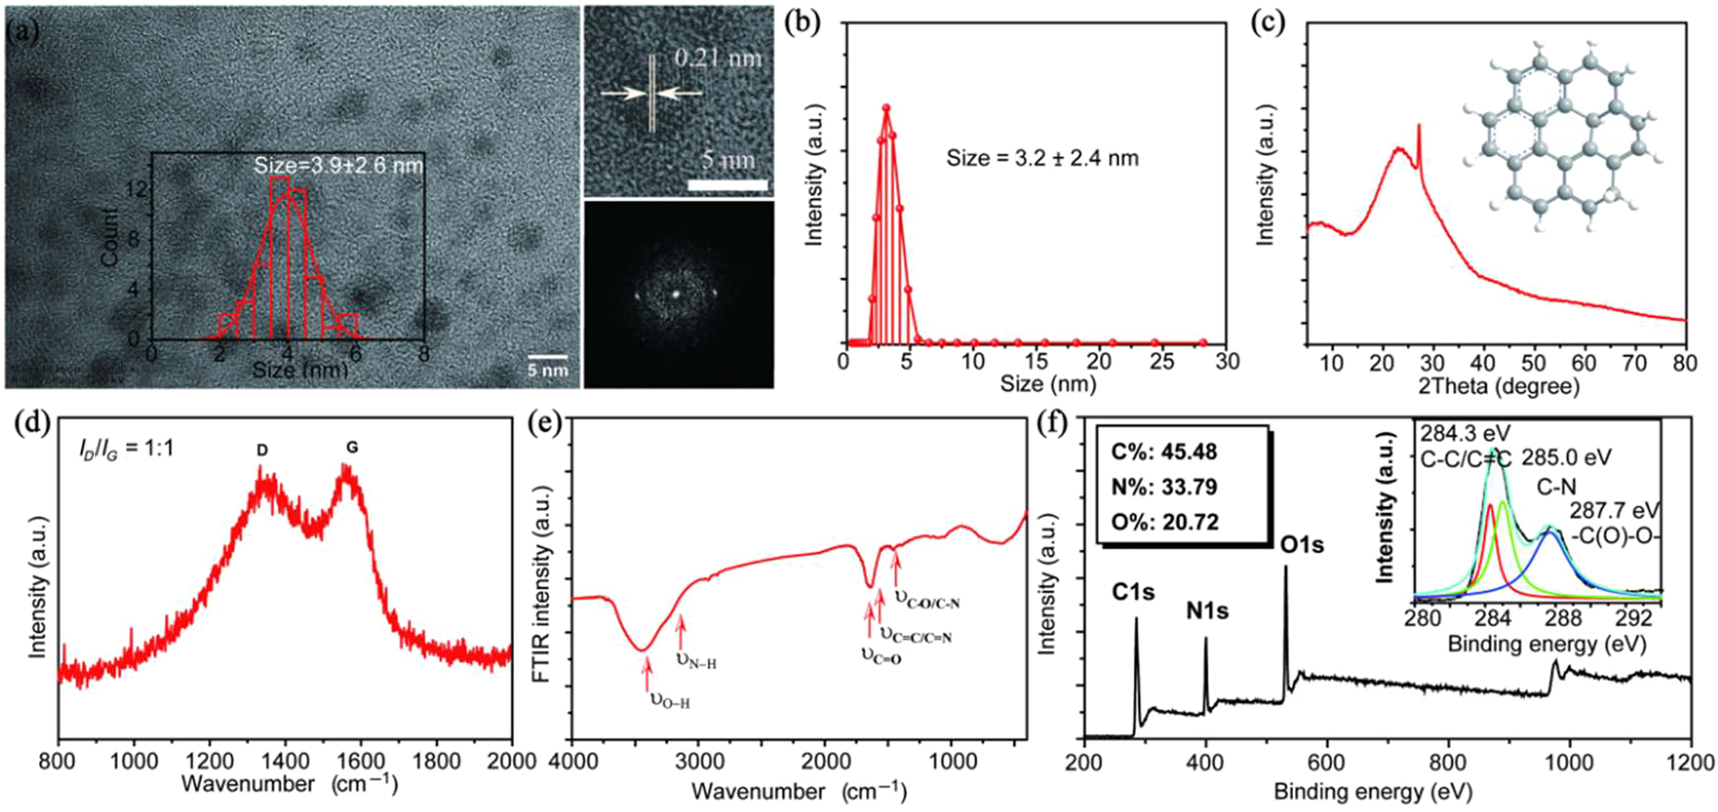
(a) Transmission electron microscopy (TEM) images, high-resolution TEM (HRTEM) images, and selected area electron diffraction (SAED) pattern of the carbon nanodots (CDs) (inset: the size distribution of the CDs). (b) DLS of the CDs aqueous solution. (c) XRD pattern of the CDs. (d) Raman spectrum of the CDs powder. (e) FTIR spectrum of the CDs. (f) Survey XPS spectrum of the CDs and high-resolution C1s spectrum of the CDs.
As illustrated in Figure 2a, the CD ethanol solution exhibit bright red fluorescence under the illumination of 365 nm UV lamp. Its maximum excitation-emission center is at (594 nm, 654 nm), whose quantum yield is about 22% (Tab. 1). When the CDs are used as CL emitter in TCPO and H2O2 solution, bright deep-red CL can be observed after adding the CDs into the mixture of TCPO and H2O2. The CL spectrum of CDs exhibits one broad peak around 635 nm and is consistent with the PL emission spectrum (Figure 2e, Figure S2). The UV–vis absorption of CDs ethanol solution presents two absorption bands at 330 and 580 nm (Figure 2c), indicating the π–π* transition between conjugated C–N/C=N and the n–π* transition between C=O and conjugated C–N/C=N as previous report [11], [13], [14], [15]. The time-resolved decay of CDs solution excited by 370 nm can be well-fitted with mono-exponential decay with a lifetime of 1.97 ns, implying the near-band-edge emission for the CDs (Figure 2d). As previous reports, the CL induced by peroxalate–H2O2 is originated from the chemically initiated electron exchange luminescence (CIEEL) as illustrated in Figure 2e [18], [19], [20], [21], [22], [23], [24], [25], [26], [27], [28], [30], [31]. In the process, the peroxalate fuel was firstly reacted with H2O2 spontaneously to yield energy-free intermediate 1,2-dioxetanedione, then the intermolecular electron transfer between the emitter and the intermediate excite of emitter, at last the excited emitter release photons and translate to ground state. With the optical absorption spectrum and valence band XPS (VB XPS), the energy level distribution of the CDs has been calculated to investigate the luminescence mechanism. As shown in Figures S3 and S4, the bandgap energy is calculated as 2.06 eV and the result of the VB XPS reveals −6.57 eV for the highest occupied molecular orbital (HOMO) levels. Combined with the results of the bandgap energy, the lowest unoccupied molecular orbital (LUMO) levels of the CDs can be calculated as −4.51 eV. Consequently, the process of the PL and CL for the CDs is illustrated in Figure 2f. For the PL, the electrons in conjugated C–N/C=N structure are excited with the π–π* transition or the n–π* transition by photon and then the excited CDs emit photon via radiative relaxation. For the CL, the CDs are excited by CIEEL process between the CDs and the intermediate-1,2-dioxetanedione and then the excited CDs emit photon via radiative relaxation. Generally, the energy interval (3.37 eV) between HOMO levels of emitter and LUMO levels of the intermediate (considered as −3.2 eV) directly decides the chemical transfer efficiency. For the CDs, the small interval (3.37 eV) implies high CL QY (Figure S5).
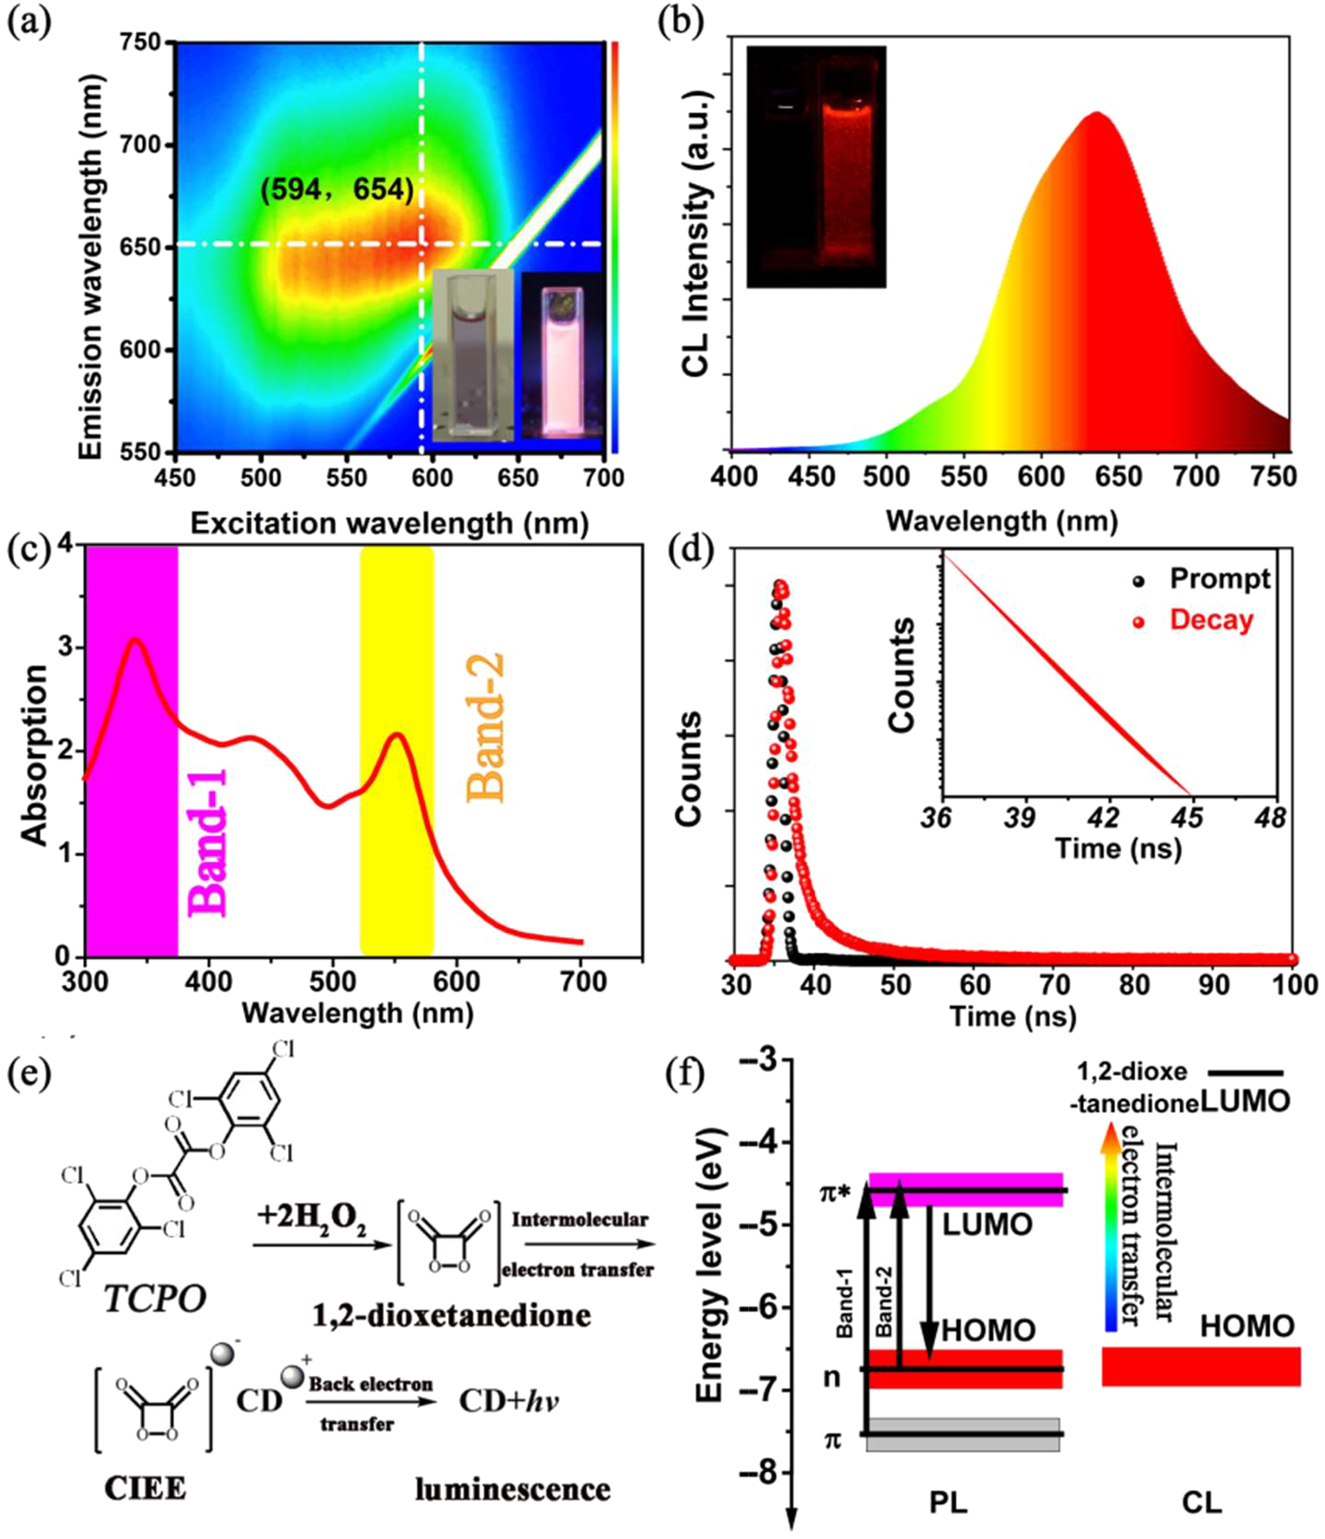
(a) Excitation–emission matrices of the CDs aqueous solution (inset: the photograph of CDs aqueous solution under 365 nm UV lamp). (b) The CL spectrum of the CDs (insets: the photograph before and after adding the CDs into TCPO and H2O2 solution in dark); (c) UV–vis absorption spectrum of the CDs aqueous solution (inset: the photograph under sunlight). (d) Time-resolved decay spectrum of the CDs aqueous solution. (e) Schematic illustration of the CL process induced by the CIEEL. (f) Schematic illustration the PL and CL mechanism.
Photophysical characteristics of the CDs.
| λema (nm) | ΦFb | CIEc | τd (ns) | λeme (nm) | ΦCf | |
|---|---|---|---|---|---|---|
| CDs | (594, 654) | 0.22 | (0.55, 0.36) | 1.97 | 635 | (8.22 ± 0.30) × 10−3 |
aPL maximum excitation and emission peak.
bPL quantum yield.
cCommission Internationale de L’Eclairage coordinate.
dPL lifetime.
eCL maximum emission peak.
fCL quantum yield.
The efficient CL can endow the CDs with the potential as sensitive chemiluminescent sensors. As Figure 3a shown, one laboratory CL analysis instrument is constructed and used for analyzing the relationship between CL intensity and concentration of reactant. As shown in Figure 3b, one smooth CL kinetic curve in one cycle can be measured by the instrument using the CDs as CL probe. Moreover, the CL signals intensity responding to the concentration of the CDs, TCPO, and H2O2 is measured and exhibited in Figure 3c–e. It can be found there are good linear relationship between the CL intensity and the concentration of three reactants, implying the stabilization of CL analysis system. With lucigenin as the reference[40], the CL efficiency of the CDs in TCPO and H2O2 solution has been calculated to be as high as (8.22 ± 0.30) × 10−3 in the CL analysis instrument, which is amongst the best values in ever reported nanomaterials for chemical analysis (Figures S6, S7 and Table 2).
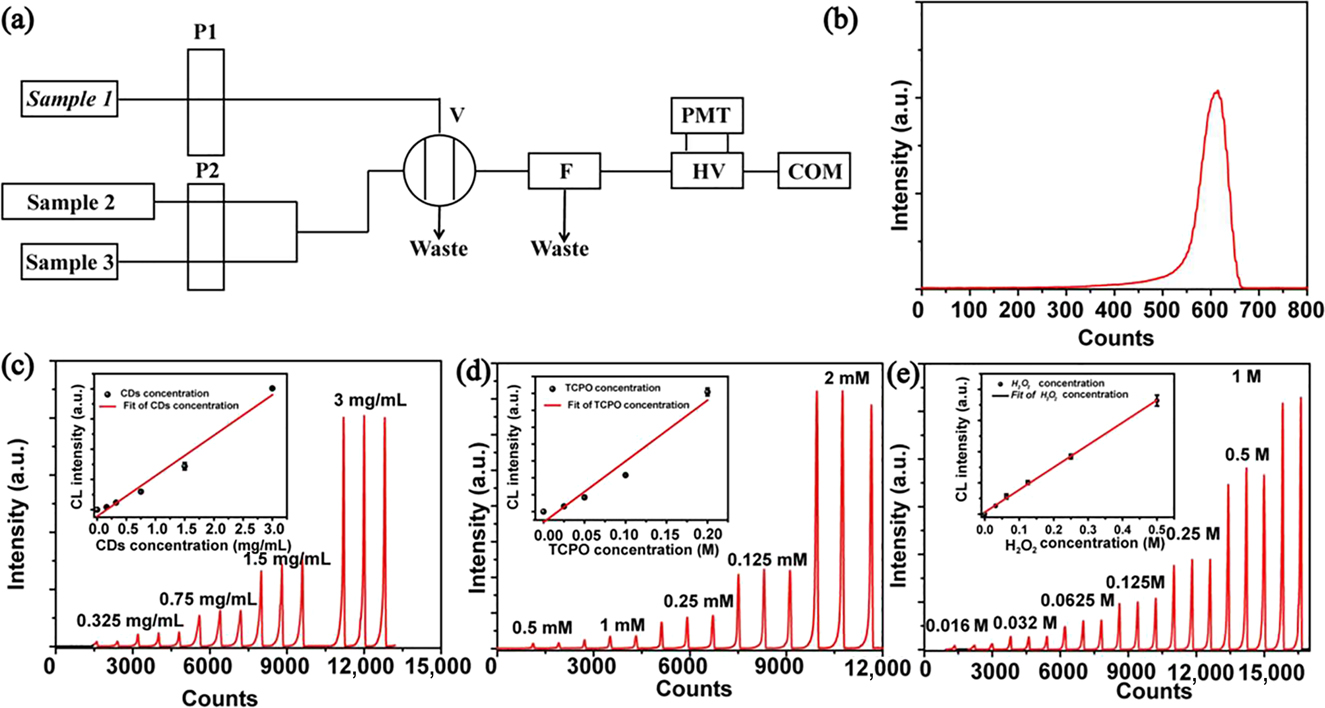
(a) Schematic illustration of the structure of flow-injection CL analysis instrument. (b) One cycle with 3 mg mL−1 CDs, 2 mM TCPO and 1 M H2O2 as samples. (c–e) The CL signal curve induced by different concentration of CDs (c), TCPO (d), and H2O2 (e) (insets: fitted curve of the maximum CL intensity vs. the concentration), error bars represent the standard deviation for three measurements.
The CL properties of different materials in previous reports.
| CL emitter | CL system | Φ | Ref. |
|---|---|---|---|
| CDs | TCPO–H2O2 | (8.22 ± 0.30) × 10−3 | This work |
| SPNR1 | CLsubstrate-O2•− | – | [21] |
| SPNR2 | CLsubstrate-O2•− | – | [21] |
| SPNR3 | CLsubstrate-O2•− | – | [21] |
| SPN-PFO | TCPO–H2O2 | 8.16 × 10⁻⁵ | [25] |
| SPN-PFPV | TCPO–H2O2 | 2.30 × 10⁻² | [25] |
| SPN-PFBT | TCPO–H2O2 | 2.18 × 10⁻⁵ | [25] |
| SPN-PFODBT | TCPO–H2O2 | 2.07 × 10⁻⁴ | [25] |
| Au NPs | TCPO–H2O2 | (2.80 ± 0.30) × 10−5 | [31] |
| Perylene | TCPO–H2O2 | – | [31] |
| Perylene | TCPO–H2O2 | – | [32] |
The high CL efficiency and the good linear relationship imply the potential application of the CL analysis for detecting CDs, TCPO, and especially H2O2. As illustrated schematic in Figure 4a, b, the CL has been developed to quantify H2O2 with the CL analysis instrument. In the process, TCPO and the CDs are first mixed in the cell and the CL intensity is measured after injecting different samples. In this work, the selectivity for H2O2 is firstly explored with common cations and oxidant, such as NH4+, Na+, K+, Ca2+, Zn2+, Fe2+, Fe3+, HNO3, KClO3, NaClO, K2Cr2O7, and KMnO4, as interference assays. Using CDs ethanol solution (1.2 mg mL−1) and TCPO ethyl acetate solution (10 mg mL−1) as reactant solution, the CL system presents a good selectivity for H2O2 as shown in Figure 4c. With the excellent selectivity for H2O2, the CL intensity induced by different concentration of H2O2 has been measured. As shown in Figure 4d–f, the CL intensity can be well fitted exponentially with the concentration of H2O2 in the range of 0 to 50 mM, and a good linear relationship in the range from 0 to 15 mM can be fitted with a fit coefficient of 0.998. In the range of linearity, the limit of detection (LOD) for H2O2 is calculated as low as 11.7 μM.
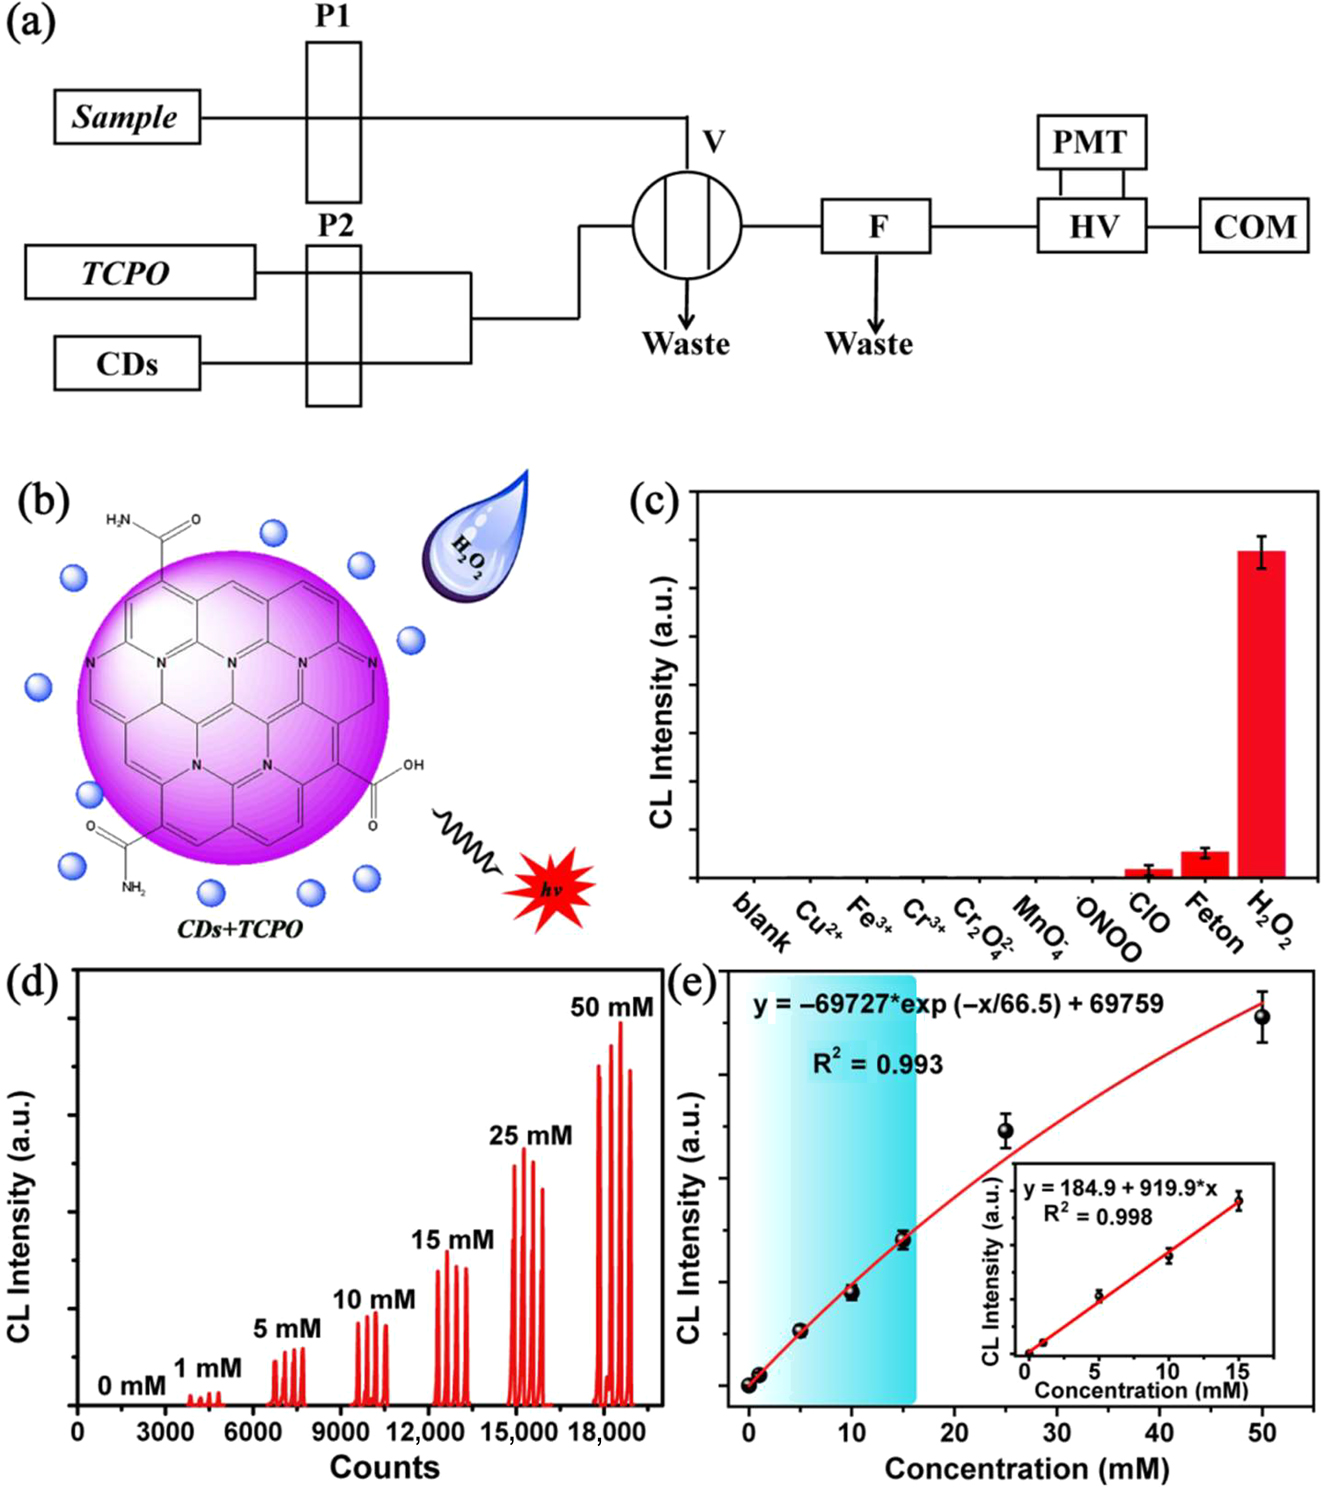
(a) Schematic illustration of the flow-injection lines in CL analysis device for H2O2 sensing. (b) Schematic illustration of the strategy for sensing H2O2. (c) The selectivity of CL analysis for H2O2. (d) The CL signal curve for different concentration of H2O2 with 1.2 mg mL−1 CDs solution and 10 mg mL−1 TCPO solution. (e) The relationship between the maximum CL intensity and the concentration of H2O2 (insets: the linear range of the CL analysis for H2O2), error bars represent the standard deviation for three measurements.
With the consequence, the CL analysis strategy can be further developed to sense glucose with GOD catalyzing as illustrated schematic in Figure 5a. In the analysis process, the glucose is firstly catalyzed by GOD and then the flow-injection lines of the analysis instrument are used to sense generated-H2O2. Similarly, the selectivity for glucose is characterized with common carbohydrates and amino acid, such as d-phenylalamine, l-Glutamicacid, l-cysteine, starch soluble, fructose, sucrose, and D-(+)xylose, as interference assays. As shown in Figure 5b, the CL system presents a distinguished selectivity for glucose due to the special selectivity of GOD. On the condition, the CL intensity is measured with different concentration of glucose as sample for test. As shown in Figure 5c–d, the CL intensity is well fitted exponentially with the concentration of glucose in the range of 0 to 50 mM and a well linear relationship is presented in the range from 0 to 15 mM with a fit coefficient of 0.998. In the range of linearity, the LOD for glucose is calculated as low as 12.6 μM. It is well known the normal range of human blood glucose is 3.9–6.1 mM, which is belong to the linear range of the CL analysis. Therefore, the CL analysis strategy for sensing glucose is potential to be used in blood glucose analysis and further for more related disease diagnosis.
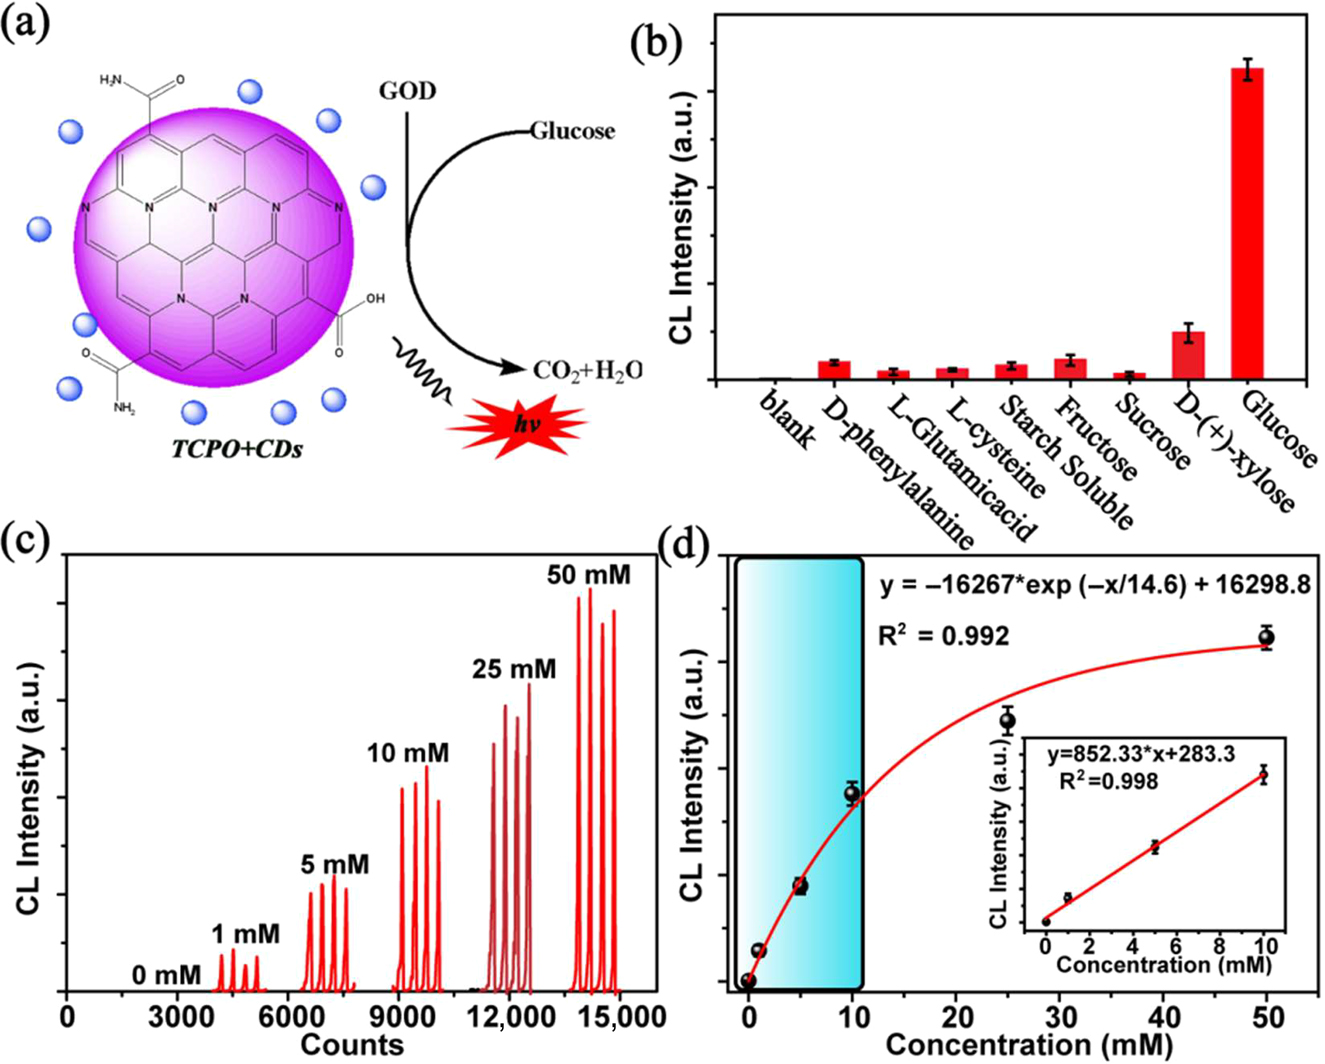
(a) Schematic illustration of the strategy for sensing glucose. (b) The selectivity of CL analysis for glucose. (c) The CL signal curve for different concentration of glucose with 1.2 mg mL−1 CDs solution and 10 mg mL−1 TCPO solution. (d) The relationship between the maximum CL intensity and the concentration of glucose (insets: the linear range of the CL analysis for glucose), error bars represent the standard deviation for three measurements.
4 Conclusions
In summary, CDs with efficient deep-red CL have been synthesized, and the CL efficiency can reach (8.22 ± 0.30) × 10−3, which is amongst the best values in ever reported nanomaterials for chemical analysis. One CL analysis strategy has been developed to detect the trace amount of H2O2 and glucose by using the CL CDs as probes in the TCPO–H2O2 system. The CD based sensor exhibits high selectivity to H2O2 and glucose, and the detection limit for these two substances is 11.7 and 12.6 μM, respectively. The CDs-based CL reported in this paper may have great potential applications in blood glucose analysis and further for in vivo biosensor.
Funding source: Scientific and Technological Project in Henan Province
Award Identifier / Grant number: 182102210181
Award Identifier / Grant number: 202102210220
Funding source: National Natural Science Foundation of China
Award Identifier / Grant number: 11904326
Award Identifier / Grant number: U1604263
Award Identifier / Grant number: U1804155
Acknowledgments
We gratefully acknowledge the support of this research by the National Natural Science Foundation of China (11904326, U1804155, and U1604263), the Scientific and Technological Project in Henan Province (182102210181 and 202102210220).
Author contribution: All the authors have accepted responsibility for the entire content of this submitted manuscript and approved submission.
Research funding: None declared.
Conflict of interest statement: The authors declare no conflicts of interest regarding this article.
References
[1] LE Parton, CP Ye, R Coppari, et al., “Glucose sensing by POMC neurons regulates glucose homeostasis and is impaired in obesity,” Nature, vol. 449, pp. 228–232, 2007. http://dx.doi.org/10.1038/nature06098.10.1038/nature06098Suche in Google Scholar PubMed
[2] B D’Autréaux, and MB Toledano, “ROS as signalling molecules: mechanisms that generate specificity in ROS homeostasis,” Nat. Rev. Mol. Cell. Biol., vol. 8, pp. 813–824, 2007. http://dx.doi.org/10.1038/nrm2256.10.1038/nrm2256Suche in Google Scholar PubMed
[3] C Lim, Y Lee, J Na, et al., “Chemiluminescence-generating nanoreactor formulation for near-infrared imaging of hydrogen peroxide and glucose level in vivo,” Adv. Funct. Mater., vol. 20, pp. 2644–2648, 2010. http://dx.doi.org/10.1002/adfm.201000780.10.1002/adfm.201000780Suche in Google Scholar
[4] C Tapeinos, and A Pandit, “Physical, chemical, and biological structures based on ROS-sensitive moieties that are able to respond to oxidative microenvironments,” Adv. Mater., vol. 28, pp. 5553–5585, 2016. http://dx.doi.org/10.1002/adma.201505376.10.1002/adma.201505376Suche in Google Scholar PubMed
[5] Q Liu, Y Yang, H Li, et al., “NiO nanoparticles modified with 5,10,15,20-tetrakis(4-carboxyl pheyl)-porphyrin: promising peroxidase mimetics for H2O2 and glucose detection,” Biosen. Bioelectron., vol. 64, pp. 147–153, 2015. http://dx.doi.org/10.1016/j.bios.2014.08.062.10.1016/j.bios.2014.08.062Suche in Google Scholar PubMed
[6] NR Nirala, S Abraham, V Kumar, et al., “Colorimetric detection of cholesterol based on highly efficient peroxidase mimetic activity of graphene quantum dots,” Sensors Actuat. B-Chem., vol. 218, pp. 42–50, 2015. http://dx.doi.org/10.1016/j.snb.2015.04.091.10.1016/j.snb.2015.04.091Suche in Google Scholar
[7] C-L Shen, L-X Su, J-H Zang, et al., “Carbon nanodots as dual-mode nanosensors for selective detection of hydrogen peroxide,” Nanoscale Res. Lett., vol. 12, p. 447, 2017. http://dx.doi.org/10.1186/s11671-017-2214-6.10.1186/s11671-017-2214-6Suche in Google Scholar PubMed PubMed Central
[8] F Honarasa, FH Kamshoori, S Fathi, et al., “Carbon dots on V2O5 nanowires are a viable peroxidase mimic for colorimetric determination of hydrogen peroxide and glucose,” Microchim. Acta., vol. 186, p. 234, 2019. http://dx.doi.org/10.1007/s00604-019-3344-6.10.1007/s00604-019-3344-6Suche in Google Scholar PubMed
[9] MS Hofmann, JT Glückert, J Noé, et al., “Bright, long-lived and coherent excitons in carbon nanotube quantum dots,” Nat. Nanotechnol., vol. 8, pp. 502–505, 2013. http://dx.doi.org/10.1038/nnano.2013.119.10.1038/nnano.2013.119Suche in Google Scholar PubMed
[10] J Zhang, L Dong, and S Yu, “A selective sensor for cyanide ion (CN −) based on the inner filter effect of metal nanoparticles with photoluminescent carbon dots as the fluorophore,” Sci. Bull., vol. 60, pp. 785–791, 2015. http://dx.doi.org/10.1007/s11434-015-0764-5.10.1007/s11434-015-0764-5Suche in Google Scholar
[11] S Sooksin, V Promarak, S Ittisanronnachai, et al., “A highly selective fluorescent enhancement sensor for Al3+ based nitrogen-doped carbon dots catalyzed by Fe3+,” Sensors Actuat. B-Chem., vol. 262, pp. 720–732, 2018. http://dx.doi.org/10.1016/j.snb.2018.01.239.10.1016/j.snb.2018.01.239Suche in Google Scholar
[12] SN Baker, and GA Baker, “Luminescent carbon nanodots: emergent nanolights,” Angew. Chem. Int. Ed., vol. 49, pp. 6726–6744, 2010. http://dx.doi.org/10.1002/anie.200906623.10.1002/anie.200906623Suche in Google Scholar PubMed
[13] S Lu, LZ Sui, M Wu, et al., “Graphitic nitrogen and high-crystalline triggered strong photoluminescence and room-temperature ferromagnetism in carbonized polymer dots,” Adv. Sci., vol. 6, no. 2, p. 1801192, 2019. http://dx.doi.org/10.1002/advs.201801192.10.1002/advs.201801192Suche in Google Scholar PubMed PubMed Central
[14] Z Zhao, S Liu, J Zhu, et al., “Hierarchical nanostructures of nitrogen-doped porous carbon polyhedrons confined in carbon nanosheets for high-performance supercapacitors,” ACS Appl. Mater. Inter., vol. 10, pp. 19871–19880, 2018. http://dx.doi.org/10.1021/acsami.8b03431.10.1021/acsami.8b03431Suche in Google Scholar PubMed
[15] HY Ko, YW Chang, G Paramasivam, et al., “In vivo imaging of tumour bearing near-infrared fluorescence-emitting carbon nanodots derived from tire soot,” Chem. Commun., vol. 49, p. 10290, 2013. http://dx.doi.org/10.1039/c3cc45215h.10.1039/c3cc45215hSuche in Google Scholar PubMed
[16] Y Liu, N Xiao, N Gong, et al., “One-step microwave-assisted polyol synthesis of green luminescent carbon dots as optical nanoprobes,” Carbon, vol. 68, pp. 258–264, 2014. http://dx.doi.org/10.1016/j.carbon.2013.10.086.10.1016/j.carbon.2013.10.086Suche in Google Scholar
[17] WB Zhao, KK Liu, SY Song, et al., “Fluorescent nano-biomass dots: ultrasonic-assisted extraction and their application as nanoprobe for Fe3+ detection,” Nanoscale Res. Lett., vol. 14, p. 130, 2019. http://dx.doi.org/10.1186/s11671-019-2950-x.10.1186/s11671-019-2950-xSuche in Google Scholar PubMed PubMed Central
[18] CL Shen, Q Lou, JH Zang, et al., “Near-infrared chemiluminescent carbon nanodots and their application in reactive oxygen species bioimaging,” Adv. Sci., vol. 7, p. 1903525, 2020. http://dx.doi.org/10.1002/advs.201903525.10.1002/advs.201903525Suche in Google Scholar PubMed PubMed Central
[19] R Kabe, and C Adachi, “Organic long persistent luminescence,” Nature, vol. 550, pp. 384–387, 2017. http://dx.doi.org/10.1038/nature24010.10.1038/nature24010Suche in Google Scholar PubMed
[20] J Huang, J Li, Y Lyu, et al., “Molecular optical imaging probes for early diagnosis of drug-induced acute kidney injury,” Nat. Mater., vol. 18, pp. 1133–1143, 2019. http://dx.doi.org/10.1038/s41563-019-0378-4.10.1038/s41563-019-0378-4Suche in Google Scholar PubMed
[21] D Cui, J Li, X Zhao, et al., “Semiconducting polymer nanoreporters for near-infrared chemiluminescence imaging of immunoactivation,” Adv. Mater., vol. 32, p. 1906314, 2019. http://dx.doi.org/10.1002/adma.201906314.10.1002/adma.201906314Suche in Google Scholar PubMed
[22] AJ Shuhendler, K Pu, L Cui, et al., “Real-time imaging of oxidative and nitrosative stress in the liver of live animals for drug-toxicity testing,” Nat. Biotechnol., vol. 32, pp. 373–380, 2014. http://dx.doi.org/10.1038/nbt.2838.10.1038/nbt.2838Suche in Google Scholar PubMed PubMed Central
[23] Q Miao, C Xie, X Zhen, et al., “Molecular afterglow imaging with bright, biodegradable polymer nanoparticles,” Nat. Biotechnol., vol. 35, pp. 1102–1110, 2017. http://dx.doi.org/10.1038/nbt.3987.10.1038/nbt.3987Suche in Google Scholar PubMed
[24] P Cheng, Q Miao, J Li, et al., “Unimolecular chemo-fluoro-luminescent reporter for crosstalk-free duplex imaging of hepatotoxicity,” J. Am. Chem. Soc., vol. 141, pp. 10581–10584, 2019. http://dx.doi.org/10.1021/jacs.9b02580.10.1021/jacs.9b02580Suche in Google Scholar PubMed
[25] X Zhen, C Zhang, C Xie, et al., “Intraparticle energy level alignment of semiconducting polymer nanoparticles to amplify chemiluminescence for ultrasensitivein vivoimaging of reactive oxygen species,” ACS Nano, vol. 10, pp. 6400–6409, 2016. http://dx.doi.org/10.1021/acsnano.6b02908.10.1021/acsnano.6b02908Suche in Google Scholar PubMed
[26] S He, C Xie, Y Jiang, et al., “An organic afterglow protheranostic nanoassembly,” Adv. Mater., vol. 31, p. 1902672, 2019. http://dx.doi.org/10.1002/adma.201902672.10.1002/adma.201902672Suche in Google Scholar PubMed
[27] X Gu, and BZ Tang, “No UV irradiation needed! Chemiexcited AIE dots for cancer theranostics,” Chem, vol. 3, pp. 922–924, 2017. https://doi.org/10.1016/j.chempr.2017.11.013.Suche in Google Scholar
[28] J Huang, Y Lyu, J Li, et al., “A renal-clearable duplex optical reporter for real-time imaging of contrast-induced acute kidney injury,” Angew. Chem. Int. Ed., vol. 58, pp. 17796–17804, 2019. http://dx.doi.org/10.1002/anie.201910137.10.1002/anie.201910137Suche in Google Scholar PubMed
[29] CL Shen, Q Lou, CF Lv, et al., “Bright and multicolor chemiluminescent carbon nanodots for advanced information encryption,” Adv. Sci., vol. 6, p. 1802331, 2019. http://dx.doi.org/10.1002/advs.201802331.10.1002/advs.201802331Suche in Google Scholar PubMed PubMed Central
[30] H Cui, Z Zhang, M Shi, et al., “Light emission of gold nanoparticles induced by the reaction of bis(2,4,6-trichlorophenyl) oxalate and hydrogen peroxide,” Anal. Chem., vol. 77, pp. 6402–6406, 2005. http://dx.doi.org/10.1021/ac050882q.10.1021/ac050882qSuche in Google Scholar PubMed
[31] P V Zoonen, D A Kamminga, C Gooijer, et al., “Flow injection determination of hydrogen peroxide by means of a solid-state-peroxyoxalate chemiluminescence reactor,” Anal. Chim. Acta, vol. 167, pp. 249–256, 1985. https://doi.org/10.1016/s0003-2670(00)84427-x.Suche in Google Scholar
[32] DC Williams, GF Huff, and WR Seitz, “Evaluation of peroxyoxalate chemiluminescence for determination of enzyme generated peroxide,” Anal. Chem., vol. 487, pp. 1003–1006, 1976. http://dx.doi.org/10.1021/ac60371a025.10.1021/ac60371a025Suche in Google Scholar PubMed
[33] Z-Y Liu, C-L Shen, Q Lou, et al., “Effcient chemiluminescent ZnO nanoparticles for cellular imaging,” J. Lumin., vol. 221, p. 117111, 2020. http://dx.doi.org/10.1016/j.jlumin.2020.117111.10.1016/j.jlumin.2020.117111Suche in Google Scholar
[34] Z Lin, W Xue, H Chen, et al., “Peroxynitrous-acid-induced chemiluminescence of fluorescent carbon dots for nitrite sensing,” Anal. Chem., vol. 83, pp. 8245–8251, 2011. http://dx.doi.org/10.1021/ac202039h.10.1021/ac202039hSuche in Google Scholar PubMed
[35] L Zhao, F Di, D Wang, et al., “Chemiluminescence of carbon dots under strong alkaline solutions: a novel insight into carbon dot optical properties,” Nanoscale, vol. 5, p. 2655, 2013. http://dx.doi.org/10.1039/c3nr00358b.10.1039/c3nr00358bSuche in Google Scholar PubMed
[36] Y Guo, and B Li, “Carbon dots-initiated luminol chemiluminescence in the absence of added oxidant,” Carbon, vol. 82, pp. 459–469, 2015. http://dx.doi.org/10.1016/j.carbon.2014.10.089.10.1016/j.carbon.2014.10.089Suche in Google Scholar
[37] H Zhang, X Zhang, and S Dong, “Enhancement of the carbon dots/K2S2O8 chemiluminescence system induced by triethylamine,” Anal. Chem., vol. 87, pp. 11167–11170, 2015. http://dx.doi.org/10.1021/acs.analchem.5b02562.10.1021/acs.analchem.5b02562Suche in Google Scholar PubMed
[38] S Dong, J Zhong, and C Lu, “Introducing confinement effects into ultraweak chemiluminescence for an improved sensitivity,” Anal. Chem., vol. 86, pp. 7947–7953, 2014. http://dx.doi.org/10.1021/ac501956r.10.1021/ac501956rSuche in Google Scholar PubMed
[39] P Teng, J Xie, Y Long, et al., “Chemiluminescence behavior of the carbon dots and the reduced state carbon dots,” J. Lumin., vol. 146, pp. 464–469, 2014. http://dx.doi.org/10.1016/j.jlumin.2013.09.036.10.1016/j.jlumin.2013.09.036Suche in Google Scholar
[40] R Maskiewicz, D Sogah, and TC Bruice, “Chemiluminescent reactions of lucigenin. 1. Reactions of lucigenin with hydrogen peroxide,” J. Am. Chem. Soc., vol. 101, pp. 5347–5354, 1979. http://dx.doi.org/10.1021/ja00512a040.10.1021/ja00512a040Suche in Google Scholar
Supplementary Material
Supplementary material to this article can be found online at (https://doi.org/10.1515/nanoph-2020-0233).
© 2020 Cheng-Long Shen, et al., published by De Gruyter, Berlin/Boston
This work is licensed under the Creative Commons Attribution 4.0 International License.
Artikel in diesem Heft
- Reviews
- Boron nitride for excitonics, nano photonics, and quantum technologies
- Design for quality: reconfigurable flat optics based on active metasurfaces
- Research Articles
- Microwave oscillator and frequency comb in a silicon optomechanical cavity with a full phononic bandgap
- Second harmonic generation in metasurfaces with multipole resonant coupling
- Symmetry-tailored patterns and polarizations of single-photon emission
- Highly transparent and conductive metal oxide/metal/polymer composite electrodes for high-efficiency flexible organic light-emitting devices
- Optical anapole mode in nanostructured lithium niobate for enhancing second harmonic generation
- Temporal plasmonics: Fano and Rabi regimes in the time domain in metal nanostructures
- Chemiluminescent carbon nanodots as sensors for hydrogen peroxide and glucose
- Dual-polarized multiplexed meta-holograms utilizing coding metasurface
- Tunable photoluminescence properties of selenium nanoparticles: biogenic versus chemogenic synthesis
- Compact disordered magnetic resonators designed by simulated annealing algorithm
- Controlling the plasmon resonance via epsilon-near-zero multilayer metamaterials
- 2D GeP-based photonic device for near-infrared and mid-infrared ultrafast photonics
- Purcell-enhanced emission from individual SiV− center in nanodiamonds coupled to a Si3N4-based, photonic crystal cavity
- Ultrasensitive and fast photoresponse in graphene/silicon-on-insulator hybrid structure by manipulating the photogating effect
- Multiresonant plasmonic nanostructure for ultrasensitive fluorescence biosensing
- Advanced encryption method realized by secret shared phase encoding scheme using a multi-wavelength metasurface