India’s Energy and Fiscal Transition
-
Laveesh Bhandari


Abstract
This paper looks at India’s expected energy transition towards a low carbon future and studies how government revenues from fossil fuels will be affected over the next two decades. It takes the International Energy Association (2021) scenarios for India and studies how both tax revenues and non-tax revenues for national (central) and sub-national (state) governments would be affected. The study finds that under fairly standard assumptions on growth, prices, and taxes, there would be continued growth in revenues from fossil fuels till 2040; however, as a share of the GDP and overall government budget it would fall significantly and this would impose challenges for both the state and central governments in India. Moreover, since the central government is the greatest beneficiary of fossil fuels, it would face the brunt of the pressure. The paper also briefly discusses the possible impact of net zero and carbon taxes if India were to take that route, as well as how subsidies are expected to impact and be impacted by such considerations.
1 Introduction
Over the next few decades, like most other countries, India will go through a significant energy transition, with a steady reduction in the share of fossil fuels in its energy portfolio.[1] Fossil fuels account for a significant share of Indian government revenues, and therefore this energy transition may also impact government revenues and necessitate a simultaneous fiscal transition. This paper identifies the sources of government revenue from fossil fuels, their quantum, and also how the energy and fiscal transitions will occur together.
Historically, India has not been among the major consumers of fossil fuels, and this is largely due to its low per capita income. The transition from a low per capita income country is an important consideration for its economic policy and will require sustained and high economic growth. India’s economic growth to a significant extent has been powered by imports of fossil fuels. At the same time, among major economies, India’s growth in renewable energy capacity has been among the highest in recent years (Table 1). India is also an outlier in terms of energy generation and per capita, CO2 emission (see Online Appendix) in that the latter is lower than its population or economy would warrant by global standards (MoSPI 2020).
Growth of fossil fuels consumption and other energy sources in India (Petajoules).
| Year | Coal | Lignite | Crude Oil | Natural Gas | Electricitya | Total |
|---|---|---|---|---|---|---|
| 1 | 2 | 3 | 4 | 5 | 6 | 7 |
| 2010–11 | 8,972 | 428 | 8,248 | 2,471 | 2,500 | 22,620 |
| 2011–12 | 9,664 | 476 | 8,547 | 2,483 | 2,827 | 23,996 |
| 2012–13 | 10,794 | 527 | 9,178 | 2,210 | 2,967 | 25,676 |
| 2013–14 | 11,186 | 499 | 9,316 | 2,017 | 3,147 | 26,166 |
| 2014–15 | 12,439 | 534 | 9,347 | 1,976 | 3,415 | 27,710 |
| 2015–16 | 12,660 | 480 | 9,750 | 2,021 | 3,604 | 28,517 |
| 2016–17 | 12,667 | 491 | 10,273 | 2,145 | 3,820 | 29,397 |
| 2017–18 | 13,594 | 527 | 10,549 | 2,279 | 4,044 | 30,993 |
| 2018–19 | 14,651 | 521 | 10,769 | 2,342 | 4,356 | 32,639 |
| 2019–20 (P) | 14,262 | 481 | 10,651 | 2,471 | 4,649 | 32,514 |
| % Share in total consumption for 2019–20 | 43.9 | 1.5 | 32.8 | 7.6 | 14.3 | 100 |
| CAGR 2010–11 to 2019–20 (%) | 5.28 | 1.28 | 2.88 | −0.003 | 7.14 | 4.11 |
-
aNote: Only includes Nuclear, Hydro, and Renewable sources of energy to avoid double counting Source: Energy Statistics India 2021, MOSPI, Government of India.
Currently, the Indian governments at the federal and state levels impose a multitude of taxes, cesses, duties, etc. on all fossil fuels. Non-tax revenues are not insignificant and include royalties from domestic mining operations, and also dividends from public sector ownership of fossil fuel companies. Not merely are these non-tax and tax revenues significant, but they have also been growing steadily over time. This growth, as later sections will show, has been due to both an increase in the quantum of fossil fuel-based energy, and also an increase in the extent of the ad valorem taxes imposed on them.
Significant global literature categorizes continued high government revenues from fossil fuels as one of carbon entanglement. The argument is that economies with a high level of entanglement have a lower motivation to increase the pace of change towards a low carbon future (see for instance Lazarus and van Asselt 2018; Piggot et al. 2020). That literature however does not address another major force operating in India. That its import dependence on fossil fuels adversely affect energy security and trade balance. As of 2018, India imported four-fifths of its petroleum needs. India’s domestic production of crude and natural gas has steadily been declining since 2011–12, and it imported over 62 MT of petroleum products and 23 MT of LPG in 2019–20, among the top importers globally.[2] Though India is the world’s second-largest producer of coal, and produces about four-fifths of its needs, Indian coal imports have also been steadily rising: from 10 Million Tons (MT) in 2007–08, imports rose to 45 MT in 2011–12, and about 150 MT in 2018–19.[3] For coal alone, India’s import bill was Rs 90,000 crore (Rs 900 billion), for liquified natural gas or LNG, Rs 65,000 crores (Rs 650 billion), and for finished petroleum products Rs 181,000 crores (Rs 1.81 trillion) in 2019–20.[4] During the launch of the In-depth Review of India’s Energy Policies report from the International Energy Agency (IEA), Shri Dharmendra Pradhan, Minister of Petroleum and Natural Gas & Steel pointed out energy security as one of the main pillars of India’s energy vision. It is anchored by energy access, energy efficiency, energy sustainability and energy security, with energy justice at its core.
While low-cost energy is the end objective that can enable sustained income growth, reduction of import dependence can no doubt be achieved through greater reliance on renewable energy. And indeed, the country is moving steadily towards greater reliance on wind, solar, and biomass-based energy as well as greater use of electricity and hydrogen. The concern however is that current plans may not go far enough and that India needs to be more aggressive in its transition towards an RE-powered economy. While some may call for tighter Net Zero type of commitments (currently India is committed to 2070), others such as the International Energy Agency (IEA) have recently come up with different conceivable scenarios for India and what it would mean in terms of its energy portfolio in 2030 and 2040.
Whatever path India takes would also impact its national and sub-national governments’ ability to manage the transition. And a critical aspect of this transition is going to be how it will address the fiscal challenges and ensure a smooth fiscal transition. This paper focuses on precisely that aspect – the challenge of fiscal transition that will accompany India’s energy transition.
The rest of this paper proceeds as follows. Section 2 reviews the literature and looks at the various attempts at estimating the dependence on fossil fuels and the gaps therein, especially in the Indian context. Section 3 looks at the elaborate nature and complexity of taxes on fossil fuels, how that translates into significant revenues, and finally the transition of government revenues under different energy transition scenarios and assumptions. It finds that there will be a significant impact on revenues of both center and state governments under fairly plausible conditions. Section 4 concludes with a discussion on the ramifications of the results.
2 Literature Review
A clean energy transition is an important aspect of sustainable development strategy around the world (Băhnăreanu 2019). Almost every country has its transition plans and goals. One of the most fundamental inputs to these plans is the way it changes the government budget. Currently, both the energy exporting and importing economies are heavily dependent on tax and non-tax revenue originating from fossil fuels. The exporting countries source it from fossil by favorable price setting and importing countries do the same by taxing the production and consumption of coal, oil, natural gas, etc. The Paris Agreement on climate change sets a goal of keeping global warming “well below 2 °C” while striving to limit it to 1.5 °C, the world needs to switch from fossil fuels to clean energy and achieve deep emission reductions in all sectors of the economy (IPCC 2018).
The clean energy transition is being accelerated as the costs of clean energy technologies plummet and many countries seek to boost domestic energy production from locally available renewables, and also reduce imports. There are of course other benefits including reduced pollution, new employment avenues, etc. If countries are indeed able to reduce their dependence on fossil fuels, and rapidly reduce their usage, fossil fuels’ role as a tax base will shrink accordingly. And for many countries, especially large producers and consumers, whose revenues from fossil fuels account for a large share of government revenues, this could be a cause of concern (see for instance Bradley, Lahn, and Pye 2018; ITF 2019; Manley, Cust, and Ceccinato 2016; OECD 2019).
Thematically, this paper analyses the Indian government’s reliance on revenues (both tax and non-tax) from fossil fuels and how they would play out with the energy transition goals with ceteris paribus conditions. It analyses government revenues from all three major fossil fuels, coal, petroleum, and natural gas. Since India is both a producer and a consumer of these fuels, it looks at both revenues from the production and consumption sides, including those for imported fuels. Other studies have no doubt looked at some aspects of India’s energy transition, selected ones are reviewed below.
One class of studies has focused on petroleum but not coal. These studies can further be dive into two categories: those focusing on oil-producing, and those on consuming countries. Those focusing on producing countries estimate expected revenues from petroleum products (Stephens 2019). The second category of studies are related the to the estimation of petroleum demand function the and projection of associated tax revenues (e.g. Berwick and Malchose 2012; Sunley, Baunsgaard, and Simard 2002). Agarwal et al. (2012) and Parikh, Purohit, and Maitra (2007) estimated petroleum demand functions for India using time series data for the period 1980–81 to 2000–01. Moreover, their focus was on the projection of future demand and not the potential impact on revenues.
Mukherjee (2020) attempted to estimate both the demand function and tax revenue functions for India, however that study did not include coal. The study found that there is a non-linear relationship between consumption of fuels and tax revenues over time, in that revenues are increasing disproportionately to increase in consumption. As is well known, tax rates on fossil fuels in India have been going up steadily over the last few years and therefore the non-linearity is obvious. With a growing debate on instituting carbon taxes (Jenkins 2019; Metcalf 2021) this trend may yet continue.
Gerasimchuk et al. (2019) estimated the reliance of BRICS countries on fossil fuels. According to them, in 2017, the combined revenues from fossil fuel production and consumption as a percentage of GDP were the highest in Russia (8 percent), followed by India (3.7 percent), Brazil (2 percent), South Africa (1.9 percent) and China (1.2 percent). The reliance of these countries both on production and consumption taxes was found to be inordinately high and the paper called for diversification to reduce the reliance. The study, however, did not look at how these may change with energy transition.
Prayas (2021) analyses the tax and non-tax revenue collected by the central and state government in India in 2018–19 and 2019–20. Unlike others, this study includes coal along with electricity, oil, and natural gas. It shows that the share of these sectors in total tax revenue of the central and state government combined is just under 18 percent. While this study did include all major fossil fuels it did not include the substantial dividends that the government obtains from its equity ownership of the fossil fuel monopolies and corporate tax from public and private energy companies as well. Moreover, it also did not look at how these might change over the next few decades.
To the knowledge of the authors, no study addresses the key question being asked here, that is, how the lower use of fossil fuels might impact government budgets as India transitions to a low carbon economy. We include all key fossil fuels, coal, oil, and natural gas as each is an important contributor to government revenues. Moreover, in India, public sector ownership of fossil fuel companies also requires the inclusion of non-tax revenues such as dividends and royalties which are a significant component of government revenues. The next section describes the data and the estimation process.
3 Changing Share of Fossil Fuels in Government Budgets
This first part of this section briefly describes India’s tax and non-tax sources of revenue for state and central governments that originate from fossil fuels. It then estimates the share of the total budget that is accounted for directly by the fossil fuel sector. The last part estimates how government revenues may be impacted as the share of fossil fuels in overall revenues falls over time.
3.1 Revenues from Fossil Fuels: a Complex Network
Indian national and sub-national governments have imposed a surfeit of taxes, cesses, levies, duties, etc. on various fossil fuels. These span the whole value chain from mining to consumption. A complex and well-spread set of such revenue sources have contributed to a high dependence on these fuels for both national and sub-national governments. Moreover, each of the tax and non-tax sources are fairly significant in scope and scale. Together, therefore, as this section shows, there is a higher degree of fossil fuel dependence.
This section first describes various taxes and other revenues from oil and natural gas companies and later from coal companies. Coal is dealt with separately as the taxes, cesses, etc. that operate on coal are very different from those that apply to oil and natural gas companies. Though India has implemented a Goods and Service tax regime since 2017, it does not cover most petroleum products which continue to be under the older mechanism of Excise Duty (on production), Value Added Tax (imposed by state governments), and import duties. Some fossil fuels and their derivatives have been covered under GST, and a compensatory cess has also been imposed on coal. Companies involved in fossil fuel production and trade are also taxed corporation or profit tax. There are variations in types and rates of taxes across all major product categories and subcategories. Table 2 summarises the different components of tax and non-tax revenue included for each sector (Petroleum Planning & Analysis Cell 2021).
Revenue streams included in the estimation.
| Tax revenue | Non-tax revenue |
|---|---|
| 1. Coal – GST and GST compensation cess, custom duty, corporate tax, and other taxes | 1. Coal – Royalty and dividend income contributed by public sector companies |
| 2. Oil and Natural Gas – Cess, customs, excise duty, National Calamity Contingent duty, VAT, Corporate tax, GST on petroleum products under GST | 2. Oil and Natural Gas – Royalty and dividend income contributed by public sector companies |
The various taxes, duties, levies, and cesses change from time to time (details in the Online Appendix Table 1 and 2).
3.1.1 Oil and Natural Gas
The Goods and Service Tax regime was implemented in India in 2017. The GST is a form of value-added tax on the consumption of goods and services as well as services at the national level. The objective is for it to replace all indirect taxes levied on goods and services by the Indian central and state governments. However, as of 2021, energy (electricity and petroleum products), fresh foods, and alcohol products were among those kept out of its purview. Within petroleum five commodities including crude oil, natural gas, petrol, diesel, and aviation turbine fuel remain excluded from the ambit of GST. However, some are included in the GST regime such as Kerosene (18 %), Greases (18 %), Sulphur (18 %), Benzene (18 %), AV gas (28 %), etc. Coal attracts a 5 percent tax under GST. Though the GST rates have remained the same since inception in 2017, GST collections have risen from 2017–18 to 2018–19 and fell in the following two financial years, presumably due to the Covid-induced slowdown as shown in Table 3.
Contribution of oil and natural gas to government revenues (Rs billion).
| 2017–18 | 2018–19 | 2019–20 | 2020–21 (P) | |
|---|---|---|---|---|
| Integrated GST | 92.1 | 164.8 | 131.0 | 115.9 |
| Central GST | 44.9 | 74.4 | 68.3 | 61.6 |
| State GST/UT GST | 49.7 | 79.6 | 73.5 | 61.2 |
-
Source: Petroleum Planning and Analysis Cell (PPAC). Note: Integrated GST or IGST is a type of GST which is paid by the supplier in case of the interstate supply of goods and services to the central government which it then shares with the states. The GST is applied to any kind of supply or delivery of any kind of goods or services within a state, and has two components – Central GST or CGST which accrues to the central government,nt and State GST or SGST to the State government.
A cess is a tax with specific purposes and is typically considered to be temporary in nature. It is different from other forms of taxes and is imposed as an additional tax over and above the existing tax (tax on tax). Currently, there are six different types of cesses being imposed in India and two of those apply to the petroleum sector, namely ‘Cess on Crude Petroleum’ and ‘Road Cess’. The cess on crude petroleum is imposed on domestic crude production (not imported crude) at the rate of 20 percent of the value and the Road Cess is Rs 2.5 and Rs 4.00 per litre sold of Petrol and Diesel respectively7. There has been some discussion on reducing the crude cess to 10 percent and also imposing a covid cess, but both have not occurred yet. Given India’s federal structure there are many constraints in imposing new taxes many of which need to be shared with state governments, the cess however is typically not,[5] and therefore this gives the central government some short-term flexibility in both instituting a cess and using its proceeds for a specific function.[6] However, after the 14th Finance Commission, the States’ share in the tax revenue increased from 32 to 42 percent.
The taxes on imports or customs duty on oil and natural gas varies from product to product. The rates are decided separately for products covered under GST and excluded from GST. The custom duties have two components, basic customs duty, and additional custom duty. For Non-GST petroleum products such as petrol the basicustomsom duty is 2.5 percent of value, and an additional customs duty of Rs 18 per litre, for aviation turbine fuel the basic customs duty is 5 percent and the additional customs duty is 11 percent. For GST products like ke,rosene it’s 5 percent and 18 percent, for furnace oil the combined duty is 29.8 percent. The combination of an ad valorem and specific or unit taxes has traditionally provided flexibility to better manage government revenues while maneuvering through the crude price volatility. The contribution of custom duty increased continuously from Rs 41.25 billion in 2014–15 to Rs 229.27 billion in 2019–20 and is exto pected have dipped significantly thereafter due to the Covid slowdown; but this is likely to be temporary and it is expected to go back up on a high growth path rapidly.
Excise duty is a tax imposed on the production of goods and also includes their licensing and sale and accrues to the central government. All manufactured goods used to be charged an excise duty, but this was subsumed under GST for most products in 2017. Today, excise duty applies only on key petroleum products and liquor; but is a significant revenue earner due to the rates and scales involved. Excise duty components include basic excise duty, a special additional excise duty, and also an infrastructure cess. The duties have steadily been rising: for instance, in 2014 they stood at Rs 3.56 and 9.48 per litre respectively for Diesel and Petrol; by 2021 these had increased to Rs 32.90 and 31.80 per litre for Petrol and Diesel respectively. The contribution of excise duty increased by around 145 percent from 2014–15 to 2016–17 and by a further 53 percent from 2016–17 to 2020–21, as shown in Figure 1. To put in perspective, provisional excise duty figures for key petroleum products stand upwards of Rs 3.7 trillion and about 1.9 percent of India’s nominal GDP for that year.[7]
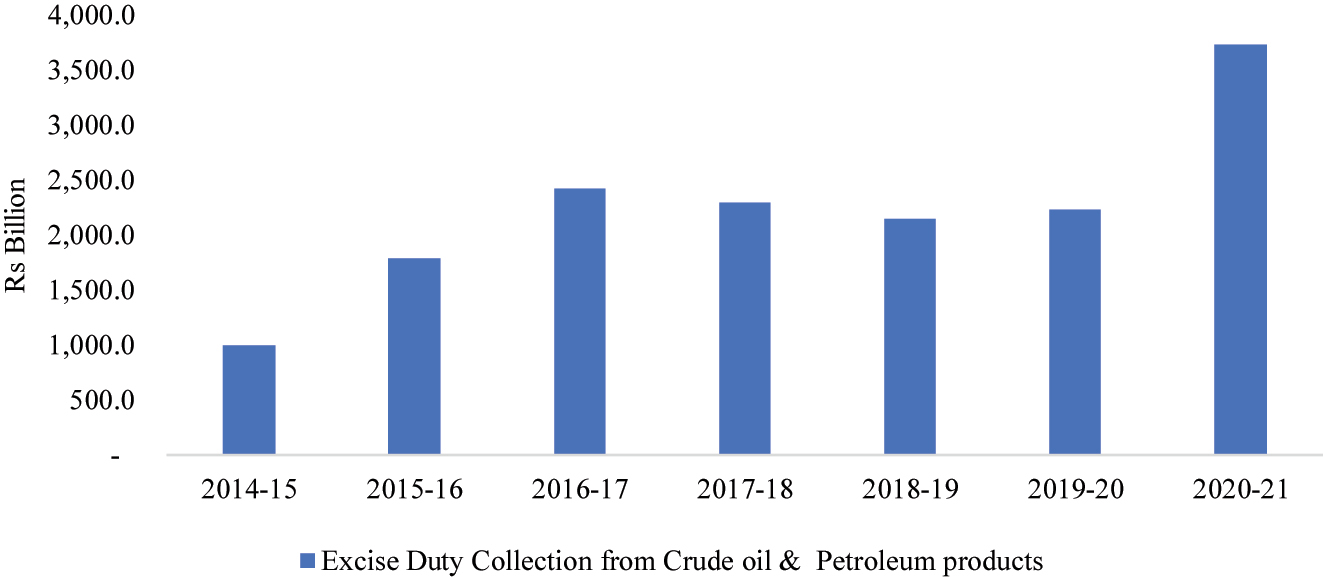
Excise duty collection from crude oil & petroleum products. Note: 2020–21 figures are provisions. Source: Petroleum Planning and Analysis Cell (PPAC), Ministry of Petroleum and Natural Gas, New Delhi. 1 crore = 10 million.
The Value Added Tax (VAT) replaced a complex set of sales taxes and therefore is a form of consumption tax imposed by the state governments and all revenues accrue to the states. VAT was first introduced in 2005 but it was fully implemented across India a decade later by 2014.[8] It varies widely across states. For instance, as of July 2021, the VAT on petrol was the highest in M.P with Rs 31.3 per litre while it was about half of that, Rs 16.8 per litre, in Andhra Pradesh. Similarly, the VAT on diesel was highest in Arunachal Pradesh with Rs 23.5 per litre and lowest in Andhra Pradesh at Rs 8.3 per litre. Its contribution has increased continuously over the years from 2014–15 to 2020–21, barring a slight fall in 2019–2020. If the petroleum products are included in the GST (there is no consensus on that yet) the VAT will be subsumed under it. Till then the VAT continues to be a significant source of revenue for state governments across India.
The royalty on crude oil is fixed as per the Oilfield (Regulation & Development) Act, 1948 which also provides that the royalty cannot exceed 20 percent of the well-head price. Royalties on output from offshore fields are payable to the central government whereas those from onshore areas are paid to the respective state in which it is located. The royalty rate for offshore areas is currently 10 percent of the well-head value of crude oil and natural gas. For onshore a,reas the rate of royalty is 12.5 percent in the case of crude oil and 10 percent in the case of natural gas. The contribution of royalty to both central and state exchequers has fluctuated over the years (Figure 2).
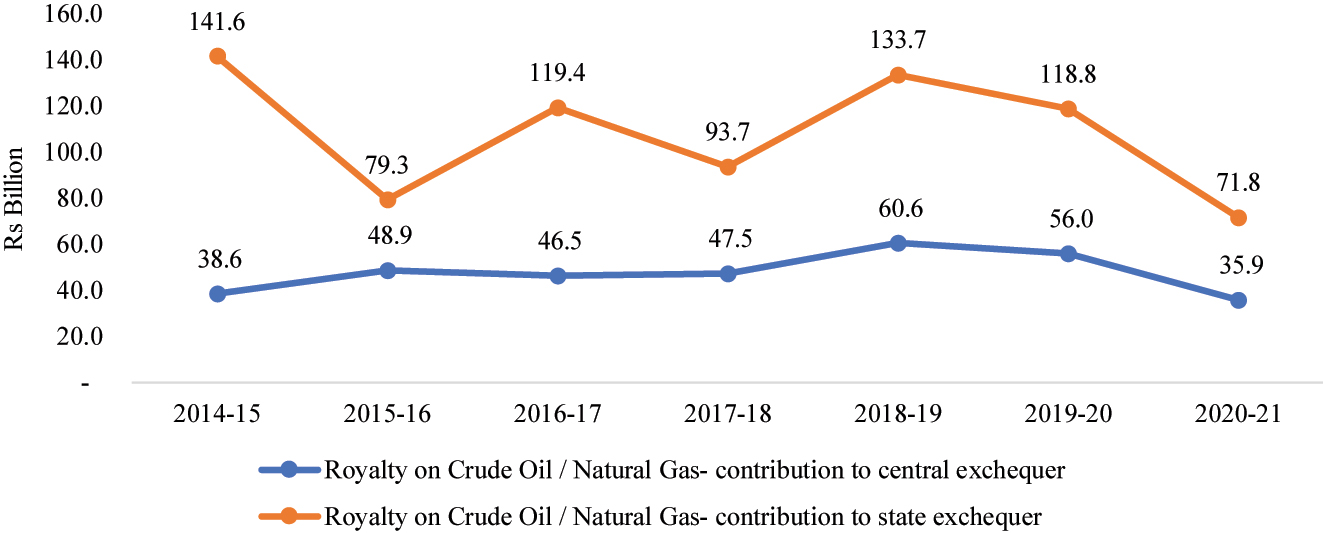
Royalty on crude oil and natural gas. Source: Petroleum Planning and Analysis Cell (PPAC), Ministry of Petroleum and Natural Gas, New Delhi.
Dividends are paid out by many companies with significant equity stake by central and state governments. These companies, or Public Sector Enterprises (PSEs), are involved in oil prospecting, extracting, processing and marketing. Though later some equity was divested by the government, a significant stake in petroleum companies continues to be held by the government. Companies such as ONGC, Indian Oil, BPCL, andGAIL are among India’s largest companies and continue to be majority owned by the government. As per the guidelines on capital restructuring of central public sector enterprises (CPSEs), it was prescribed in 2016 that CPSEs would pay a minimum annual dividend of 30 percent of profit after tax or 5 percent of the net worth whichever is higher. And in 2020, an advisory was issued that CPSEs should try to not just the minimum but higher than that and also try to pay on a quarterly basis rather than annual. of 2018–19 out of the total dividend received by the central government from all CPSEs, about 40 percent contribution is from thirteen oil and natural gas-based companies. Though some state governments also have a stake in energy companies that is a relatively small share of the total (Details in the Online Appendix for a list of PSEs and their subsidiaries).
The contribution of dividends differs greatly in terms of absolute numbers in central and state. Concerning contribution to the central exchequer, value increased from Rs 91.97 billion in 2014–15 to Rs 103.93 billion (P) in 2020–21, with the maximum contribution being in the year 2016–17 of Rs 175.01 billion (Table 4).
Dividend income from petroleum companies (Rs billion).
| 2014–15 | 2015–16 | 2016–17 | 2017–18 | 2018–19 | 2019–20 | 2020–21(P) | |
|---|---|---|---|---|---|---|---|
| Central Govt. | 91.97 | 102.17 | 175.01 | 145.75 | 155.25 | 122.70 | 103.93 |
| State Govt. | 0.28 | 0.95 | 1.83 | 2.62 | 1.95 | 2.15 | 3.79 |
-
Source: Petroleum Planning and Analysis Cell (PPAC), Ministry of Petroleum and Natural Gas, New Delhi.
3.1.2 Coal and Lignite
The taxation structure followed for coal is complex in India. Both central and state governments levy taxes on coal production. There are almost sixteen different taxes combined at both levels like NMET, excise duty, clean energy cess, royalty, direct mineral fund, etc. (see Appendix Table A3).[9] Coal mining royalties are 14 percent of the basic price, and are paid to the concerned state governments and include royalties from all companies public or private, those involved in mining for internal purposes (such as for iron smelting) or sale to the power sector. In addition, the National Mining Exploration tax (NMET) of 2 percent of the royalty is charged to be paid for funding exploration done by the government. Additionally, a payment to the District Mineral Foundation (DMF) is not more than a third of the royalty amount, and is to be decided by each concerned state. The DMF funds are to be used for the welfare of the mining-affected populations.
Unlike major petroleum products, coal does come under the ambit of GST with a rate of 5 percent that has remained the same since 2017. However, it also has a compensatory GST imposed on it. This ‘Clean Energy Cess’, was first introduced in 2010, as a form of a carbon tax on the production and import of coal, lignite and peat. Initially it was at a unit rate of Rs 50 per ton of coal mined or imported, and as later in 2016 increased to Rs 400. In addition, other levies include Paryavaran and Vikas Upkar (Environment and Development Favour/Levy) of Rs 23 per tonne and terminal tax of Rs. 2 per tonne is for southern coal fields only and also a Forest tax of Rs. 57 per tonne on coal fields located in western India only.
Coal India Limited is the largest of coal and lignite companies predominantly owned by the government. There are eight subsidiaries of Coal India Limited i.e. Bharat Coking Coal Limited (BCCL), Central Coalfields Limited (CCL), Eastern Coalfields Limited (ECL), Western Coalfields Limited (WCL), South Eastern Coalfields Limited (SECL), Northern Coalfields Limited (NCL), Mahanadi Coalfields Limited (MCL) and Central Mine Planning and Design Institute (CMPDI). The CMPDI is an engineering, design, and exploration company set up for preparing prospective plan(s), rendering consultancy services and undertaking exploration and drilling work to establish coal reserves in the country, and collection of detailed data for the preparation of projects for actual mining. The other seven subsidiaries of CIL are coal-producing companies. CIL and its subsidiaries are incorporated under the Companies Act, 1956, and are wholly owned by the Central Government. The coal mines in Assam and its neighboring areas are controlled directly by CIL under the unit North Eastern Coalfields. Other companies include Neyveli Lignite Corporation India Limited, Singareni Collieries Company Limited (SCCL), etc. Neyveli Lignite Corporation India Limited is under the administrative control of the Department of Coal. The company is engaged in the exploitation and excavation of lignite, generation of thermal power, and also the sale of raw lignite. SCCL is a joint undertaking of the Government of Andhra Pradesh and the Government of India. The equity capital is shared in the ratio of roughly 51:49 between Government of Andhra Pradesh and the Central Government respectively. The headquarters of the company is at Kothagudem in Andhra Pradesh SCCL produces about 10 % of the country’s coal production and 76 % of its production is despatched to the coal-based thermal power plants in Maharashtra, Andhra Pradesh, and Karnataka. The remaining part of SCCL’s coal production is supplied to the cement companies and other industries.
Data on dividend receipts from coal companies is not included in Table 5, but they are substantial. For instance, in the period 2015 to 2020 Coal India Limited was the highest dividend payer to the government with a combined amount of Rs 425.92 billion; this is over and above the corporate tax paid by Coal India Limited and other companies.[10] During this period there has however been a fall in dividends (Details in the Online Appendix) both due to lower dividends and reduced shareholding. The shareholding fell from 79.6 % in 2015–16 to 66.1 in 2020–21, and the total dividend fell from Rs. 173.06 billion in 2015–16 to Rs 77.03 billion crores in 2020–21. The corporate tax for coal companies has also been substantive. In the six-year period, the total corporation or profit tax of the government from coal companies was Rs. 484.06 billion, with the highest of Rs. 9,8.05 billion in 2019–20.
Payments to the government from Coal India Limited (Rs billion).
| Particulars | 2020–21 |
|---|---|
| Royalty | 96.9 |
| Additional royalty under MMDR Act | |
| DMF | 29.9 |
| NMET | 2.1 |
| Goods and service tax: | |
| CGST | 14.2 |
| SGST | 14.2 |
| IGST | 1.6 |
| GST compensation cess | 225.1 |
| Cess on coal | 20.5 |
| State sales tax/VAT | 0.1 |
| Central sales tax | 0.1 |
| Others | 15.4 |
| Total | 419.9 |
-
Source: Annual Report 2020–21, Coal India Limited. This table does not include the data from other Public Sector Coal Companies, however that data is available from individual company sources including websites.
3.2 Estimating the Share of Fossil Fuels in Government Revenues
We now calculate the total tax and non-tax revenue for coal, oil, and natural gas from the revenue sources mentioned above. In the process, we also compile gross tax revenue, total tax revenue, total non-tax revenue, and total revenue receipts both for the central government and state governments (UTs as well) for the year 2018–19 and 2019–20 (Detailed step by step methodology in the Online Appendix). While data for earlier years is hard to come by (for coal for instance) data for 2020–21 and current financial year (2021–22) are not available for some of the critical petroleum and coal products. Moreover, data on coal is not available at a detailed level and therefore can only be estimated at a relatively more aggregated level.
Appendix Tables A3 and A4 in Appendix details the revenues from various sources. Table 6 below summarizes the role of oil and natural gas and coal in revenue generation in India. The revenue generated from oil and natural gas both for 2018–19 and 2019–20 is significantly higher than that from coal in that the revenue from oil and natural gas is around 6 times higher than coal. Also, taxes, duties, and cess contribute almost 90 percent of the total revenue both for coal and oil and natural gas. The same trend is true for both the central state government (the Online Appendix provides details of different data sources used for calculating revenues from oil and natural gas and coal).
Sources of revenue from fossil fuel (Rs billion).
| 2018–19 | 2019–20 | |||||
|---|---|---|---|---|---|---|
| Oil & natural gas | Coala | Total | Oil & natural gas | Coala | Total | |
| Total revenue | 57.6 | 9.3 | 66.9 | 55.6 | 9.2 | 64.8 |
|
|
||||||
| Taxes, duties, and cess | 52.7 | 7.0 | 59.7 | 51.4 | 7.0 | 58.4 |
| Royalties, dividends | 4.9 | 2.3 | 7.2 | 4.2 | 2.2 | 6.4 |
|
|
||||||
| State revenue | 22.8 | 2.2 | 24.9 | 22.1 | 2.2 | 24.3 |
|
|
||||||
| Taxes, duties, and cess | 21.4 | 0.4 | 21.8 | 20.9 | 0.5 | 21.4 |
| Royalties, dividends | 1.4 | 1.7 | 3.1 | 1.2 | 1.7 | 2.9 |
|
|
||||||
| Central revenue | 34.8 | 7.2 | 42.0 | 33.5 | 7.0 | 40.5 |
|
|
||||||
| Taxes, duties, and cess | 31.3 | 6.6 | 37.8 | 30.5 | 6.5 | 37.0 |
| Royalties, dividends | 3.5 | 0.6 | 4.2 | 2.9 | 0.5 | 3.5 |
-
Source: Author calculations.aNote: Figures for coal are provisional. Also, dividends for coal companies other than Coal India Limited were not available and have not been included, these are likely to be a very small percentage of the total.
As Table 6 shows, the bulk of the revenues, at both central and state levels are emanating from taxes, though non-tax revenues are not insignificant either. We find that the bulk of the tax revenues are from the indirect taxes from petroleum products. Direct tax revenues for coal have also been falling over the last few years along with dividends. Moreover, provisional data from 2021 suggests that the indirect tax revenues from petroleum are likely to be significantly higher than those for the two years under consideration. In all likelihood even if petroleum products are shifted to the GST regime (with a top rate of 28 percent) additional surcharges or cesses can be introduced to enable a higher revenue from such fuels. Moreover, later we discuss the possible impact of imposing carbon taxes whose impact would naturally depend upon the rate.
To better illustrate the impact of fossil fuel revenues, consider the figures in Table 6. The table compares revenues from fossil fuels with GDP and also key areas of government budgetary expenditures. These estimates are for 2018–19 and 2019–20, the revenues are likely to be significantly higher in 2020–21 due to steep increases in indirect tax rates and higher petroleum prices.
Consider 2019–20 when the total revenues from fossil fuels for both central and state governments were Rs 648 thousand crores or Rs 6.48 trillion (CIL 2019, 2020, 2021; SCCL 2019, 2020). We compare this with India’s GDP and Government Budgets. Data on the GDP is available from Central Statistical Organization and that government budgets are available from various budgetary documents put out by the Ministry of Finance (Ministry of Finance 2020, 2021; Reserve Bank of India 2019, 2020).[11] Figures in Table 7 show that 3.2 percent of the country’s GDP for that year and almost 10 percent of total central and state governments’ budgets were accounted for by fossil fuel revenues for both central and state governments (Ministry of Statistics and Programme Implementation, Government of India). As column IV in the same table shows, revenues from fossil fuels are more than double that of India’s entire defence expenditure and three times those of both state and central governments’ health expenditures, and comparable to the entire public sector expenditure on education, sports, art, and culture (labeled as education in column I).
Key economic and budgetary figures of India 2019–20 (Rs ‘00 billion).
| Central | Stateb | Total | Total as % of GDP | |
|---|---|---|---|---|
| I | II | III | IV | V |
| Tax rev from fossil fuels | 37.0 | 21.4 | 58.4 | 2.9 |
| Non-tax rev from fossil fuels | 3.5 | 2.9 | 6.4 | 0.3 |
| Total revenue from fossil fuels | 40.5 | 24.3 | 64.8 | 3.2 |
| Compare with | ||||
| Govt. health expenditurea | 6.4 | 14.6 | 21.0 | 1.0 |
| Govt. education expenditurea | 9.5 | 56.8 | 66.3 | 3.3 |
| Defence expenditures | 31.6 | – | 31.6 | 1.6 |
| Total govt. budget expenditures | 269.9 | 400.6 | 670.5 | 33.0 |
| India’s GDP | 2034.0 | 100.0 |
-
Source: Government Budgetary Documents . aNote: This includes the transfers from central government, including Centrally Sponsored Schemes, Finance Commission Grants, and Other grants/loans. bNote: These are for all states combined. Education includes sports and art and culture. Health includes public health.
Appendix Tables A5 and A6 provide finer details on various elements of total fossil fuel revenues as a share of GDP and government expenditure. To summarize, therefore, revenues from fossil fuels are a significant component of India’s economy, and may even become more important in the immediate term, before starting to fall as the energy transition gains momentum. The next section attempts to study that transition using projections made by others.
3.3 Energy and Fiscal Transitions
The International Energy Association or IEA (2021a) projects energy usage under different scenarios, namely, Stated Policies Scenario (STEPS), India Vision Case (IVC), and Sustainable Development Scenario (SDS).
The Stated Policy Scenario or STEPS provides an assessment of the direction in which India’s energy system is heading, based on today’s policy settings and constraints and the assumption that COVID-19 will be under control by 2021. And the India Vision Case or IVC is based on a more ‘complete realization of India’s stated energy policy objectives. The IEA forecasts show limited differences between the two both in the overall electricity use, as well as the break-up. And this is natural given that a significant part of India’s energy use from fossil fuels is already committed for. Moreover, India has built a significant coal power infrastructure in recent years which would remain functional for a significant period of time.[12] The Sustainable Development Scenario, or SDS, is however significantly different that rests on some difficult assumptions on improving energy efficiency, taking on EVs, and a rapid movement away from coal. It ‘explores how India could mobilise an additional surge in clean energy investment to produce an early peak and rapid subsequent decline in emissions, consistent with a longer-term drive to net-zero, while accelerating progress towards a range of other sustainable development goals. The SDS scenario appears to be an unlikely scenario but is retained here in the interest of completeness.
3.3.1 The Base Case – Stated Policy Scenario (STEP)
Using these IEA (2021b) projections we can estimate the energy from each source including renewable energy, coal, oil, and natural gas for the years 2030 and 2040. All the projections of India’s energy use till 2030 and 2040 are made under the assumption of 5.4 percent annual economic growth.[13] Others have also attempted to estimate India’s future energy use based on growth assumptions. TERI-SHELL (2021) studied India’s energy transition for the period 2020–2050 under assumptions of 4.8 percent real GDP growth[14] and targeted Net Zero by 2050.[15] In the same study solar and wind are projected to produce 88 percent of the total electricity by 2050. The BP Energy Outlook for 2020 studies the period 2018–2050 and assumes GDP growth of 6 percent per annum and they project the energy sector to achieve net zero by 2070.[16] In the same report conditions for 2050 are predicated upon three assumptions. The rapid transition scenario where carbon emission from energy use falls around 70 percent by 2050; the net zero scenario under which carbon emission from energy use falls by 95 percent and business as usual where the carbon emission from energy use falls by 10 percent only. The base for comparison for all the scenarios is emission level in 2018. It is difficult to ascertain which of these projections is more realistic given the fluid conditions, rapidly changing technologies, and possible commitments by the government of India. Therefore, in the interest of comparability, we use the IEA real growth estimates for India as a benchmark for studying how the fiscal might be affected under prevalent energy transition scenarios.
We take as a given that the prices of all fossil fuels and exchange rates are as those ruling currently, we also assume that tax and non-tax revenues also change proportionately with the use of fossil fuels. (Of course, if high levels of carbon taxes are instituted, revenue shares from fossil fuels can be expected to shoot up initially before starting to fall, we however do not investigate that scenario). The forecasted menu of energy sources is converted to fuel quantities using a conversion factor of energy use to the quantity of different fuels (details in the Online Appendix). This enables us to calculate the quantity of coal, oil, and natural gas required in 2019, 2030, and 2040 from the IEA estimates. The revenue received from each of these sources under various tax categories has then been estimated for 2019–20. Using this we obtain a value of ‘revenue per unit’ for coal, oil and natural gas for each revenue category for 2019–20. Assuming that the tax rates and price of these commodities remain the same, we use this revenue per unit to project revenues for the year 2030 and 2040.
We do not include GST paid on inputs, input services, and capital goods (input tax credits foregone) by businesses dealing in the production and distribution of petroleum products which are outside the GST net. These taxes are a small and insignificant percentage of the total revenues from fossil fuels and therefore this absence would not significantly introduce a downward bias. Moreover, some data is available for the financial year (April to March) and some on a calendar year basis, which we treat as the same.
Further, we calculate the total central and state government revenues as a share of GDP in 2019–20. Assuming the revenue to GDP ratio remains constant,[17] and using the projected GDP for India in 2030 and 2040, we estimate total government revenue for these years separately for central and state, and UT governments. The GDP and overall government revenues for 2030 and 2040 are then used as a denominator to study how the fossil fuel revenues will change over time relative to overall government revenues (Table A1 and A2).
Tables 10A and 10B displays the projections under the base case i.e. Stated Policy Scenario. First, consider Table 10A. While the revenues from fossil fuels are expected to rise (Col 2), the increase is expected to be lower than economic growth. Therefore, as a share of GDP, they are all expected to fall significantly from 3.2 to 1 percent from 2019 to 2040 for the central and state governments combined. Column 4 of the same table shows that for the central government combined tax and non-tax revenues from fossil fuels account for 15 percent of total budgetary expenditures in 2019, and are projected to fall to 10.8 percent and 4.5 percent in 2030 and 2040 respectively. For the state governments, the revenue from fossil fuels as a share of total expenditure was 6.2 percent in 2019 and is projected to fall to 5.4 percent and 2.0 percent in 2030 and 2040 respectively.
We next consider fossil fuel revenues as a share of total government revenues. Column 3 in Table 10B shows fossil fuel revenues as a share of total government revenues assuming nominal GDP growth of 10 percent and constant deficit levels. In other words, the denominator in column 3 assumes that fossil fuel revenue reduction would be covered by some other revenue source. For the central government, 20.8 percent of total revenue came from fossil fuels in 2019: given ceteris paribus assumptions it is projected to fall to 10.7 percent in 2030 and 6.3 percent in 2040. The share is not insignificant even in 2040. For state government, 8.3 percent of total revenue came from fossil fuels in 2019: it is projected to fall to 5.1 percent in 2030 and 2.6 percent in 2040. Note that, although these figures are not directly comparable to Prayas (2021) since these estimates include dividend income and also do not consider renewable and other electricity, for 2019–20 the latter estimated the share of coal, petroleum, gas, and electricity revenues in total revenue receipts for center and state to be 18.8 percent and 9.8 percent respectively. Next, consider Column 4 which uses revenues from all non-fossil sources as the denominator. As is evident not only are the revenue shares higher, their fall would be far steeper if there is no compensation for the revenue loss as implicitly assumed in the previous column, further underscoring the high dependence levels of budgetary revenues on fossil fuels.
Fossil fuel revenues are changing through three underlying forces. First, the composition of energy is changing from those sources that are taxed highly (petroleum) to those that are less so (renewables). Second, aggregate energy efficiency levels are expected to increase and therefore there is a greater increase in output than the energy required. And third, implicitly we have assumed stable prices for energy while we are assuming nominal growth of 10 percent in the GDP. We now look at each of these aspects.
As shown in Tables 8 and 9, in the three IEA scenarios the energy requirement in India changes on two accounts. First, the total energy required changes from 928 in 2019 to 1,235 in 2030 and 1,537 in 2040 in the stated policy scenario. Similarly, the total energy required changes from 928 to 1,152 and 1,521 in India Vison Case and 928 to 994 to 1,147 in the Sustainable development scenario. The energy required in the sustainable development scenario is less than what is required in other the two cases. This difference is driven by the amount of coal required in all three scenarios. The energy loss in the case of coal is much higher than the renewable sources. In the sustainable development scenario, the amount of coal required is less and renewable sources are higher, hence the total energy required is lesser.This highlights the second source of change i.e. the change in the composition of the total energy required in the three scenarios.
India energy use projections under different scenarios (Unit Mtoe).
| Source | A: Stated policy scenario | B: Sustainable development scenario | C: India vision case | ||||||
|---|---|---|---|---|---|---|---|---|---|
| 2019 | 2030 | 2040 | 2019 | 2030 | 2040 | 2019 | 2030 | 2040 | |
| Coal | 413 | 498 | 541 | 413 | 318 | 209 | 413 | 463 | 497 |
| Oil | 242 | 335 | 411 | 242 | 292 | 268 | 242 | 325 | 379 |
| Natural gas | 55 | 113 | 173 | 55 | 124 | 181 | 55 | 129 | 215 |
| Nuclear | 10 | 28 | 58 | 10 | 28 | 64 | 10 | 28 | 58 |
| Hydro | 15 | 19 | 26 | 15 | 22 | 31 | 15 | 19 | 26 |
| Bioenergy | 182 | 188 | 204 | 182 | 120 | 169 | 182 | 116 | 158 |
| Other renewable | 11 | 54 | 160 | 11 | 90 | 225 | 11 | 72 | 188 |
| Total | 928 | 1,235 | 1,573 | 928 | 994 | 1,147 | 928 | 1,152 | 1,521 |
-
Source: IEA (2021a) Note: In million tonnes of oil equivalent (Mtoe).
India energy use projections under different scenarios (as percentage of total).
| Source | A: Stated policy scenario | B: Sustainable development scenario | C: India vision case | ||||||
|---|---|---|---|---|---|---|---|---|---|
| 2019 | 2030 | 2040 | 2019 | 2030 | 2040 | 2019 | 2030 | 2040 | |
| Coal | 44.5 | 40.3 | 34.4 | 44.5 | 32.0 | 18.2 | 44.5 | 40.2 | 32.7 |
| Oil | 26.1 | 27.1 | 26.1 | 26.1 | 29.4 | 23.4 | 26.1 | 28.2 | 24.9 |
| Natural gas | 5.9 | 9.1 | 11.0 | 5.9 | 12.5 | 15.8 | 5.9 | 11.2 | 14.1 |
| Nuclear | 1.1 | 2.3 | 3.7 | 1.1 | 2.8 | 5.6 | 1.1 | 2.4 | 3.8 |
| Hydro | 1.6 | 1.5 | 1.7 | 1.6 | 2.2 | 2.7 | 1.6 | 1.6 | 1.7 |
| Bioenergy | 19.6 | 15.2 | 13.0 | 19.6 | 12.1 | 14.7 | 19.6 | 10.1 | 10.4 |
| Other renewable | 1.2 | 4.4 | 10.2 | 1.2 | 9.1 | 19.6 | 1.2 | 6.3 | 12.4 |
| Total | 100.0 | 100.0 | 100.0 | 100.0 | 100.0 | 100.0 | 100.0 | 100.0 | 100.0 |
Column 5 in Table 10B helps decipher the composition effect. As mentioned, there are two underlying sources of the reduction, (a) the composition of energy sources is expected to change, more towards RE and Natural Gas and less in fossil fuels, and (b) the change in the overall use of energy. Column 5 shows the expected share of revenues due to a change in the distribution of energy sources, keeping total energy use constant at 2019 levels. We calculate how the ratio with revenue changes only taking into account the composition change in Table 10B col. 5. The share reduces from 13.3 percent in 2019 to 5.7 percent in 2030 and 2.3 percent in 2040 (total central and state combined). In this case, the fall is steeper as we are not including the change so account of the total energy requirement. The difference between Columns 3 and 5 is that due to the change in aggregate energy use. Significantly, the bulk of the reduction is accounted for by the changes in composition levels, what we term the composition effect.
Government revenues from fossil fuels as share of GDP (base Case).
| In Rs billion | As share of GDP | As share of government expenditure | |
|---|---|---|---|
| (1) | (2) | (3) | (4) |
| Central government fossil revenue | |||
|
|
|||
| 2019 | 4,047.5 | 2.0 | 15.0 |
| 2030 | 7,030.3 | 1.1 | 10.8 |
| 2040 | 9,953.7 | 0.6 | 4.5 |
|
|
|||
| State government fossil revenue | |||
|
|
|||
| 2019 | 2,427.1 | 1.2 | 6.2 |
| 2030 | 4,347.5 | 0.7 | 5.4 |
| 2040 | 6,253.8 | 0.4 | 2.0 |
|
|
|||
| Total central and state government fossil revenue | |||
|
|
|||
| 2019 | 6,474.6 | 3.2 | 9.8 |
| 2030 | 11,377.8 | 1.8 | 7.8 |
| 2040 | 16,207.5 | 1.0 | 3.0 |
-
Note: Overall government budget figures have been projected at a GDP real growth rate of 5.5 percent and nominal at 10 percent. And future budgetary expenditures and revenues are projected at a 10 percent nominal growth rate. The composition effect captures the scenario where the total energy required in 2030 and 2040 remains 928 MTOE but the distribution among different sources changes.
Government revenues from fossil fuels (base Case).
| In Rs billion | As a share of total government revenue | As a share of non-fossil government revenues | As a share of total government revenue (composition effect) | |
|---|---|---|---|---|
| (1) | (2) | (3) | (4) | (5) |
| Central government fossil revenue | ||||
|
|
||||
| 2019 | 4,047.5 | 20.8 | 26.2 | 20.8 |
| 2030 | 7,030.3 | 10.7 | 14.5 | 8.1 |
| 2040 | 9,953.7 | 6.3 | 7.9 | 3.4 |
|
|
||||
| State government fossil revenue | ||||
|
|
||||
| 2019 | 2,427.1 | 8.3 | 9.0 | 8.3 |
| 2030 | 4,347.5 | 5.1 | 5.1 | 3.8 |
| 2040 | 6,253.8 | 2.6 | 2.9 | 1.9 |
|
|
||||
| Total central and state government fossil revenue | ||||
|
|
||||
| 2019 | 6,474.6 | 13.3 | 15.3 | 13.3 |
| 2030 | 11,377.8 | 7.6 | 8.5 | 5.7 |
| 2040 | 16,207.5 | 4.1 | 4.7 | 2.3 |
-
Note: Central government revenues are as a share of total central government revenues in column 5 (or expenditures in col 4) and those for the state are as a share of total state government revenues in column 5 (or expenditures in col 4). Total is an aggregate of the two. Overall government budget figures have been projected at a GDP real growth rate of 4.5 percent and 10 percent which is in sync with expected nominal growth. And future budgetary expenditures and revenues are projected at a 10 percent nominal growth rate. The composition effect captures the scenario where the total energy required in 2030 and 2040 remains 928 MTOE but the distribution among different sources changes.
It is quite evident that as we move towards greater use of RE, the upward pressure on fossil fuel prices will reduce and there may be a significant reduction in fossil fuel prices. If that were the case ad valorem taxes would yield lower revenues than what we have assumed. Conversely, unforeseeable events including supply shocks could push up fossil fuel prices. We, therefore, look at the base case with a 4.5 percent annual increase, and a 4.5 percent annual reduction in fossil fuel prices (comparable to the 4.5 percent inflation figure assumed in our nominal growth of 10 percent assumption). See Table 10C below.
Price change for fossil.
| Fossil fuel revenue as share of GDP | |||
|---|---|---|---|
| No price increase (base case) | |||
| Central + state | State | Center | |
| 2019 | 3.2 | 1.2 | 2.0 |
| 2030 | 1.8 | 0.7 | 1.1 |
| 2040 | 1.0 | 0.4 | 0.6 |
|
|
|||
| 4.5 percent inflation | |||
|
|
|||
| 2019 | 3.2 | 1.2 | 2.0 |
| 2030 | 3.0 | 1.1 | 1.9 |
| 2040 | 1.7 | 0.6 | 1.0 |
|
|
|||
| 4.5 percent deflation | |||
|
|
|||
| 2019 | 3.2 | 1.2 | 2.0 |
| 2030 | 1.0 | 0.4 | 0.6 |
| 2040 | 0.6 | 0.2 | 0.3 |
In the case of 4.5 percent annual change in the price of fossil fuels, the fossil fuel revenue as the share of GDP changes from 3.2 percent in 2019 to 3 percent in 2030 and 1.7 percent in 2040. The fall in revenue as a share of GDP is quite less in the case of 4.5 percent price rise. We also consider a case where the price falls 4.5 percent annually and in this case the share changes from 3.2 percent in 2019 to 1 percent in 2030 and 0.6 percent in 2040 (4 percent scenario in Table A7 and A8 Online Appendix).
To summarize, it is apparent that under the base case and with fairly standard assumptions on prices and growth, we find that revenues from fossil fuels will increase over the next two decades, even if tax rates and the price of fuels do not increase. However, both as a share of GDP and the size of government budgets at both central and state levels, the share of fossil fuel revenues is likely to fall significantly. This is because of the expected growth in fossil-based energy use is significantly lower than expected GDP growth (assumed to be 10 percent nominal and 5.4 percent real annual growth rate). Also, note that compared to current levels, the decline in revenue share from fossil fuels will be far more for the central government than for state governments. And therefore, the impact on fiscal transition will be far more for India’s federal/central government than for sub-national governments. If, however, carbon taxes are imposed, it would be a different story altogether and this is discussed later.
Next consider Table 11, where we compare the base case with other cases. We find that the Sustainable Policy Scenario and the India Vision Case yield similar results with minor differences when compared as a share of total government revenues. The sustainable development case for the year 2030 yields very similar scenarios, this is because by 2030 it is expected in both the scenarios that the consumption of coal will fall significantly but not that of oil and natural gas. As mentioned earlier, per unit of energy, coal accounts for lower revenues than oil and natural gas products. Thus, the base case and sustainable development case have almost similar projections for 2030.
Government revenues from fossil fuels as a share of government revenues.
| BASE CASE – stated policy scenario | Sustainable development case | India vision case | |
|---|---|---|---|
| Total central and state government fossil revenue | |||
|
|
|||
| 2019 | 13.3 | 13.3 | 13.3 |
| 2030 | 7.6 | 7.6 | 8.2 |
| 2040 | 4.1 | 3.8 | 4.7 |
|
|
|||
| State government fossil revenue | |||
|
|
|||
| 2019 | 8.3 | 8.3 | 8.3 |
| 2030 | 5.1 | 5.2 | 5.6 |
| 2040 | 2.6 | 2.5 | 3.1 |
|
|
|||
| Central government fossil revenue | |||
|
|
|||
| 2019 | 20.8 | 20.8 | 20.8 |
| 2030 | 10.7 | 10.7 | 11.6 |
| 2040 | 6.3 | 5.7 | 7.3 |
-
Note: Central government revenues are as a share of total central government revenues and those for state are as a share of total state government revenues. Total are an aggregate of the two.
By 2040 however, the differences in outcomes become somewhat better defined as the consumption of oil and natural gas along with coal falls significantly more in the sustainable case in comparison to the base case. The total central and state government revenues from fossil fuels as a share of total government revenues is 4.1 percent in the base case but 3.8 percent in the sustainable development case. In the India Vision Case, however though coal and oil use are significantly lower, the use of natural gas is significantly higher than in the base case. Hence, the calculation shows a higher fossil fuel revenue share due to the high rates of taxation on natural gas.
4 Emerging Issues in Fossil Fuel Taxation
India has taken several measures both on the regulatory and fiscal side that would help enable an efficient energy transition. For example, it achieved more than five times increase in the installed capacity of renewable energy between 2015 and 2022. Other announced policies, including those on urban development (Smart Cities), cleaning of rivers (Namami Gange), and sanitation (Swachh Bharat Mission) are only some examples of programmes that are in sync with potential climate change developments. And this also spans programmes on cleaning up of manufacturing emissions such as the Perform, Achieve, and Trade (PAT) scheme that aims to decrease energy consumption in industry and thereby reduce emissions. India’s National Energy Policy reiterates the importance of de-carbonisation through the twin interventions of energy efficiency and renewable energy. These are all policies that are in line with the sustainability vision and will play out in different ways. India has also used fiscal tools to reduce emissions. Previous sections have already discussed the high taxation on fossil fuels.
At the same time issues such as Net Zero, Carbon Taxation, and reducing Subsidies on fossil fuels are increasingly being discussed in the public domain. Consider Net Zero first. As discussed in previous sections, under various assumptions related to actions on sustainability, India’s energy portfolio will arguably not vary significantly in 2030 and 2040. This is because whether India chooses a Net Zero of 2060 or 2070 or later, the additional burden of the energy and fiscal transitions will be felt later and not significantly in 2030 and 2040.
Next, consider energy subsidies. The Indian government has been subsidizing many sources of energy mostly for reasons of welfare, equity, supporting public sector commercial entities, and also industry. Till 2017 concessional excise and custom (import) duties applied to coal. Since then, however, coal has been brought under the ambit of a very low rate of GST of 5 percent plus Rs 400 Compensation cess. Reduction and easing of compliance requirements of norms is another component of a tacit subsidy regime that applies to coal.[18] Overall coal subsidies have been estimated at slightly less than Rs 150.0 billion in 2020, and steadily falling from Rs 215.2 billion in 2014. On petroleum and natural gas, subsidies were falling steadily till 2017, but have risen steadily since. From 2017 onwards the bulk of the subsidies are associated with LPG or cooking gas, with greater coverage of LPG as a cooking medium through the central government’s Ujjwala program. The subsidies themselves are on account of a low GST as well as direct benefit transfers to the users and have been estimated at Rs 556.70 billion in 2020 down from 2,161.4 billion in 2014. These include both revenues foregone on account of lower rates on LPG and income support through direct benefit transfers. The key finding is that fossil fuel subsidies have been falling steadily in the last decade apart from those associated with LPG for cooking. Figure 3 shows that the amount of subsidy declined from 2014 to 2017, but has increased somewhat since.
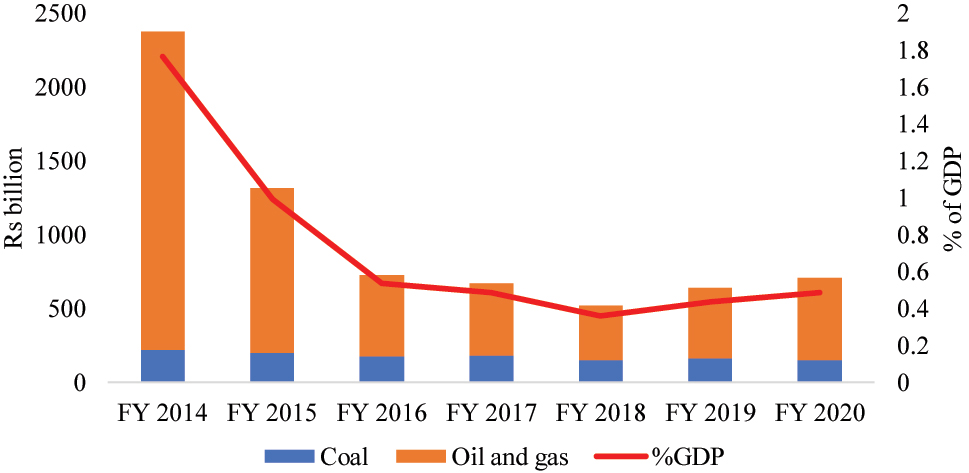
Subsidy for coal, oil and gas. Source: Authors’ calculation using IISD (2021).
While in FY 2020 government revenues from coal, oil, and natural gas were 3.2 percent of GDP the subsidy for the same was 0.5 percent of GDP. One of the key issues here has to do with the objective of supplying subsidised cooking gas to the underprivileged and these are unlikely to fall. Unless a significant shift occurs to electricity-based cooking, reduction in such subsidies appears unlikely. In other words, these subsidies are independent of the high levels of taxation on fossil fuels and are unlikely to change significantly due to welfare considerations, irrespective of its other actions on the sustainability front.
Finally, consider Carbon Taxes. To our knowledge, there are no universally acknowledged ‘correct’ rates for carbon taxes. Although petroleum products are taxed heavily in India, to date India does not have any tax that directly focuses on carbon emissions and which is levied on fuels based on their greenhouse gas (GHG) emissions.
To assess the impact of a carbon tax, we use the framework provided in Parry, Mylonas, and Vernon (2017) in an IMF working paper. Accordingly, a rate of USD 10 per tonne of CO2 is imposed in 2020 which is gradually increased to USD 35 in 2030 and is expected to remain at the same level afterwards. Also, we use the emission factor of each fuel provided in the Economic Survey of India to calculate the quantity of CO2 emissions from coal, oil, and natural gas for different years. If we impose a carbon tax on the same lines, the revenue generated would be 1.4 percent of GDP in 2019, which will be 2.3 and 1.2 percent in 2030 and 2040 respectively (Table 12). The revenue from the carbon tax will be less than the revenue generated from the existing taxes in 2019 but going forward in 2030 and 2040 the revenue from carbon taxes will be higher. There are two reasons for this trend, first the carbon tax rate in 2019 is lower than that in 2030 and 2040; second, the quantity of coal, oil, and natural gas fall gradually in 2030 and 2040. As the quantity of coal used is expected to fall more than that of oil and natural gas the difference in revenue under the existing system and carbon tax comes from coal-based revenue.
Revenue from carbon tax.
| 2019 | 2030 | 2040 | |
|---|---|---|---|
| Revenue from existing tax sources | 3.2 | 1.8 | 1.0 |
|
|
|||
| Coal | 0.5 | 0.2 | 0.1 |
| Oil and natural gas | 2.7 | 1.6 | 0.9 |
|
|
|||
| Revenue from carbon tax | 1.4 | 2.3 | 1.2 |
|
|
|||
| Coal | 0.6 | 0.8 | 0.4 |
| Oil and natural gas | 0.7 | 1.5 | 0.8 |
-
Assumptions: In 2019, carbon tax of USD 10/ton C02 and in 2030 and 2040 of USD 35/ton CO2 and exchange rate Rs 65/USD.
High carbon taxes however have many dimensions, including those on effectiveness, impact on growth, and equity. For instance, if LPG is taxed more, we would expect LPG subsidies also to rise commensurately. Moreover, for a country where the bulk of energy production occurs in or through the public sector, a shift towards renewables need not require price signals with associated economic and equity costs. In other words, given that the bulk of the energy sector is under the public domain price signals will have limited power to encourage a faster shift away from coal.
The way energy and revenue transition will work out for different Indian states is another important issue. In this paper, we do not analyse this issue for individual states butbased on latest available revenue estimates, it is clear that the impact will not be uniform. Maharashtra, UP and Tamil Nadu are the top three states receiving revenues from petroleum-based products. It is also quite high for Andhra Pradesh, Telangana, Karnataka, and Gujarat. More than 50 percent of the total petroleum-based revenue in 2020–21 is collected by these seven states collectively and the same is true for 2018–19 and 2019–20 as well. The decline in consumption of petroleum products will affect the exchequer of these states more in comparison to others. Similarly, going forward based on energy transition goals, as the usage of coal declines, its impact across states will be uneven. India has the fifth largest coal reserves and is the second largest producer of coal in the world. However, almost 70 percent of the total coal produced in India comes from five states Jharkhand, Chattisgarh, Odisha, West Bengal, and Madhya Pradesh. Naturally, any decision to move away from coal is going to affect these states more in comparison to others.
As we have quantified earlier, the dependence of both the Central and State governments for revenues on coal, oil, and natural gas is very high. Going forward, as the use of fossil fuel is expected to reduce it is crucial to explore other sources of revenue. In the energy sector, the following sectors could arguably be taxed: electricity used in electric vehicles, sale of hydrogen, and biofuels, batteries, renewable electricity, etc. But there are issues related to both the environment and adequacy which needs to be researched and discussed in greater detail. Other avenues for the Government include improving tax buoyancy by increasing the tax net, reforming the direct tax code, and most importantly reducing informality; these will increase the tax buoyancy many folds.
5 Concluding Comments
India’s energy sector is in the early stages of transition from fossil fuels to renewable sources. The final outcome of this process will be decided by many factors including the GDP growth rate, price of renewable energy related technology, investment in new energy infrastructure, etc. One key aspect of this transition is the government’s dependence on fossil fuels for revenue. On average, petroleum taxes contributed over 2 percent of GDP during the last decade (Mukherjee 2020). Excise duty from petroleum products alone now contributes 85–90 percent of all excise collected by the Union Government, accounting for roughly 24 percent of indirect tax revenue in 2018–19 by the government’s own estimates.[19] Both the central and state governments’ reliance on fossil-fuel based taxes has increased considerably over the last few years. Based on the methodology explained earlier, we calculate the revenue that the Centre and State government in India receive from Coal, Oil, and Natural gas for the year 2019 and find it to be a significant share of total revenues and higher than estimated by others. We further, project the same for 2030 and 2040 as well and find that under different scenarios there is likely to be an increase in the quantum of fossil fuel revenues due to an increase in their use, and there will be a significant fall in the share of revenues accruing from fossil fuels. In other words, both central and state governments will be forced to depend less on fossil fuels relative to the size of their budgets.
Finally, this study shows some light on both the change in quantum and share of revenues, as India transitions to a low carbon economy. Other studies need to be conducted on the impact of this transition on India’s foreign exchange outflows, infrastructure, and investment requirements, and also the changing nature of India’s largely public sector-driven energy industry to one where the private sector and public private partnerships play an important role. We have also not looked at how the transition will impact revenues at the state level which will vary depending upon their resource base (presence of fossil fuel mining), economic structure (demand for energy), and income levels. We believe these are important issues that future research needs to consider.
***
Average Tax-GDP ratio with 10 % nominal GDP growth (2030).
| Average tax/non-tax to GDP ratio | ||||||
|---|---|---|---|---|---|---|
| % of GDP | % of gross revenue | |||||
| Total | Coal | Oil & natural gas | Total | Coal | Oil & natural gas | |
| Total revenue share | ||||||
|
|
||||||
| 2019 | 3.2 | 0.5 | 2.7 | 13.25 | 1.88 | 11.37 |
| Taxes, duties and cess | 2.9 | 0.3 | 2.5 | 17.16 | 2.05 | 15.11 |
| Royalties, dividends | 0.3 | 0.1 | 0.2 | 4.29 | 1.49 | 2.79 |
| 2030 | 1.8 | 0.2 | 1.6 | 7.57 | 0.74 | 6.83 |
| Taxes, duties and cess | 1.6 | 0.1 | 1.5 | 9.60 | 0.78 | 8.82 |
| Royalties, dividends | 0.2 | 0.0 | 0.1 | 2.42 | 0.63 | 1.80 |
|
|
||||||
| State revenue share | ||||||
|
|
||||||
| 2019 | 1.2 | 0.1 | 1.1 | 8.26 | 0.74 | 7.52 |
| Taxes, duties and cess | 1.0 | 0.0 | 1.0 | 10.45 | 0.23 | 10.23 |
| Royalties, dividends | 0.1 | 0.1 | 0.1 | 3.24 | 1.89 | 1.35 |
| 2030 | 0.7 | 0.04 | 0.6 | 5.12 | 0.31 | 4.82 |
| Taxes, duties and cess | 0.6 | 0.01 | 0.6 | 6.32 | 0.09 | 6.23 |
| Royalties, dividends | 0.1 | 0.03 | 0.0 | 1.88 | 0.90 | 0.98 |
|
|
||||||
| Central revenue | ||||||
|
|
||||||
| 2019 | 2.0 | 0.3 | 1.6 | 20.8 | 3.6 | 17.2 |
| Taxes, duties and cess | 1.8 | 0.3 | 1.5 | 27.2 | 4.8 | 22.4 |
| Royalties, dividends | 0.2 | 0.0 | 0.1 | 5.9 | 0.9 | 5.0 |
| 2030 | 1.1 | 0.1 | 1.0 | 10.7 | 1.3 | 9.4 |
| Taxes, duties and cess | 1.0 | 0.1 | 0.9 | 14.1 | 1.7 | 12.4 |
| Royalties, dividends | 0.1 | 0.0 | 0.1 | 3.1 | 0.3 | 2.7 |
Average Tax-GDP ratio with 10 % nominal GDP growth (2040).
| % of GDP | % of gross revenue | |||||
|---|---|---|---|---|---|---|
| Total | Coal | Oil & natural gas | Total | Coal | Oil & natural gas | |
| Total revenue share | ||||||
|
|
||||||
| 2019 | 3.2 | 0.5 | 2.7 | 13.25 | 1.88 | 11.37 |
| Taxes, duties and cess | 2.9 | 0.3 | 2.5 | 17.16 | 2.05 | 15.11 |
| Royalties, dividends | 0.3 | 0.1 | 0.2 | 4.29 | 1.49 | 2.79 |
| 2040 | 1.0 | 0.1 | 0.9 | 4.07 | 0.30 | 3.77 |
| Taxes, duties and cess | 0.9 | 0.1 | 0.8 | 5.34 | 0.33 | 5.01 |
| Royalties, dividends | 0.1 | 0.0 | 0.1 | 1.17 | 0.24 | 0.93 |
|
|
||||||
| State revenue share | ||||||
|
|
||||||
| 2019 | 1.2 | 0.1 | 1.1 | 8.26 | 0.74 | 7.52 |
| Taxes, duties and cess | 1.0 | 0.0 | 1.0 | 10.45 | 0.23 | 10.23 |
| Royalties, dividends | 0.1 | 0.1 | 0.1 | 3.24 | 1.89 | 1.35 |
| 2040 | 0.4 | 0.02 | 0.4 | 2.61 | 0.12 | 2.49 |
| Taxes, duties and cess | 0.3 | 0.00 | 0.3 | 3.43 | 0.04 | 3.39 |
| Royalties, dividends | 0.0 | 0.01 | 0.0 | 0.75 | 0.30 | 0.45 |
|
|
||||||
| Central revenue | ||||||
|
|
||||||
| 2019 | 2.0 | 0.3 | 1.6 | 20.8 | 3.6 | 17.2 |
| Taxes, duties and cess | 1.8 | 0.3 | 1.5 | 27.2 | 4.8 | 22.4 |
| Royalties, dividends | 0.2 | 0.0 | 0.1 | 5.9 | 0.9 | 5.0 |
| 2040 | 0.6 | 0.1 | 0.5 | 6.3 | 0.6 | 5.7 |
| Taxes, duties and cess | 0.5 | 0.1 | 0.5 | 8.2 | 0.8 | 7.4 |
| Royalties, dividends | 0.1 | 0.0 | 0.0 | 1.8 | 0.1 | 1.7 |
Tax related to Coal.
| Central government | State government |
|---|---|
| NMET | Royalty |
| Stowing excise duty | Direct mineral fund |
| Clean energy cess | Value added tax |
| Basic custom duty | Entry tax |
| Countervailing duty | State cess on coal |
| Excise duty | |
| Central sales tax | |
| GST compensation cess | |
| Mixed | |
| Non CIL coal | |
| Corporate tax |
Dividend and corporate tax for coal (Rs. Billion).
| Year | Dividend to the government | Corporate tax of all coal companies |
|---|---|---|
| 2015–16 | 137.76 | 86.52 |
| 2016–17 | 96.72 | 84.71 |
| 2017–18 | 80.40 | 63.03 |
| 2018–19 | 58.60 | 76.92 |
| 2019–20 | 52.43 | 98.05 |
| 2020–21 | 50.91 | 74.81 |
| Total | 425.92 | 484.06 |
-
Source: Dividends to the government are available from Annual Report Coal India Ltd, Corporation or Profit Tax is available from CMIE PROWESS database of all Coal companies.
Revenues from fossil fuel as a percentage of total government expenditures.
| 2018–19 | 2019–20 | |||||
|---|---|---|---|---|---|---|
| Oil & natural gas | Coal | Total | Oil & natural gas | Coal | Total | |
| Total revenue | 10.2 | 1.7 | 11.8 | 8.4 | 1.4 | 9.8 |
|
|
||||||
| Taxes, duties and cess | 9.3 | 1.2 | 10.6 | 7.8 | 1.1 | 8.9 |
| Royalties, dividends | 0.9 | 0.4 | 1.3 | 0.6 | 0.3 | 1.0 |
|
|
||||||
| State revenue | 6.8 | 0.6 | 7.5 | 5.7 | 0.6 | 6.2 |
|
|
||||||
| Taxes, duties and cess | 6.4 | 0.1 | 6.5 | 5.4 | 0.1 | 5.5 |
| Royalties, dividends | 0.4 | 0.5 | 0.9 | 0.3 | 0.4 | 0.7 |
|
|
||||||
| Central revenue | 15.0 | 3.1 | 18.1 | 12.4 | 2.6 | 15.0 |
|
|
||||||
| Taxes, duties and cess | 13.5 | 2.8 | 16.3 | 11.3 | 2.4 | 13.7 |
| Royalties, dividends | 1.5 | 0.3 | 1.8 | 1.1 | 0.2 | 1.3 |
-
Source: PPAC and Authors’ calculations from different sources. Note: The figures under central government are as a share of central government expenditure for those years, for state government are combined state and UT government expenditure, for those years, and the total is aggregate of the two.
Revenues from fossil fuels as a percentage of India’s GDP.
| 2018–19 | 2019–20 | |||||
|---|---|---|---|---|---|---|
| Oil & natural gas | Coal | Total | Oil & natural gas | Coal | Total | |
| Total central and state revenue | 3.03 | 0.49 | 3.53 | 2.73 | 0.45 | 3.18 |
|
|
||||||
| Taxes, duties and cess | 2.78 | 0.37 | 3.15 | 2.53 | 0.34 | 2.87 |
| Royalties, dividends | 0.26 | 0.12 | 0.38 | 0.20 | 0.11 | 0.31 |
|
|
||||||
| State government revenue | 1.20 | 0.11 | 1.31 | 1.09 | 0.11 | 1.19 |
|
|
||||||
| Taxes, duties and cess | 1.13 | 0.02 | 1.15 | 1.03 | 0.02 | 1.05 |
| Royalties, dividends | 0.07 | 0.09 | 0.16 | 0.06 | 0.08 | 0.14 |
|
|
||||||
| Central government revenue | 2.78 | 0.37 | 3.15 | 2.53 | 0.34 | 2.87 |
|
|
||||||
| Taxes, duties and cess | 1.65 | 0.35 | 1.99 | 1.50 | 0.32 | 1.82 |
| Royalties, dividends | 0.19 | 0.03 | 0.22 | 0.14 | 0.03 | 0.17 |
-
Source: PPAC and Author’s calculation.
Price change for fossil fuel (share of GDP).
| 4 percent inflation | Total | State | Center |
|---|---|---|---|
| 2019 | 3.2 | 1.2 | 2.0 |
| 2030 | 2.9 | 1.1 | 1.8 |
| 2040 | 1.6 | 0.6 | 1.0 |
|
|
|||
| 4 percent deflation | |||
|
|
|||
| 2019 | 3.2 | 1.2 | 2.0 |
| 2030 | 1.1 | 0.4 | 0.7 |
| 2040 | 0.6 | 0.2 | 0.4 |
Price change for fossil fuel (share of revenue).
| 4 percent inflation | Total | State | Center |
|---|---|---|---|
| 2019 | 13.2 | 8.3 | 20.8 |
| 2030 | 12.1 | 8.2 | 17.2 |
| 2040 | 6.3 | 5.2 | 9.1 |
|
|
|||
| 4 percent deflation | |||
|
|
|||
| 2019 | 13.2 | 8.3 | 20.8 |
| 2030 | 4.6 | 3.1 | 6.6 |
| 2040 | 2.4 | 2.0 | 3.5 |
References
Agarwal, A., N. Perrin, A. Chhatre, C. S. Benson, and M. Kononen. 2012. “Climate Policy Processes, Local Institutions, and Adaptation Actions: Mechanisms of Translation and Influence.” Wiley Interdisciplinary Reviews: Climate Change 3 (6): 565–79. https://doi.org/10.1002/wcc.193.Search in Google Scholar
Băhnăreanu, C. 2019. “World Economic Forum 2019: Globalization 4.0 – A Better Version.” Strategic Impact 1-2: 79–82.Search in Google Scholar
Berwick, M. D., and D. C. Malchose. 2012. Forecasting North Dakota Fuel Tax Revenue and License and Registration Fee Revenue.Search in Google Scholar
Bradley, S., G. Lahn, and S. Pye. 2018. Carbon Risk and Resilience. How the Energy Transition Is Changing the Prospects for Developing Countries with Fossil Fuels. London: Chatham House.Search in Google Scholar
CIL. 2019. Annual Report and Accounts, 2018–19. New Delhi.Search in Google Scholar
CIL. 2020. Annual Report and Accounts, 2019–20. New Delhi.Search in Google Scholar
CIL. 2021. Annual Report and Accounts, 2019–20. New Delhi.Search in Google Scholar
Economic Survey Vol. 1. 2015-16. GoI. Export-Import data from Department of Commerce. https://tradestat.commerce.gov.in/eidb/default.asp.Search in Google Scholar
Gerasimchuk, I., K. Kühne, J. Roth, A. Geddes, Y. Oharenko, R. Bridle, and V. Garg. 2019. Beyond Fossil Fuels: Fiscal transition in BRICS. Mimeo: International Institute of Sustainable Development.Search in Google Scholar
IEA. 2021a. India Energy Outlook 2021. International Energy Agency (IEA).Search in Google Scholar
IEA. 2021b. World Energy Outlook 2021. International Energy Agency (IEA).Search in Google Scholar
IISD. 2021. Mapping India’s Energy Subsides 2021: Time for Renewed Support to Clean Energy.Search in Google Scholar
IPCC. 2018. Global Warming of 1.5°C. An IPCC Special Report on the Impacts of Global Warm- ing of 1.5°C above Pre-industrial Levels and Related Global Greenhouse Gas Emission Pathways, in the Context of Strengthening the Global Response to the Threat of Climate Change, Sustainable Development, and Efforts to Eradicate Poverty. In Press.Search in Google Scholar
ITF. 2019. ITF Transport Outlook 2019.Search in Google Scholar
Jenkins, J. 2019. Why Carbon Pricing Falls Short. Philadelphia: Kleinman Center for Energy Policy.Search in Google Scholar
Lazarus, M., and H. van Asselt. 2018. “Fossil Fuel Supply and Climate Policy: Exploring the Road Less Taken.” Climatic Change 150: 1–13. https://doi.org/10.1007/s10584-018-2266-3.Search in Google Scholar
Manley, D., J. Cust, and G. Ceccinato. 2016. Stranded Nations? The Climate Policy Implications for Fossil-Fuel Developing Countries. OxCarre Policy Paper 34. Oxford: Oxford Centre for the Analysis of Resource Rich Economies.10.2139/ssrn.3264765Search in Google Scholar
Metcalf, G. E. 2021. “Carbon Taxes in Theory and Practice.” Annual Review of Resource Economics 13: 245–65, https://doi.org/10.1146/annurev-resource-102519-113630.Search in Google Scholar
Ministry of Finance. 2020. Statement I – Consolidated Fund of India – Revenue Account – Receipts. New Delhi.Search in Google Scholar
Ministry of Finance. 2021. Statement I – Consolidated Fund of India – Revenue Account – Receipts. New Delhi.Search in Google Scholar
MoSPI. 2020. Energy Statistics 2020. New Delhi. Ministry of Statistics and Programme Implementation, Government of India. https://www.mospi.gov.in/sites/default/files/publication_reports/ES_2020_240420m.pdf (accessed September 21, 2020).Search in Google Scholar
Mukherjee, S. 2020. “Estimation and Projection of Petroleum Demand and Tax Collection from Petroleum Sector in India.” Journal of Infrastructure Development 12 (1): 39–68. https://doi.org/10.1177/0974930620903558.Search in Google Scholar
OECD. 2019. Taxing Energy Use; Country Notes. Paris: OECD Publishing.Search in Google Scholar
Oskarsson, P., K. B. Nielsen, K. Lahiri-Dutt, and B. Roy. 2021. “India’s New Coal Geography: Coastal Transformations, Imported Fuel and State-Business Collaboration in the Transition to More Fossil Fuel Energy.” Energy Research & Social Science 73: 101903. https://doi.org/10.1016/j.erss.2020.101903.Search in Google Scholar
Piggot, Georgia, Cleo Verkuijl, Harro van Asselt, and Michael Lazarus. 2020. “Curbing Fossil Fuel Supply to Achieve Climate Goals.” Climate Policy 20 (8): 881–7. https://doi.org/10.1080/14693062.2020.1804315.Search in Google Scholar
Parikh, J., P. Purohit, and P. Maitra. 2007. “Demand Projections of Petroleum Products and Natural Gas in India.” Energy 32 (10): 1825–37. https://doi.org/10.1016/j.energy.2007.02.008.Search in Google Scholar
Parry, Ian W. H., Victor Mylonas, and Nate Vernon. 2017. “Reforming Energy Policy in India : Assessing the Options.” International Monetary Fund, IMF Working Paper, WP/17/103.10.5089/9781475595734.001Search in Google Scholar
Petroleum Planning & Analysis Cell. 2021. Contribution to Central and State Exchequer. New Delhi: GoI.Search in Google Scholar
Prayas Energy Group. 2021, February. Working Paper on ‘Energy: Taxes and Transition’.Search in Google Scholar
Reserve Bank of India. 2019. State Finances: A Study of Budgets, Appendix I.Search in Google Scholar
Reserve Bank of India. 2020. State Finances: A Study of Budgets, Appendix I.Search in Google Scholar
SCCL. 2019. 98th Annual Report & Accounts, 2018–19.Search in Google Scholar
SCCL. 2020. Balance Sheet as at 31st March 2020.Search in Google Scholar
Stephens, T. K. 2019. “Framework for Petroleum Revenue Management in Ghana: Current Problems and Challenges.” Journal of Energy & Natural Resources Law 37 (1): 119–43. https://doi.org/10.1080/02646811.2018.1485269.Search in Google Scholar
Sunley, E. M., T. Baunsgaard, and D. Simard. 2002. “Revenue from the Oil and Gas Sector: Issues and Country Experience.” IMF Conference Paper.Search in Google Scholar
TERI & Shell. 2021. India: Transforming to a Net-zero Emissions Energy System. New Delhi: The Energy & Resources Institute (TERI) and Shell (India).Search in Google Scholar
Supplementary Material
This article contains supplementary material (https://doi.org/10.1515/jgd-2023-0101).
© 2024 Walter de Gruyter GmbH, Berlin/Boston
Articles in the same Issue
- Frontmatter
- Policy Analysis
- An Analysis of the IMF’s International Carbon Price Floor
- India’s Energy and Fiscal Transition
- Macroeconomic and Fiscal Consequences of Climate Change in Latin America and the Caribbean
- Symposia_Articles
- Sovereign Debt and Climate Change in Argentina – The Catalytic Role of the IMF
- Climate Change Risks and Consequences on Growth and Debt-Sustainability in Africa
- Policy Analysis
- Gaps and Fiscal Adjustment for Debt Stability in Climate-Vulnerable Developing Countries: How Large and by How Much?