An Analysis of the IMF’s International Carbon Price Floor
-
 ,
,

Abstract
The International Monetary Fund (IMF) has proposed an International Carbon Price Floor (ICPF) arrangement among six major emitting economies (the US, EU, UK, Canada, China, and India) to scale up global climate mitigation action. Our quantitative analysis of the IMF’s ICPFs indicates that, compared to the committed policies of National Determined Contributions (NDCs), differentiated price floors are non-binding for developed countries – and therefore have a limited impact on their climate actions. However, for developing countries (e.g. China and India), the ICPFs effectively translate into substantial increases in carbon prices. Essentially, the ICPFs place additional responsibilities of emission reductions and economic costs fully on China and India. Given this gap between the participation incentives of developed and developing economies, we believe that the ICPF arrangement, in its current form, is unlikely to be adopted by major economies. To address this, we recommend that the IMF devote efforts to: (1) estimating the price equivalents of non-price policy instruments, as well as re-calibrating the desirable floors for broadly defined carbon prices; and (2) considering options to redistribute the economic benefits between developed and developing countries by increasing the availability of climate mitigation funds and low-carbon technologies to developing countries.
1 Introduction
Addressing climate change is a collective responsibility. However, the updated National Determined Contributions (NDCs), even if fully implemented, fall short of meeting the Paris Agreement targets. Failing to achieve these targets would have dire consequences, including severe climate impacts and loss of biodiversity, posing a significant threat to global stability. Although international coordinated policies are needed to scale up global efforts in fighting climate change, it will prove challenging to ratchet up ambition among all nations simultaneously, because each country has unique circumstances, including historical emissions, economic development, and energy sources. Coordinating ambitious climate policies requires balancing these differences.
Carbon pricing, which is imposing a price on carbon emissions to mitigate the negative externalities created by emissions, is widely regarded as the most efficient climate policy tool. However, ongoing debate centers on how to establish an internationally coordinated carbon pricing scheme while ensuring a just transition worldwide. Various approaches to international coordination on carbon pricing have been explored in academic literature and policy circles. These include a uniform global carbon tax and differentiated carbon prices across different regions. One notable proposal from the International Monetary Fund (IMF) is an international carbon price floor (ICPF) arrangement with differentiated price floors (IMF 2019a, 2019b; Black et al. 2021; Parry, Simon and James 2021). There are two key features of the IMF’s ICPF proposal: first, that it be arranged among a small number of large emitting countries, and second, that it have differentiated price floors for countries with different income levels. Specifically, Parry, Simon, and James (2021) propose an ICPF to be negotiated among six large emitters (the US, EU, UK, Canada, China, and India) or G20 countries. They also propose the price floors of USD 75/mtCO2eq, USD 50/mtCO2eq, and USD 25/mtCO2eq for high-income countries (HICs), middle-income countries (MICs), and low-income countries (LICs), respectively.
Multiple research papers from the IMF (e.g. 2019a 2019b), Black et al. (2021), and Chateau et al. (2022) have assessed the emission impacts, economic impacts, and distributional impacts of the ICPF. They found that differentiated carbon price floors, which allow a lower carbon price for MICs and LICs, substantially reduce global emissions at a low economic cost, while improving the burden sharing of mitigation relative to that of a uniform carbon price.
Although standard economic theory posits that a uniform global carbon price is the most efficient mitigation policy at the global level, it has never been considered a realistic option in practice because of economic, social, and political barriers. Therefore, using a uniform global carbon price as the sole benchmark for analyzing the burden sharing of global climate polices can be misleading and may thus discourage participation. To address this risk, it is necessary to obtain a nuanced understanding of the distributional impacts across countries.
Our study contributes to the the literature by conducting an analysis of the burden sharing effects of the ICPF arrangement with differentiated price floors proposed by the IMF. We use a global recursive dynamic computable general equilibrium (CGE) model to examine the interaction between the ICPF arrangement and the other international climate policy regimes, including NDCs and the Carbon Border Adjustment Mechanism (CBAM), to shed light on the design of ICPFs. CGE models provide a comprehensive means of capturing the interactions among different sectors and the complex linkages in an economic system. Given their highly structural nature and flexibility in policy setting, CGE methods have been widely used in policy analysis of trade, public finance, and environmental issues. Because the implementation of ICPF arrangement is a long-term process spanning years, we employ a recursive dynamic version of the model that better captures the future changes in economic growth and structural shifts. The model is based on agents’ static decision-making but is solved sequentially, year after year. Dynamics in the model originate from the accumulation of productive factors as well as productivity changes.
Our analysis shows that the major developing countries, such as China and India, assume a large additional share of the burden of abatement under the ICPF arrangement, in comparison to their current domestic policies as well as their NDC pledges. For major developed economies, however, the floor prices are far lower than the carbon prices implied by their NDC pledges, indicating that the ICPFs are not likely to affect the climate actions of major developed economies. These results also explain the findings of the World Economic Forum (2021) and Parry, Simon, and James (2021) that an ICPF arrangement alone does not reduce global emissions sufficiently, and that it works only when countries fulfill their NDCs.
Our simulation results also suggest that the IMF’s proposed ICPF arrangement creates a gap between developed and developing economies in their incentives to participate in such an arrangement. Because the participation of large developing countries is essential for the ICPF mechanism to work effectively, price floor design must be improved to incentivize participation by MICs and LICs.
2 Literature Review
The standard economic theory suggests that a uniform carbon price worldwide is optimal. Weitzman (2014) used a simple model to show that a single internationally binding minimum carbon price, with the proceeds being retained domestically, effectively addresses self-interest by incentivizing agents to internalize the externality. Gollier and Tirole (2015) also advocated a uniform carbon price across all countries, pointing out that all CO2 emissions have the same climate impacts. Similarly, Cooper (2004) supports a uniform tax because a universal carbon price prevents industries from relocating geographically to evade carbon taxation (a phenomenon known as “carbon leakage”). Chang and Toh (2022) argued that adopting a global uniform carbon tax would eliminate any unfairness arising from preferential carbon pricing regimes and render carbon border adjustments unnecessary.
However, a uniform global carbon price has never been considered a feasible option in the real world. There are significant disparities in development stages across the global economy, and “climate debt” owed by developed countries to developing countries greatly complicates the implementation of a uniform carbon price (e.g. Boroumand et al. 2022). Autume et al. (2016) argued that a uniform carbon price is viable only when lump-sum international transfers are available between countries. Bataille et al. (2018) shared a similar perspective, asserting that a uniform carbon price is valid only if unlimited transfers among countries are possible to compensate for differences in abatement costs and welfare effects. If international transfers are not possible, differentiated carbon prices become necessary to address equity concerns.
Verbruggen and Brauers (2020) recognized the diverse nature of the real world and emphasized the importance of considering diversity in actual policy-making. They argued that ironing out carbon price differences across countries to enforce the global uniform carbon price is not only futile but also counterproductive. Boroumand et al. (2022) argued that differentiated carbon prices have the potential to simplify negotiations and make it easier to reach an agreement among nations.
Various forms of differentiated carbon price floors have been discussed in the literature. For instance, Ernst and Young (2023) compared a scenario of universal carbon price and a scenario of differentiated price floors for large emitters. The universal carbon price scenario assumes that the global carbon price gradually increases from current levels to USD 190 per ton of carbon by 2050. The differentiated carbon price scenario assumes that carbon prices in the EU, the UK, the US and Australia start at USD 70 and gradually increase to USD 190, whereas carbon prices in China start at USD 8 and gradually rise to USD 30. Their simulation results showed that by 2050, the universal price scenario would rise by USD 42 trillion and reduce global emissions in the power sector by 68 %. In contrast, the large emitters floor scenario would rise by USD 15 trillion and yield a 17 % reduction in power sector emissions. The study concluded that higher international carbon price floors, along with a wider geographical application of carbon pricing, are necessary to accelerate the green transition.
Parry, Simon and James (2021) studied the emission impacts of the IMF’s proposed ICPFs using a reduced form model of the IMF’s Carbon Pricing Assessment Tool. They found that ICPFs among six major emitting countries – either a pure USD 50 price floor for all six countries or a differentiated price floor of USD 25, USD 50, and USD 75 – would be sufficient to cut emissions to enter the range for 2° if countries also meet their NDC commitments. Extending the ICPF to other G20 countries would lead to a modest additional reduction in global emissions.
To complement the work of Parry, Simon and James (2021), a few recent studies provide quantitative analysis of the macroeconomic impacts of the IMF’s proposed ICPFs. The World Economic Forum (2021) uses two separate frameworks to study the macroeconomic and sectoral impacts of ICPF arrangements that are applied, respectively, both worldwide and exclusively among HICs. Their results suggest that the contraction of global GDP ranges from 0.1 % (if only HICs and high-emitting industries are included) to 0.6 % (if all countries and all sectors are included); both figures are relatively small. They also find that the ICPF Scenarios do not reduce emissions enough to contain global warming, but if NDCs are fulfilled, emissions are reduced by 22 % by 2030, which enters the upper limit of the 2 °C range.
Chateau et al. (2022) studied the emission impacts of the ICPF with differentiated price floors. Their results suggest that an ICPF is an effective and efficient approach to scale up global mitigation action at a relatively small economic cost. More importantly, they argued that an ICPF with differentiated carbon prices improves the fairness of burden sharing across the globe by shifting part of the emission reductions and the economic cost of mitigation from LICs to HICs, when compared to a uniform global carbon price. They also found that carbon border taxes, if implemented by all HICs, do not deliver a strong reduction in global emissions, nor do they provide sufficient incentives for developing countries to join the carbon price floor.
This paper is structured as follows: Session 3 presents the model, Session 4 presents the simulation results, and Session 5 concludes and discusses policy implications.
3 Model
Our model builds on the recursive dynamic CGE models of He et al. (2022); Van der Mensbrugghe (2019) and Zhai (2018). The model is calibrated to GTAP database 10.0 (Aguiar et al. 2019).
3.1 Production and Trade
Production technology is modeled using nested constant elasticity of substitution (CES) functions. A typical output is produced as a combination of intermediate demand and value-added bundle. The intermediate demand is split into each commodity, according to Leontief technology. The value-added bundle is produced by unskilled labor, skilled labor, capital, land, and energy.
Each level of production has a unit cost function that is dual to the CES aggregator function and demand functions for corresponding inputs. The top-level unit-cost function defines the marginal cost of sectoral output.
Given the importance of international trade in propagating the spillover effects of climate policies from one country to another, we use a fully fledged model that can capture any meaningful changes in international trade. To this end, we deviate from the Armington specification that is commonly used in CGE models, which has the effect of locking in pre-existing trade patterns and preventing the models from generating large changes in trade in sectors where little or no trade occurs. Specifically, under this specification, if a country’s imports of a product from another country are initially zero, they will always be zero, even after significant reductions in trade barriers. This “stuck on zero trade” problem makes traditional CGE models especially inappropriate for the small countries that usually have limited trade with the rest of the world.
To address this problem, we follow Zhai (2008, 2018 and Melitz (2003) to introduce the extensive margin to the trade sector. Specifically, producers are characterized by monopolistic competition. Each sector consists of a continuum of producers that are differentiated by the varieties of their productivities. Producers in these sectors have fixed production costs and increasing returns to scale. Export activities involve both fixed and variable costs. On the demand side, agents have Dixit–Stiglitz preference over the continuum of varieties. Each producer is a monopolist for the variety it produces, and it sets the price of its product at a constant mark-up over marginal cost. A producer enters domestic or export markets if and only if the net profit from such sales is sufficient to cover fixed cost. This zero cut-off profit condition determines the equilibrium distribution of non-exporting producers and exporting producers, as well as their average productivities. The combination of a fixed export cost and a variable cost ensures that the exporting productivity threshold is higher than that of production for the domestic market; therefore, only a fraction of producers with high productivity export. The number of producers in the monopolistic sectors is assumed to be fixed.
3.2 Income, Demand and Factor Markets
Incomes from production accrue to a single representative household in each region. A household maximizes utility using the Extended Linear Expenditure System (ELES), with the saving decision integrated in the utility function. A composite good for final demand is defined by the Dixit–Stiglitz aggregator over domestic and imported varieties. In each period, aggregate capital stock is predetermined by the investment and saving decisions made previously. The supply of land and sector-specific factors is assumed to be elastic, with response to the changes in their respective prices. The supply of labor is fixed in each period, and its market is cleared through wage adjustments. Investment demand and government consumption are specified as a Leontief function.
Four primary production factors are incorporated in the production function: capital, labor, land, and natural resources (e.g. oil). Within each sector, a sector-specific factor is introduced into the production function to reflect the resource constraints. Capital and labor are fully mobile across sectors within a region. In each period, aggregate capital stock is predetermined by the investment and savings decision of previous periods. The supply of land and sector-specific factors is assumed to be elastic, with response to the changes in their respective prices. The supply of labor is fixed in each period, and its market is cleared through wage adjustment.
3.3 Emission Module and Carbon Prices
We follow Van der Mensbrugghe (2019) in setting up the carbon emission module. The module incorporates a number of greenhouse gas (GHG) emissions and non-GHG emissions. Emissions are generated by three sources: (1) direct consumption of a commodity, (2) factor-based emission, and (3) output- or process-based emissions. Governments collect emission taxes, which are treated as a Pigouvian tax. Emission tax revenues go to the regional governments.
Emission tax rates (i.e. carbon prices) can be determined exogenously or endogenously given emission caps (e.g. NDCs). We use the carbon price data of each country from the World Bank Carbon Pricing Dashboard to characterize each country’s actual current climate policy, as well as the CBAM policy. We also set carbon prices exogenously when introducing the ICPF. Under the NDC Scenario detailed below, the NDCs are phased in gradually between 2022 and 2030, and the carbon prices implicit in countries’ NDC pledges are derived endogenously given the emission caps. The carbon border tax rate of a particular product is calculated based on the differences between the carbon prices paid in the CBAM-acting countries and the carbon prices paid in the country of origin.
3.4 Macro Closure and Model Dynamics
Governments collect taxes on production factors as well as on emissions. Governments run balanced budgets in all periods. Government consumption and savings are exogenous. Any changes in the government budgets are automatically balanced by changes in the transfers to households. Domestic investment is the endogenous sum of household savings, government savings, and foreign savings.
The model is recursive dynamic. Dynamics of the model are driven by exogenous population and labor growth, labor-augmented technological progress, and capital accumulation. Population and labor force projections are based on the United Nations forecast. Technological progress is assumed to be labor-augmented, so the model can reach a steady state in the long run.
4 Scenarios and Simulations
4.1 Scenarios
We conduct the analysis under multiple policy scenarios with sub-scenarios that vary in scope. The business-as-usual (BAU) is a projection of economic development to 2030 under the assumption that all the countries limit their climate mitigation policies to the actual current climate policies, characterized by their current carbon prices.
The first policy scenario is the NDC Scenario, in which all countries meet their NDC pledges through the implementation of carbon pricing. Therefore, a corresponding path of carbon prices is derived endogenously for each country under this scenario. The NDC regime is considered the most relevant benchmark to be compared with the ICPF.
The second policy scenario is the ICPF Scenario with differentiated price floors depending on the level of development of the country. Our core scenario is an ICPF arrangement following the original proposal by Parry, Simon and James (2021); that is, the arrangement is among six large emitters (i.e. the US, EU, UK, Canada, China, and India), with differentiated price floors of USD 75/mtCO2eq, USD 50/mtCO2eq and USD 25/mtCO2eq for HICs, MICs and LICs, respectively. In this case, the US, EU, UK, and Canada use the price floor of USD 75, China USD 50, and India USD 25. We label the other countries as “non-acting” countries as they do not participate in the ICPF arrangement. We also consider a variation of the ICPF that extends the participants to all the countries.
As noted earlier, an ICPF targets a price floor rather than the price level and allows countries with ambitious NDCs to implement carbon prices exceeding the floor price. To disentangle the effects of NDCs and the designated price floors, we consider two sub-scenarios: an ICPF introduced to the BAU scenario, labeled “BAU + ICPF Scenario,” in which non-acting countries limit their climate mitigation policies to the actual current climate policy; and an ICPF introduced to the NDC Scenario, labeled “NDC + ICPF,” in which each country implements a carbon price that is the maximum of their carbon price floor and the implicit carbon price required to reach their NDC.
The third policy scenario Is an alternative policy regime where no international coordinated policies are in place and major developed economies adopt carbon border taxes, similar to the EU’s carbon border adjustment mechanism (CBAM), to protect domestic industries and reduce carbon leakage. It is a real-world-relevant scenario since the EU has proposed to implement CBAM starting from 2027, initially on selected products and later to be extended to all products covered by the EU ETS. The US, Canada, and the UK are actively discussing similar measures; these measures are likely to have significant adverse impacts on developing countries that rely on carbon-intensive exports, and may affect the countries’ decisions to participate (or not) in an ICPF arrangement. Therefore, we consider a “CBAM Scenario” under which the EU, US, UK, and Canada implement carbon border taxes on carbon-intensive and trade-exposed products[1] that are currently covered by the EU CBAM.
4.2 Global Impact of ICPFs
The global emission and economic impacts of an ICPF arrangement with six participants are shown in Figure 1, with all variables being the percentage deviations from the BAU in 2030.
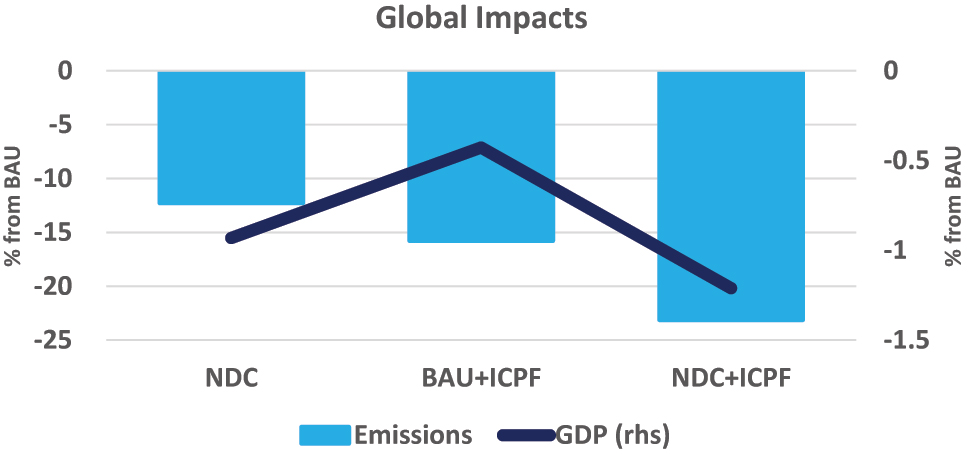
Global impacts of policy regimes.
Under the BAU + ICPF Scenario, in which the non-acting countries continue with their actual current climate policies, global emissions are reduced by 15 % in 2030 compared to the BAU, while the economic cost is 0.4 % of global GDP.
Under the NDC Scenario, global emissions are reduced by 12 % in 2030 compared to the BAU, while the economic cost is 1 % of global GDP. When an ICPF is introduced (under the NDC + ICPF Scenario), the emission reduction is 23 % in 2030 vs BAU, while the economic cost is 1.2 % of global GDP. In comparison to the NDC Scenario without an ICPF, an ICPF arrangement enhances global action at a relatively small economic cost. These results suggest that an ICPF arrangement – even among only six large emitters – is an efficient and effective approach to scale up global action on climate mitigation.
Figure 2 shows the economic and emission impacts, respectively, of the ICPF arrangements among a small number of large emitters among all nations. If the ICPF arrangement is extended to all nations, there is a further 8 % reduction in global emissions in 2030, at a further increase of 0.2 % in global GDP cost. Although a broad implementation of ICPFs may appear an efficient approach, reaching an agreement among 200 nations can be much more costly, and the distributional impacts should be closely examined.
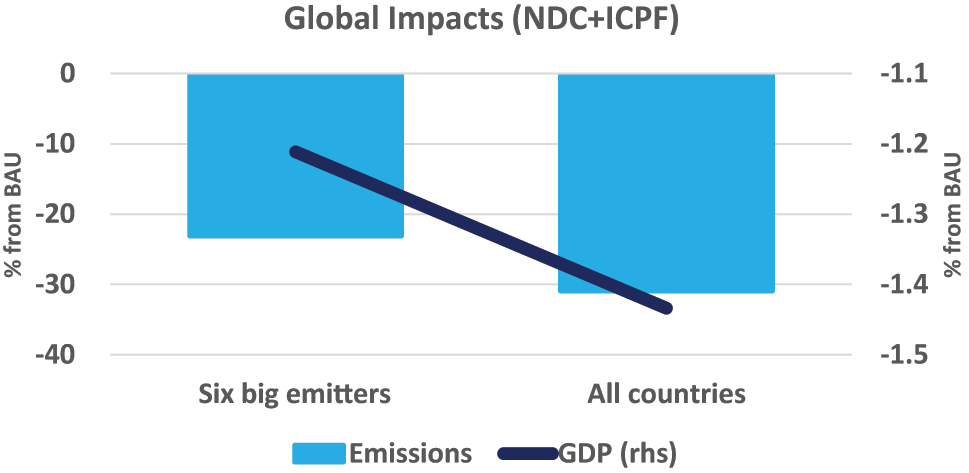
Global impacts of ICPFs with different numbers of participants.
4.3 Burden Sharing of ICPFs
Although an ICPF arrangement is shown to be effective and efficient in enhancing global climate action, it is not known whether countries have the incentives to participate in such an arrangement. This section looks closely at the distribution of responsibilities and economic costs across countries, seeking insight into whether the interests are aligned among potential participants. In this section, unless otherwise noted, an ICPF arrangement refers to ICPFs implemented by six large emitting economies.
Figures 3–5 show the contributions of emission reductions and burden sharing among major countries. Under the BAU + ICPF Scenario, China reduces emissions by 33 % in 2030 compared to its BAU trajectory, with a macroeconomic cost of 1.2 %. The emission and economic impacts on the other five big emitters are relatively less pronounced than those on China. For example, India, the US, and Canada reduce emissions in 2030 by 24 %, 22 % and 13 %, respectively, with GDP costs of 0.44 %, 0.41 % and 0.63 %, respectively. The negative economic impacts experienced by the six emitters are attributed to both depressed domestic demand and weakened exports. Specifically, the impacts on exports vary significantly among the six emitters, as depicted in Figure 6. Under the BAU + ICPF Scenario, China’s exports decline by 2.9 %, while India’s exports decline by 4.1 %. The negative impacts on the exports of the US, Canada, and the UK are relatively milder: 1.7 %, 1.2 % and 0.3 %, respectively. The EU gains competitiveness, resulting in a 0.05 % increase in exports.
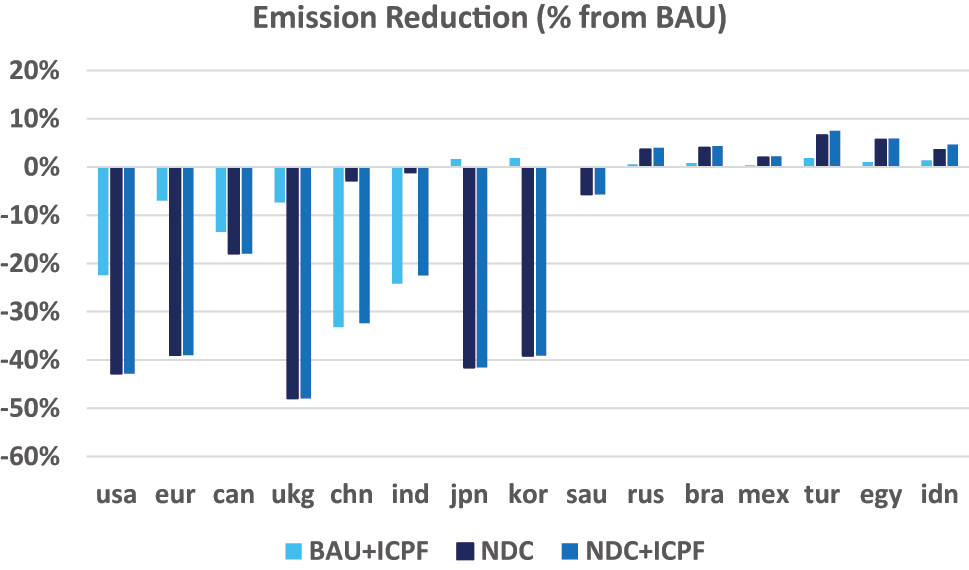
Emission impacts of ICPFs (% from BAU). Notes: Economies shown in Figure 3 are the US (USA), EU (eur), Canada (can), the UK (ukg), China (chn), India (ind), Japan (jpn), Korea (kor), Saudi Arabia (sau), Russia (rus), Brazil (bra), Mexico (mex), Turkey (tur), Egypt (egy), and Indonesia (idn).
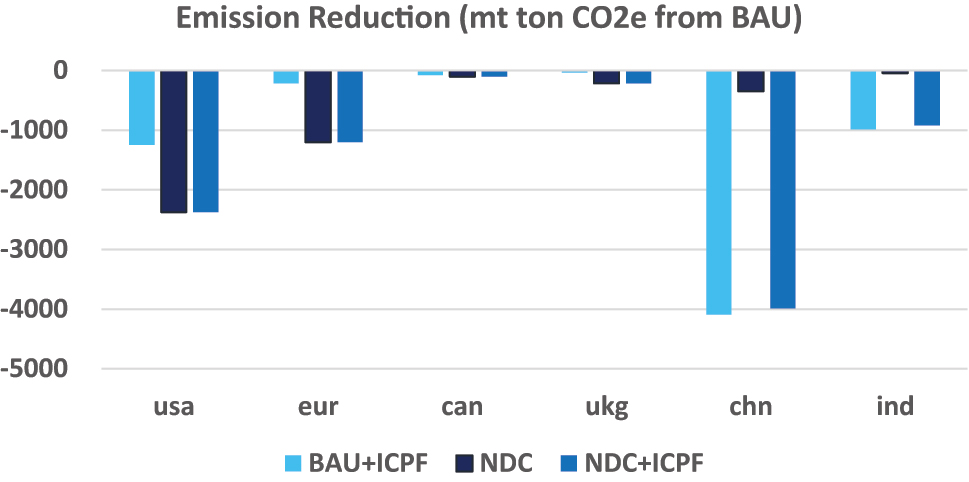
Emission impacts of ICPFs (mt ton CO2e from BAU). Notes: Economies shown in Figure 4 are the US (USA), EU (eur), Canada (can), the UK (ukg), China (chn), and India (ind).
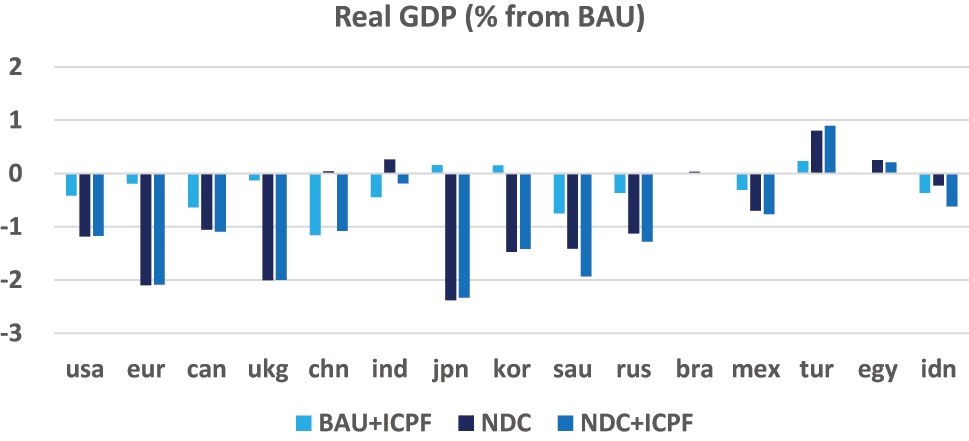
Economic impact of ICPFs. Notes: Economies shown in Figure 5 are the US (USA), EU (eur), Canada (can), the UK (ukg), China (chn), India (ind), Japan (jpn), korea (kor), Saudi Arabia (sau), Russia (rus), Brazil (bra), Mexico (mex), Turkey (tur), Egypt (egy), and Indonesia (idn).
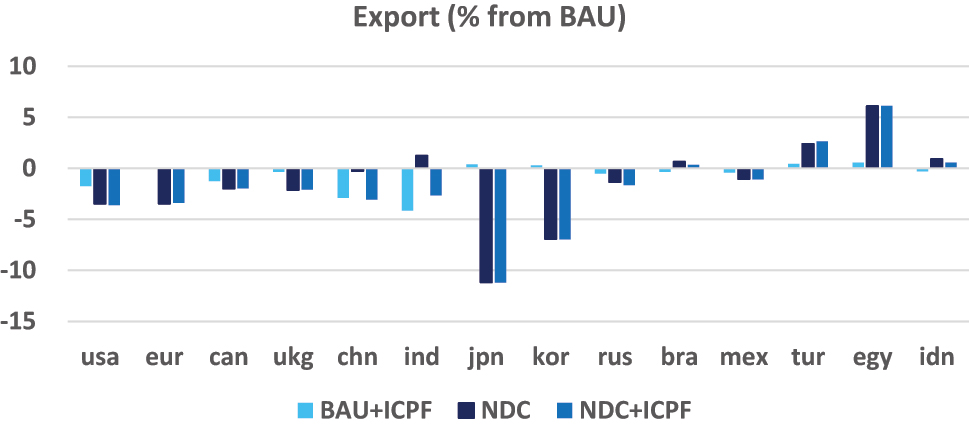
Impact of ICPFs on export. Notes: Economies shown in Figure 6 are the US (USA), EU (eur), Canada (can), the UK (ukg), China (chn), India (ind), Japan (jpn), Korea (kor), Saudi Arabia (sau), Russia (rus), Brazil (bra), Mexico (mex), Turkey (tur), Egypt (egy), and Indonesia (idn).
The economic impacts on non-acting countries exhibit significant variation, driven primarily by two factors: (1) the contraction in demand from the six emitters, and (2) adjustments in terms of trade resulting from changes in production costs. The contraction in global demand has a negative impact on non-acting countries, whereas adjustments in terms of trade can lead to more favorable conditions for them. Notably, Japan and Korea have GDP gains under the BAU + ICPF Scenario, whereas Saudi Arabia, Russia, and Indonesia experience significant GDP losses.
The NDC Scenario serves as a benchmark to forecast the future policy trajectory of each country. By utilizing the latest NDC pledges as the emission levels for each country in 2030, our simulation results suggest that achieving their respective NDCs solely through carbon pricing schemes would require carbon prices of USD 417, USD 244, USD 611, and USD 112, respectively, for the EU, the US, the UK, and Canada in 2030 – notably much higher than the USD 75 price floor in the ICPF arrangement (shown in Table 1).
Current carbon prices under BAU scenario and implicit carbon prices under NDC Scenario.
| BAU (USD) | NDC (USD) | |
|---|---|---|
| USA | 22 | 244 |
| Eur | 75 | 418 |
| Can | 40 | 112 |
| Ukg | 45 | 611 |
| Chn | 9 | 13 |
| Ind | 0 | 4 |
| Jpn | 3 | 338 |
| Kor | 19 | 240 |
| Rus | 0 | 13 |
| Bra | 0 | 0 |
| Mex | 0 | 0 |
| Tur | 4 | 4 |
| Egy | 0 | 0 |
| Idn | 0 | 0 |
| Sau | 1 | 1 |
-
Notes: Economies shown in Table 1 are the US (usa), EU (eur), Canada (can), the UK (ukg), China (chn), India (ind), Japan (jpn), Korea (kor), Saudi Arabia (sau), Russia (rus), Brazil (bra), Mexico (mex), Turkey (tur), Egypt (egy), and Indonesia (idn).
In contrast, the NDC pledges by China and India are relatively less ambitious, with implied carbon prices of USD 13 and USD 4, respectively, to achieve their NDC targets by 2030. Therefore, under this scenario, China and India hold a slight advantage due to lower production costs. India’s GDP experiences a 0.25 % compared to the BAU, while China’s GDP sees 0.04 % increases compared to BAU.
Under the NDC + ICPF Scenario, the ICPF arrangement is adopted among the six large emitters, assuming they and all the other countries fulfill their NDC pledges. The ICPFs have varying impacts on different economies. China and India are much worse off than under the NDC Scenario, with their respective GDPs declining by 1.1 % and 0.2 %. However, the economic impacts on the EU, US, UK, and Canada remain similar to those under the NDC Scenario. This is because the USD 75 price floor falls significantly below the implicit carbon prices required by the NDCs for these four regions, and therefore the price floor is non-binding for them. While the price floors are differentiated for economies based on income levels, the calibration of the floor levels are such that they do not affect the behavior of the four developed economies. These results suggest that if all countries adopt carbon pricing to meet their NDC pledges, the introduction of the six emitters’ ICPF arrangement has real effects only on China and India, and that the economic costs are fully absorbed by China and India alone.
This creates an incentive gap between the developing economies (China and India) and developed economies (the EU, US, UK, and Canada) within the six large emitters, which discourages the adoption of ICPFs among developing countries. However, from the perspective of emission reduction, China and India jointly contribute 80 % of global reductions under the BAU + ICPF Scenario, and 50 % under the NDC + ICPF Scenario. Therefore, the effective implementation of ICPFs requires the participation of China and India.
4.4 Unilateral Climate Actions
According to the analysis above, to ensure the effectiveness and efficiency of an ICPF mechanism, the arrangement must include China and India, which expect high GDP costs when implementing their respective price floors. If no international policy coordination is agreed upon among large emitters, regions with stringent climate policies may move ahead with unilateral carbon border taxes, both to restore the competitiveness of domestic industries and to reduce carbon leakages.
Based on recent developments, we assume a scenario under which the US, UK, Japan and Canada follow the EU in adopting carbon border adjustment taxes from 2026 on. We consider two sub-scenarios: The first is that all the other countries continue with the actual current polices (“BAU + CBAM Scenario”); the second is that all the countries fulfill their NDC pledges (“NDC + CBAM Scenario”). Accordingly, we have compared the GDP impacts of the CBAM Scenarios to the ICPF Scenarios.
Our simulation results suggest that the four countries’ carbon border adjustment measures have negative effects on the rest of the world. Under the BAU + CBAM Scenario, India experiences a GDP loss of 0.25 % (Figures 7 and 8), higher than that of China (0.14 %), because the carbon intensities of India’s exports are higher than China’s, and the exports of those products account for a larger share of India’s economy compared to China’s. In this case, a broad implementation of CBAM may provide some incentives for India to participate in the ICPF because the economic cost resulting from CBAM is close to that from the ICPF.
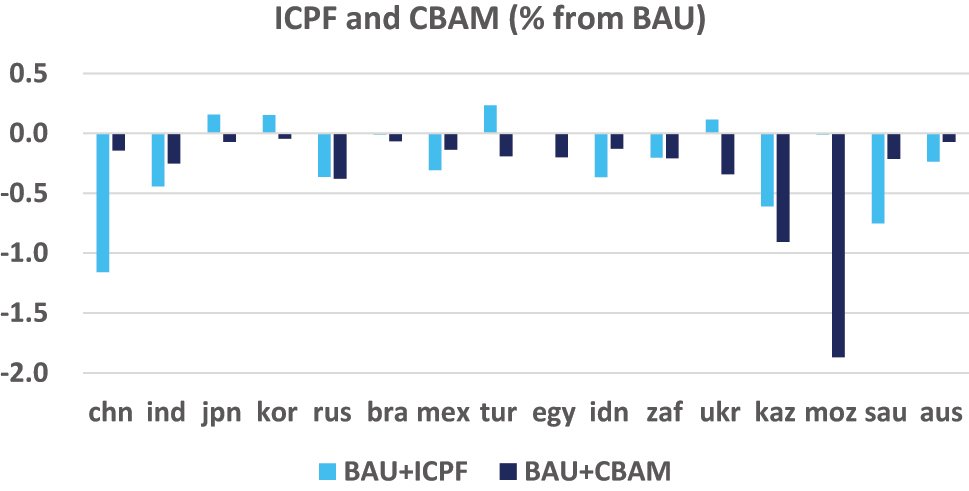
Economic impacts of ICPF and CBAM (actual current polices). Notes: Economies shown in Figure 7 are China (chn), India (ind), korea (kor), Russia (rus), Brazil (bra), Mexico (mex), Turkey (tur), Egypt (egy), Indonesia (idn), South Africa (zaf), Ukraine (ukr), Kazakhstan (kaz), Mozambique (moz), Saudi Arabia (sau), and Australia (aus).
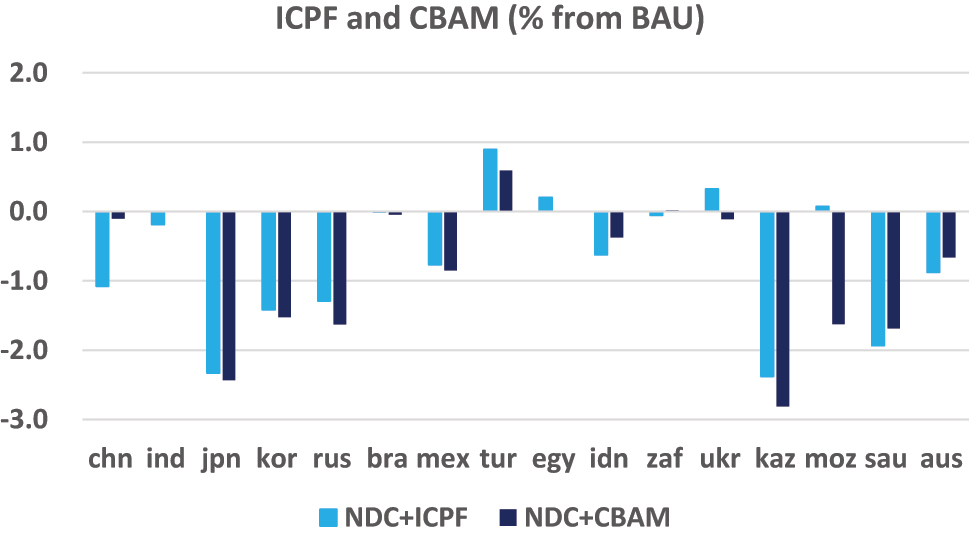
Economic impacts of ICPF and CBAM (NDCs). Notes: Economies shown in Figure 8 are China (chn), India (ind), korea (kor), Russia (rus), Brazil (bra), Mexico (mex), Turkey (tur), Egypt (egy), Indonesia (idn), South Africa (zaf), Ukraine (ukr), Kazakhstan (kaz), Mozambique (moz), Saudi Arabia (sau), and Australia (aus).
Under the NDC + CBAM Scenario, the economic impacts on China and India are both mild when compared to the impacts on many other countries. This is mostly because China and India’s exports gain competitiveness in the global markets when all countries meet their climate commitments, offsetting the negative impacts of the declines in carbon-intensive exports. Therefore, in this case, the CBAM provides few incentives for either China or India to participate in the ICPF.
5 Conclusions and Policy Implications
An international coordinated carbon pricing scheme can play a pivotal role in scaling up global actions on climate change. However, the issue of burden sharing remains at the heart of the debate. The IMF proposes an ICPF arrangement with differentiated price floors for the six large emitting economies as a “fair” approach to accelerate global low-carbon transition, emphasizing that the differentiated price floors improve burden sharing across countries, when compared against a uniform global carbon price.
We use a recursive dynamic global CGE model to conduct an analysis of the economic impacts of various policy regimes to complement the existing studies and inform the design of the ICPF arrangement. Our simulation results suggest that an ICPF arrangement with differentiated price floors is an effective and efficient approach to reduce carbon emissions from a global perspective, if both China and India participate in the arrangement. However, if we use the NDC pledges as the proxy for each country’s future climate policy, the ICPFs are non-binding for the four developed countries (the US, UK, EU and Canada) and therefore do not affect those countries’ climate actions. In contrast, the ICPFs imply substantial increases in carbon prices for the two developing countries (China and India). Essentially, the ICPF places additional responsibilities for emission reductions and economic costs squarely on China and India.
We also consider scenarios in which China and India do not adopt the ICPFs while the developed economies unilaterally implement carbon border taxes. Our simulation results suggest that in most cases, the negative economic impacts of carbon border taxes on China and India are limited, and therefore, the carbon border taxes do not create sufficient incentives for the two countries to join ICPFs.
We believe that any ICPF arrangement that fails to align the interests of major emitters is unlikely to be accepted in practice. To encourage participation from major developing countries, further efforts should focus on improving the design of the coordination policy. Two options, described below, can be considered to mitigate the additional costs associated with the ICPFs for developing countries.
First, price floors should be recalibrated to enhance the inclusiveness of the ICPF arrangement. The IMF’s ICPF proposal implicitly assumes that carbon pricing is the only climate policy instrument. In fact, the World Bank’s carbon price tracker (World Bank 2022) reports that carbon pricing schemes only cover about 20 percent of global emissions, and the IMF’s Article IV consultations with high emitting developing countries suggest a preference for non-pricing regulations in key sectors because they are generally more politically acceptable than carbon taxes and carbon trading system (see also Ahluwalia and Patel 2022). Using explicit carbon prices to calibrate the price floor underestimates the mitigation efforts made by developing countries. Those efforts should be considered as equivalents of price instruments and included in the broadly defined carbon prices. The price equivalents of non-price policy instruments should be estimated and the desirable floor prices should be recalibrated for broadly defined carbon prices that are inclusive of observed carbon prices and price equivalents of non-pricing instruments.
Second, climate mitigation funds should be included in the ICPF mechanism to enhance the availability of low-carbon technologies for developing countries. Developed economies that are least affected by the ICPF can set up a fund, as part of the ICPF mechanism, to help developing countries decarbonize. The fund can be used to support a credit enhancement mechanism to de-risk and mobilize private capital to invest in developing countries for climate mitigation. Developed economies can also use the fund (or other means) to provide low-carbon technologies to developing countries. The economic costs of decarbonization can be reduced if low-carbon technologies (Aguiar et al. 2019) are made widely available for adoption in developing countries.
Funding source: Boston University Global Development Policy Center
-
Research funding: This work was supported by Boston University Global Development Policy Center.
References
Ahluwalia, M. S., and U. Patel. 2022. “Climate Change Policy for Developing Countries.” In Envisioning 2060: Opportunities & Risks for Emerging Markets, edited by H. Kolhi, R. Nag, and I. Vilkelyte, 169–98. India: Penguin Random House.Suche in Google Scholar
Aguiar, A., M. Chepeliev, E. Corong, R. Mcdougall, and D. Y. Van Der Mensbrugghe. 2019. “The GTAP Data Base: Version 10.” Journal of Global Economic Analysis 4 (1): 1–27. https://doi.org/10.21642/jgea.040101af.Suche in Google Scholar
Autume, A., K. Schubert, and C. Withagen. 2016. “Should the Carbon Price Be the Same in All Countries?” Journal of Public Economic Theory 18 (5): 709–25. https://doi.org/10.1111/jpet.12162.Suche in Google Scholar
Bataille, C., C. Guivarch, S. Hallegatte, J. Rogelj, and H. Waisman. 2018. “Carbon Prices Across Countries.” Nature Climate Change 8 (8): 648–50.10.1038/s41558-018-0239-1Suche in Google Scholar
Black, S., I. Parry, J. Roaf, and K. Zhunussova. 2021. Not Yet on Track to Net Zero: The Urgent Need for Greater Ambition and Policy Action to achieve Paris temperature Goals. Staff Climate Note 2021/005 (October). Washington, DC: International Monetary Fund.10.5089/9781557754400.066Suche in Google Scholar
Boroumand, R. H., S. Goutte, T. Porcher, and T. F. Stocker. 2022. “A Fair and Progressive Carbon Price for a Sustainable Economy.” Journal of Environmental Management 303. https://doi.org/10.1016/j.jenvman.2021.113935.Suche in Google Scholar
Chang, Y. H., and C. Toh. 2022. Rein in Carbon Emissions with a Global Carbon Tax. Singapore: The Straits Times.Suche in Google Scholar
Chateau, J., J. Florence, and G. Schwerhoff. 2022. Economic and Environmental Benefits from International Cooperation on Climate Policies. IMF Departmental Paper No 2022/007. Washington, DC: IMF.10.5089/9781616358303.087Suche in Google Scholar
Cooper, R. 2004. “A Global Carbon Tax?” In Post-Kyoto Architecture: Toward an L20? September 20–21, 2004, New York City. Commissioned Briefing Notes for the CIGI/CFGS L20 Project. CIGI. Suche in Google Scholar
Ernst and Young. 2023. The Green Transition: A Trilogy of Perspectives Exploring How Governments Can Accelerate a Green and Just Transition. Ernst and Young.Suche in Google Scholar
Gollier, C., and J. Tirole. 2015. “Negotiating Effective Institutions against Climate Change.” Economics of Energy and Environmental Policy 4 (2): 5–28, https://doi.org/10.5547/2160-5890.4.2.cgol.Suche in Google Scholar
He, X., F. Zhai, and J. Ma. 2022. “Global Impact of Carbon Border Adjustment Mechanism: A Quantitative Assessment.” In Working Paper. Task Force on Climate, Development and the International Monetary Fund. Boston: Boston University Global Development Policy Center.Suche in Google Scholar
International Monetary Fund. 2019a. Fiscal Monitor: How to Mitigate Climate Change. Washington, DC. October. https://www.imf.org/en/Publications/FM/Issues/2019/09/12/fiscal-monitor-october-2019.Suche in Google Scholar
International Monetary Fund. 2019b. Fiscal Policies for Paris Climate Strategies – from Principle to Practice. Washington, DC. Policy Paper 19/010.10.5089/9781498311717.007Suche in Google Scholar
Melitz, M. 2003. “The Impact of Trade on Intra-Industry Reallocations and Aggregate Industry Productivity.” Econometrica 71 (6): 1695–725.10.1111/1468-0262.00467Suche in Google Scholar
Parry, I., B. Simon, and R. James. 2021. “Proposal for an International Carbon Price Floor Among Large Emitters.” In IMF Staff Climate Note 2021/001. Washington, DC: International Monetary Fund.Suche in Google Scholar
Van der Mensbrugghe, D. 2019. The Environmental Impact and Sustainability Applied General Equilibrium (ENVISAGE) Model. https://api.semanticscholar.org/CorpusID:265061340.Suche in Google Scholar
Verbruggen, A., and H. Brauers. 2020. “Diversity Disqualifies Global Uniform Carbon Pricing for Effective Climate Policy.” Environmental Science and Policy 112 (2020): 282–92. https://doi.org/10.1016/j.envsci.2020.04.014.Suche in Google Scholar
Weitzman, M. L. 2014. “Can Negotiating a Uniform Carbon Price Help to Internalize the Global Warming Externality?” Journal of the Association of Environmental and Resource Economists 1 (1/2): 29–49. https://doi.org/10.1086/676039.Suche in Google Scholar
World Bank. 2022. State and Trends of Carbon Pricing. Washington DC: World Bank.Suche in Google Scholar
World Economic Forum. 2021. Increasing Climate Ambition: Analysis of an International Carbon Price Floor. Insight Report.10.5089/9781513583204.066Suche in Google Scholar
Zhai, F. 2008. “Armington Meets Melitz: Introducing Firm Heterogeneity in a Global CGE Model of Trade.” Journal of Economic Integration 23 (3): 575–604, https://doi.org/10.11130/jei.2008.23.3.575.Suche in Google Scholar
Zhai, F. 2018. “China’s Belt and Road Initiative: A Preliminary Quantitative Assessment.” Journal of Asian Economics 55 (C): 84–92, https://doi.org/10.1016/j.asieco.2017.12.006.Suche in Google Scholar
© 2024 Walter de Gruyter GmbH, Berlin/Boston
Artikel in diesem Heft
- Frontmatter
- Policy Analysis
- An Analysis of the IMF’s International Carbon Price Floor
- India’s Energy and Fiscal Transition
- Macroeconomic and Fiscal Consequences of Climate Change in Latin America and the Caribbean
- Symposia_Articles
- Sovereign Debt and Climate Change in Argentina – The Catalytic Role of the IMF
- Climate Change Risks and Consequences on Growth and Debt-Sustainability in Africa
- Policy Analysis
- Gaps and Fiscal Adjustment for Debt Stability in Climate-Vulnerable Developing Countries: How Large and by How Much?