Macroeconomic and Fiscal Consequences of Climate Change in Latin America and the Caribbean
-
Daniel Titelman
 ,
Michael Hanni
,
Michael Hanni

Abstract
Climate change poses a significant challenge for Latin America and the Caribbean, exposing its vulnerabilities to hydrometeorological shifts and rising temperatures that threaten economic stability. We examine the macroeconomic consequences of climate change through the lens of six distinctive country cases. Our results suggest that compensating for the drag on economic growth caused by climate change would require public and private investments of 5.3 % of GDP to 10.9 % of GDP per year. Faced with existing fiscal constraints and restrictive financial conditions, we explore the macrofiscal implications of an investment push in line with the Nationally Determined Contributions (NDCs). Our results suggest that front-loaded public adaptation investments would improve growth over the medium term, although not fully compensating for climate losses. However, resulting public debt trajectories would become untenable in most countries. We find that a key factor for a fiscally sustainable NDC investment push is the financial costs that countries face when issuing sovereign debt. Debt sustainability could be significantly improved if countries could finance their climate investments at lower cost or concessional terms.
1 Introduction
Climate change represents a growing threat to Latin America and the Caribbean. The region is highly vulnerable to changes in hydrometeorological conditions and rising temperatures threaten to undercut long-term economic growth by reducing labor productivity, decreasing agricultural production, and contributing to a rapid depreciation of the capital stock (Alatorre and Fernández Sepúlveda 2022; IMF 2021a; Ranasinghe et al. 2021). Existing estimates in the literature suggest that the macroeconomic losses due to climate change in the region could be significant (Burke, Hsiang, and Miguel 2015; Kahn et al. 2019; Swiss Re Institute 2021; Van der Borght, Samaniego, and Galindo 2023).
Agricultural production in the region is already under significant climate-induced stress. Yields for key staple crops are in decline and are projected to fall further by midcentury (Castellanos et al. 2022; Romanello et al. 2021). Countries along the dry corridor in Central America are particularly vulnerable to these trends due to widescale subsistence farming carried out by predominantly poor rural populations (Baca et al. 2014; Bouroncle et al. 2017). Lower agricultural yields will intensify food insecurity and create greater pressure for domestic and international migration (Läderach et al. 2021; Linke et al. 2023; WMO 2022).
The increasing frequency and severity of extreme climatic events are exacting a growing toll on the region (Bloemendaal et al. 2022; Bhatia et al. 2020). The 2020 tropical cyclone season was emblematic of this trend with Hurricanes Eta and Iota causing widespread destruction. In Honduras, these storms caused damage equivalent to 8.9 % of GDP and impacted an estimated 45 % of the population (BID-CEPAL 2021). In the Caribbean, tropical cyclones cause upwards of 5.7 % of GDP in damage to the capital stock per year (Acevedo 2016). The intensification of climate change is projected to significantly disrupt tourism in the Caribbean (Cevik and Ghazanchyan 2020; Granvorka and Strobl 2013; Pathak et al. 2021).
Investment to respond to climate change is currently lacking. The region invests little in absolute terms and relative to other developing regions (Titelman et al. 2023). Public investment is particularly weak, resulting in a public capital stock vulnerable to climate change and unable to provide the economic services needed for growth (ECLAC 2022). Fiscal space to increase public investment is limited. Public debt levels are at levels not seen in the last 20 years (ECLAC 2023a). Countries are under increasing pressure to cut spending to ensure debt sustainability.
Responding to climate change is an economic and social imperative for the region. To assess the potential macrofiscal impact of climate change in Latin America and the Caribbean we examine six country cases: Barbados, Dominican Republic, El Salvador, Guatemala, Honduras, and Saint Lucia (CAC6). Members of this group are uniquely vulnerable to changes in climatic conditions due to their geography, their elevated dependence on economic activities that will be heavily impacted by climate change (such as agriculture and tourism), and their differing levels of poverty and inequality.[1]
This article contributes to the existing literature in several ways. First, it provides additional estimates for the macroeconomic damage caused by lower productivity and more destructive and severe weather events in Central America and the Caribbean. It also presents an independent measure of the investment needed to combat climate change. Second, this article explores the macrofiscal implications of an investment strategy based on the investment requirements outlined in the Nationally Determined Contributions (NDCs). Third, we establish the important role that concessional climate finance could play to make an NDCs-based investment push viable.
The remainder of this article is organized as follows. Section 2 reviews investment trends and fiscal constraints for additional public climate investment. Section 3 describes the methodology used to model climate shocks and provides results. Section 4 presents the estimates of the macrofiscal implications of an NDCs investment strategy, while Section 5 examines concessional climate finance and debt dynamics. Finally, Section 6 provides concluding remarks.
2 Large-Scale Investment is Needed to Combat Climate Change, but There are Significant Fiscal Constraints to an Increase in Public Investment
These results are broadly in line with estimates in the literature of the magnitude of investment necessary to achieve sustainable development objectives. Bhattacharya et al. (2022) finds that emerging markets, excluding China, would need to raise their spending on human capital, sustainable infrastructure, adaptation and resilience, and restore natural capital from 11.3 % of GDP in 2019 to 18.2 % of GDP in 2030 to meet key development and climate goals. Similarly, Rozenberg and Fay (2019) estimate that annual investment outlays of 7.2 % of GDP would be necessary in low- and middle-income countries to close development gaps in electricity, transportation, water sanitation, flood protection and irrigation.
Estimates for Latin America and the Caribbean are sparse, but they are in line with investment requirements for emerging and developing economies. For example, Rozenberg and Fay (2019) find that the region would require annual investment outlays of between 2.6 % of GDP and 8.8 % of GDP. Fay et al. (2017) provides a similar range of estimates for additional annual infrastructure investment, with figures from 3 % of GDP to 8 % of GDP. These estimates for the region are focused principally on closing infrastructure gaps. Including social goals would potentially result in much larger spending demands. For example, Castellani et al. (2019) find that countries in the region would need to spend upwards of 10.6 % of GDP per year by 2030 to address infrastructure needs and to tackle extreme poverty.
These requirements contrast sharply with investment trends in CAC6 countries. Total gross fixed capital formation during the period 2010–2019 fell relative to 2000–2009 in all countries except the Dominican Republic (Table 1). The contraction in total investment in 2010–2019 was not shared equally across CAC6 countries. Significant declines were registered in Guatemala (−3.8 percentage points of GDP), Honduras (−2.8 p.p. of GDP), Saint Lucia (−2.5 p.p. of GDP) and Barbados (−2.4 p.p. of GDP). In contrast, investment was relatively stable in the Dominican Republic. Falling public investment was the principal driver of the reduction in total investment in several countries. This coincided with efforts over the period to constrain public spending with the aim of ensuring public debt sustainability.
CAC6: public, private and total investment, 2000–2019a,b (percentages of GDP).
| Country | Period | Public | Private | Total |
|---|---|---|---|---|
| Barbados | 2000–2009 | 4.7 | 13.6 | 18.3 |
| 2010–2019 | 2.1 | 13.8 | 15.9 | |
| ∆ (p.p. of GDP) | −2.6 | 0.2 | −2.4 | |
| Dominican Republic | 2000–2009 | 4.4 | 19.6 | 24.1 |
| 2010–2019 | 3.3 | 20.8 | 24.2 | |
| ∆ (p.p. of GDP) | −1.1 | 1.2 | 0.1 | |
| El Salvador | 2000–2009 | 2.9 | 14.3 | 17.2 |
| 2010–2019 | 2.4 | 13.9 | 16.3 | |
| ∆ (p.p. of GDP) | −0.6 | −0.4 | −1.0 | |
| Guatemala | 2000–2009 | 3.4 | 15.1 | 18.5 |
| 2010–2019 | 1.8 | 12.9 | 14.7 | |
| ∆ (p.p. of GDP) | −1.6 | −2.3 | −3.8 | |
| Honduras | 2000–2009 | 4.6 | 21.5 | 26.1 |
| 2010–2019 | 3.3 | 20.0 | 23.3 | |
| ∆ (p.p. of GDP) | −1.3 | −1.5 | −2.8 | |
| St. Lucia | 2000–2009 | 5.5 | 20.0 | 25.5 |
| 2010–2019 | 4.9 | 18.1 | 23.0 | |
| ∆ (p.p. of GDP) | −0.6 | −1.9 | −2.5 |
-
Source: Authors’ elaboration based on IMF Investment and Capital Stock Dataset 2021, and national sources. aGross fixed capital formation. Ratios calculated on the basis of constant prices. Excludes investments carried out by public private partnerships. bSimple averages for each decade.
Fiscal space to undertake climate change investment is limited. In the decade between 2010 and 2019, general government gross public debt rose sharply in most of the CAC6 countries: Barbados (14.8 p.p. of GDP), Dominican Republic (16.3 p.p. of GDP), El Salvador (11.3 p.p. of GDP), Honduras (21.2 p.p. of GDP), and Saint Lucia (9.9 p.p. of GDP) (Figure 1). In the case of Barbados, this variation hides significant volatility in the level of public debt, which rose to 158.3 % of GDP in 2017, before a comprehensive restructuring in 2018–2019 substantially reduced the debt burden. Guatemala was the only country where debt levels remained relatively stable over the period, which reflects a tight fiscal stance. The COVID-19 crisis created a generalized and significant increase in public debt levels. The most prominent increases between 2019 and 2020 were registered in Saint Lucia at 34.8 percentage points of GDP followed by El Salvador (18.1 p.p.), Dominican Republic (17.9 p.p.), and Barbados (16.8 p.p.).
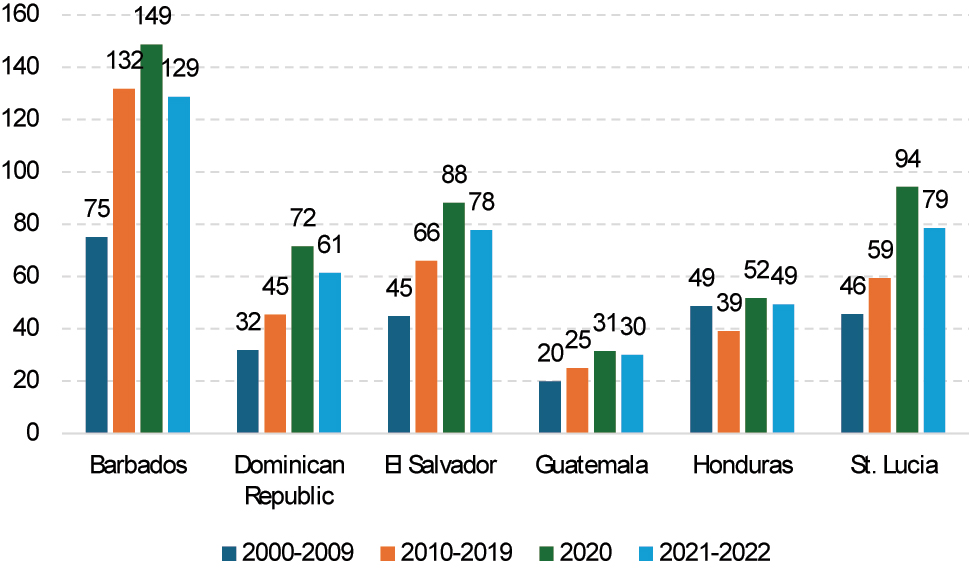
CAC6: general government gross public debt, 2000–2022. (Percentages of GDP). Source: Author’s elaboration based on IMF (2023).
Spending pressures and slowing public revenues notwithstanding, public debt trajectories for most of the CAC6 countries are currently considered sustainable by the IMF. Estimates in recent Article IV staff reports based on the Debt Sustainability Analysis (DSA) framework find that debt dynamics in Barbados, Dominican Republic, Guatemala, Honduras, and Saint Lucia are consistent with stable or declining debt levels (IMF 2022b, 2022c, 2022d, 2022e, 2021b). Only in El Salvador are current debt dynamics considered to be unsustainable (IMF 2022f). However, traditional measures of debt sustainability do not sufficiently capture the development implications of high levels of debt service (ECLAC 2023b).
As highlighted in ECLAC (2023b), interest payments by members of the group are very significant. CAC6 countries dedicate between 14 % and 24 % of their tax revenues to cover interest payments, with the highest levels observed in the Dominican Republic and El Salvador. At the same time, interest payments in Barbados, Dominican Republic, El Salvador, and Honduras equaled to nearly 100 % or more of central government capital expenditures, which served as the principal instrument of fiscal adjustment during the last decade. Interest payments represent roughly one-third of central government social spending in Dominican Republic, El Salvador, and Honduras.
3 Climate Change Shocks Will Negatively Impact Medium-Term Growth
The economic impact of climate change in CAC6 countries is multifold and is not easily modelled. Following Central Bank of Chile (2017) and IMF (2022a), a trend growth baseline scenario for 2025–2050 is estimated by employing a neoclassical Cobb-Douglas production function with constant returns to scale (Annex 1). A scenario capturing the intensification of climate change shocks is constructed by incorporating their effect through two principal channels. First, the model incorporates forecasts prepared by the Network for Greening the Financial System (NGFS) of economic losses from the progressive reduction in labor productivity and agricultural production (NGFS 2021). Second, the model incorporates losses due to increasingly severe extreme weather events. This is simulated in the model using a series of progressively larger natural disasters occurring in five-year intervals across the forecast period. These events impact economic growth through their destructive impact on capital stock.
The simulated economic consequences of the intensification of climate shocks for CAC6 countries are significant, with a significant decline in both rate of growth and level of per capita GDP over the medium term relative to the trend growth counterfactual (Table 2). The shortfall in growth reflects the progressive and stepwise drag on labor and agricultural productivity caused by rising temperatures. These effects are especially acute in countries such as El Salvador, Guatemala and Honduras, where the agricultural sector and related activities represent a significant share of economic activity. At the same time, all CAC6 countries will be exposed to an increase in severe weather events – droughts, floods, and hurricanes, among others – that will have a destructive impact on the capital stock and therefore on economic growth. These effects would be tempered by the continued, albeit decelerating, growth of the labor force in countries such as the Dominican Republic, El Salvador, Guatemala and Honduras.
CAC6: GDP per capita, by scenario, 2024–2050 (percentages).
| Country | GDP per capita growth rate, 2024–2050a | GDP per capita level in 2050 relative to trend growth scenario | |
|---|---|---|---|
| Trend growth scenario | Intensification of climate shocks scenario | Intensification of climate shocks scenario | |
| Barbados | −0.1 | −0.5 | −9.4 |
| Dominican Republic | 1.9 | 1.4 | −12.2 |
| El Salvador | 1.5 | 0.9 | −12.3 |
| Guatemala | 1.8 | 1.3 | −12.2 |
| Honduras | 1.5 | 1.0 | −11.3 |
| Saint Lucia | 1.3 | 0.8 | −11.6 |
-
Source: Authors’ elaboration. aCompound average growth rate.
The negative impact of climate shocks is also reflected in the trajectory of GDP per capita, which in most CAC6 countries would continue to grow but at a lower rate than compared to the trend growth scenario counterfactual. This is particularly concerning for the countries of Central America and the Dominican Republic with relatively lower levels of GDP per capita; their populations are projected to undergo a rapid demographic transition, suggesting that climate change will make attaining higher middle-income status more difficult before they grow older. These countries already face relatively higher levels of multidimensional poverty – income, education, health, and basic infrastructure – which will be further aggravated by these trends.
Compensating for the economic losses caused by climate change would require an unprecedented and sustained investment push. Based on the results of the macroeconomic modelling, returning to the level of per capita GDP estimated in 2050 under the trend growth scenario from the intensification of climate shocks scenario could be possible, but it would necessitate on average additional annual investment exceeding 5 percentage points of GDP in Dominican Republic (5.8), El Salvador (5.3), Guatemala (5.3), and Saint Lucia (6.9), and more than 8 percentage points of GDP in Barbados (8.5) and Honduras (10.9).
These investments would need to be economy-wide, driving a productive transformation that would generate sustainable economic growth. It is important to note that these estimated annual values do not consider potential inefficiencies in the implementation of investment projects or the existence of structural limits to additional investment. Therefore, policymakers seeking to compensate for the losses due to climate change should also consider investments in other areas such as research and development, education and training, and health, to bolster total factor productivity.
These results should be considered with care, acknowledging the inherent limitations of Cobb-Douglas modelling approaches. For example, the assumption of homogenous elasticity of substitution between labor and capital is especially problematic as climate change will have a strong sectoral impact. The presumption of technological neutrality is also unrealistic given that the development and adoption of new technologies, such as low-carbon goods and services, could mitigate the impact of climate change. Additionally, the model does not specifically include inputs such as human or natural capital which are usually linked to medium term growth. Finally, the underlying production function depends on various key parameters that are determined exogenously and whose values are difficult to estimate and will likely change over the medium term as climate change intensifies.
4 Investment in Line with NDCs Would Limit Economic Losses, but Would Cause Debt Dynamics to Deteriorate
Accomplishing the climate change mitigation and adaptation objectives included in the NDCs would entail significant investments (although not as much as what would be needed to fully compensate for climate change-related economic losses). Figures included in some NDCs suggest that annual adaptation and mitigation investment outlays in the period leading to 2030 could span a wide range from roughly 1 % of GDP to more than 20 % of GDP in some countries (Figure 2). Estimated annual investment needs for small island developing States (SIDs) in the Caribbean are especially large, reaching 21.8 % of GDP per year in the case of Dominica. Nevertheless, the lack of comprehensive investment requirements, both in magnitude and composition, is a major barrier to policy analysis and the formulation of climate financing mechanisms.
![Figure 2:
Latin America and the Caribbean (selected countries): estimated annual financing requirements outlined in nationally determined contributions (NDCs) submissions (percentages of GDP). Source: Authors’ elaboration based on data from Climate Watch, [online] https://www.climatewatchdata.org/.](/document/doi/10.1515/jgd-2023-0100/asset/graphic/j_jgd-2023-0100_fig_002.jpg)
Latin America and the Caribbean (selected countries): estimated annual financing requirements outlined in nationally determined contributions (NDCs) submissions (percentages of GDP). Source: Authors’ elaboration based on data from Climate Watch, [online] https://www.climatewatchdata.org/.
To examine the macroeconomic implications pursuing the actions outlined in the NDCs, the intensification of climate shocks scenario is modified to incorporate a climate change investment component. To make the models tractable despite the paucity of information on investment needs for the CAC6 countries, investment needs for all countries are set to the values presented by the Dominican Republic in the country’s first updated NDC submission.[2] Additional annual investment in the NDC investment model is set to 1.8% of GDP, with 0.9% of GDP for mitigation and 0.9% of GDP for adaptation.
Investment requirements in the NDCs are not limited to public sector efforts, but also foresee the active participation of the private sector. In line with UNCTAD (2014), the model assumes that investment in adaptation is divided into 80 % for the public sector and 20 % for the private sector. In the case of mitigation investment, the public sector represents 40 % of the total while the private sector accounts for the remaining 60 %. The model therefore captures the impact of public and private NDC investment on GDP.
To analyze the impact of a front-loaded adaptation investment push, the model assumes that public adaptation outlays rise smoothly, doubling by the middle of the first decade of the projection period (2025–2034). Public adaptation investment subsequently declines, reaching a value that ensures that total public adaptation investment for the entire forecast period does not exceed the level that would have been observed if annual investment were held flat at the value, relative to GDP, obtained from the NDC of the Dominican Republic. In contrast, private sector adaptation investment is not front-loaded.
Under an NDC investment scenario, public investment would roughly double in most CAC6 countries during the first years of the front-loaded adaptation push but would remain at levels lower than those observed during the 2000s in most cases. Proactive front-loaded adaptation investment would result in a significant increase in public gross fixed capital formation (Table 3). However, public investment under an NDC investment scenario is not substantially higher than that seen in the early 2000s in Barbados, Dominican Republic, El Salvador, Guatemala, and Honduras. Public gross fixed capital formation after the initial front-loaded investment drive would remain above the levels that are projected to prevail over the projection period under the trend growth scenario. Investment levels in the counterfactual case should be considered a lower bound, although they are in line with recent trends.
CAC6: general government investment, 2000–2050a,b (percentages of GDP).
| Country | 2000–2009 | 2010–2019 | 2024 | Front-loaded period | 2035–2050 | |
|---|---|---|---|---|---|---|
| 2025–2034 (average) | 2030 (maximum) | |||||
| Barbados | 4.7 | 2.1 | 2.6 | 3.8 | 4.2 | 3.3 |
| Dominican Republic | 4.4 | 3.3 | 3.7 | 3.7 | 4.1 | 3.1 |
| El Salvador | 2.9 | 2.4 | 1.9 | 3.1 | 3.4 | 2.4 |
| Guatemala | 3.4 | 1.8 | 1.1 | 2.6 | 3.0 | 2.0 |
| Honduras | 4.6 | 3.3 | 2.6 | 4.1 | 4.5 | 3.4 |
| Saint Lucia | 5.5 | 4.9 | 5.7 | 6.5 | 6.9 | 5.8 |
-
Source: Authors’ elaboration based on IMF Investment and Capital Stock Dataset 2021, national sources, and projections. aGross fixed capital formation. Ratios calculated on the basis of constant prices. Excludes investments carried out by public private partnerships. bSimple averages for each period.
An NDC investment push would attenuate the worst of the economic losses in the intensification of climate shocks scenario, but per capita GDP in CAC6 economies would still be between 5 % and 7 % smaller in 2050 than under the trend growth counterfactual (Table 4). A front-loaded adaptation investment push, and the accompanying increase in the capital stock, would accelerate growth in the short term and generate positive dynamic effects on economic activity in the medium term. Additionally, a growing climate adaptation capital stock would offset in part the impact of severe weather events on economic output (Annex 1). As a result, per capita GDP in the NDC investment scenario would situate itself roughly halfway between that of the trend growth counterfactual and the intensification of climate shocks scenario.
CAC6: GDP per capita, by scenario, 2024–2050 (percentages).
| Country | GDP per capita growth rate, 2024–2050a | GDP per capita level in 2050 relative to trend growth scenario | |||
|---|---|---|---|---|---|
| Trend growth scenario | Intensification of climate shocks scenario | NDC investment scenario | Intensification of climate shocks scenario | NDC investment scenario | |
| Barbados | −0.1 | −0.5 | −0.4 | −9.4 | −5.8 |
| Dominican Republic | 1.9 | 1.4 | 1.7 | −12.2 | −6.6 |
| El Salvador | 1.5 | 0.9 | 1.2 | −12.3 | −6.3 |
| Guatemala | 1.8 | 1.3 | 1.6 | −12.2 | −5.2 |
| Honduras | 1.5 | 1.0 | 1.2 | −11.3 | −7.1 |
| Saint Lucia | 1.3 | 0.8 | 1.1 | −11.6 | −6.8 |
-
Source: Authors’ elaboration. aCompound average growth rate.
The impulse of NDC investment on growth may be understated in these results. Recent studies suggest that public investment fiscal multipliers could exceed unity in emerging markets and developing economies under certain conditions. Izquierdo et al. (2019) estimated a public investment multiplier above unity in Argentina, Paraguay and Peru, arguing that multipliers are higher in countries with a low capital stock, such as those in Latin America, than in those with a high capital stock. The same authors note that public investment is more likely to crowd-in private investment than primary expenditure, given the positive side effects that the former has on the marginal productivity of private capital. Additionally, Batini et al. (2021) find that the investment multiplier (public and private) for renewable energy and biodiversity conservation projects is in the range of 1.1–1.5, while that for fossil fuel energy projects and land use activities is considerably lower (0.5–0.6).
Losses in GDP per capita would be offset in part by NDC investment, declining instead between 5 % and 7 % compared to the trend growth counterfactual. The front-loaded climate adaptation investment push and capital outlays for climate mitigation could support economic activity, resulting in higher levels of GDP per capita than under the intensification of climate shocks scenario. Although GDP per capita could trend lower compared to the trend growth scenario, climate investments could generate significant positive secondary effects, supporting employment creation and the formalization of economic activity.
To assess the impact of an NDC investment push on public accounts, debt dynamics are modelled using the Debt Sustainability Analysis framework. Simplifying assumptions are employed to model debt dynamics for each scenario:
Total revenues – excluding carbon tax receipts – and current primary expenditure are assumed to grow such that their share relative to GDP remains constant over the projection period. Carbon tax revenues are included in the models based on the work of Titelman et al. (2022), although they are inconsequential for the models’ results.
Capital expenditure consists of three components: an inertial component, which assumes that capital expenditure grows such that its ratio with respect to GDP remains constant; a front-loaded climate adaptation investment component; and a climate mitigation investment component.
Movements in primary spending, and by extension the primary balance, are therefore entirely accounted for by changes in climate mitigation and adaptation investment. Debt dynamics are calculated using the modeled real GDP growth rate and primary balance, as well as the average effective interest rate on public debt (for the period 2018–2022) and inflation (GDP deflator from WEO), both of which are held constant over the forecast period.[3]
Public debt levels are projected to remain elevated or experience accelerating growth in most CAC6 countries in the NDC investment scenario. As shown in Figure 3, debt levels grow rapidly in El Salvador, Guatemala, Honduras and Saint Lucia. Debt dynamics over the projection period in these countries are heavily influenced by the creation of large primary deficits due to greater public investment outlays. Lower growth, relative to the baseline case, also leads to a greater contribution of the interest rate-growth differential to the increase in debt. In El Salvador, debt levels accelerate rapidly under any scenario. In contrast, in Barbados and the Dominican Republic, the NDC investment big push would result in public debt levels that remain roughly at the levels estimated in 2024 before the forecast period. However, this would imply that public debt in Barbados would exceed 100 % of GDP.
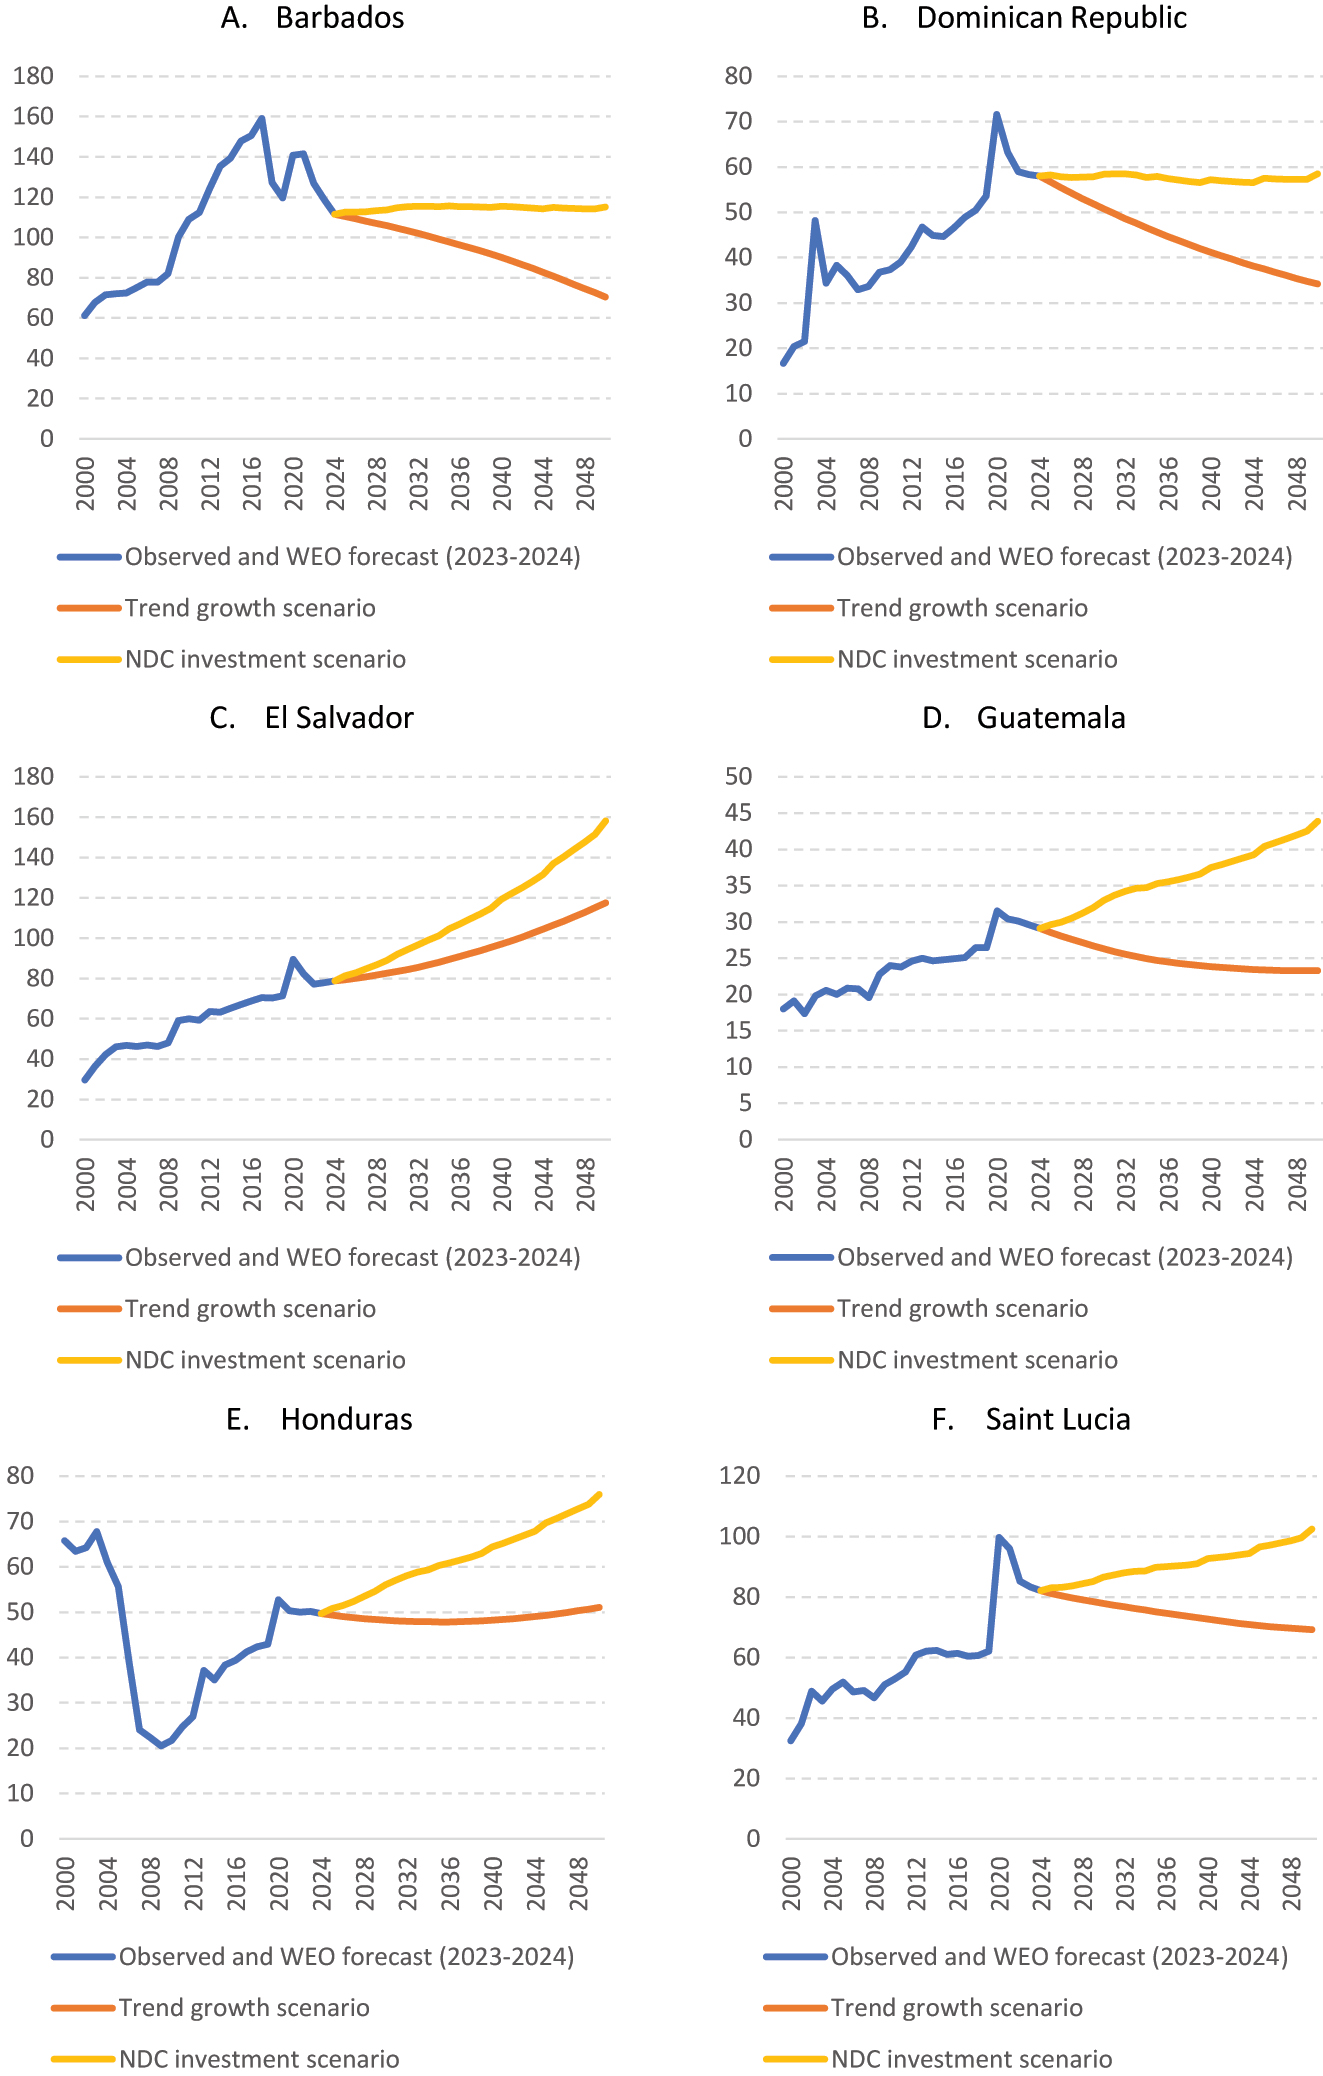
CAC6: central government gross public debt, by scenario, 2000–2050 (percentages of GDP). Source: Authors’ elaboration.
5 Lower Financing Costs of Climate Investment Could Have a Significant Impact on Debt Trajectories
High interest rates on public debt play a significant role in debt trajectories in the NDC investment scenario. The effective interest rate for public debt is elevated in most CAC6 countries. The average effective rate for the 2018–2022 period exceeded 5 % in the Dominican Republic (5.5 %) and El Salvador (5.5 %) and was 6.2 % in Guatemala and 7.0 % in Honduras. The effective interest rate for public debt was relatively lower in Saint Lucia (4.6 %) as well as Barbados (4.4 %), reflecting in large part the impact of the restructuring of public debt carried out in 2018 and 2019.
Effective interest rates may not adequately capture the market rates that countries would face if they were to finance NDC investment through debt offerings in international financial markets, where rates may be significantly higher. Cevik and Tovar Jalles (2020) find that climate vulnerable countries, especially developing countries, face significantly higher borrowing costs, even when controlling for factors that influence sovereign risk. Similarly, Beirne, Renzhi, and Volz (2020) argue that vulnerability to the direct effects of climate change is a significant driver of the cost of sovereign finance.
At the same time, Cevik and Tovar Jalles (2020) suggest that countries with higher climate resilience – the capacity to convert economic investments into adaptation actions – benefit from lower interest rates. Countries who cannot finance front-loaded climate adaptation and mitigation investments have potential to face a negative feedback loop.
Reducing the cost of climate finance could bend debt trajectories downwards and would allow countries to implement NDC investment while ramping up domestic resource mobilization. A major stumbling block to carrying out a front-loaded investment push is the lack of sufficient public revenues or low-cost debt finance. Proactive public climate investment efforts would become more viable if countries could access sufficient concessional finance.
To explore the extent to which concessional climate financing could impact debt dynamics, the NDC investment scenario was modified to use an interest rate that is one half of the prevailing effective interest rate for debt-financed public climate investment. Under this scenario, public debt largely stabilizes in the medium term in Saint Lucia (Figure 4). In Guatemala and Honduras, concessional financing softens the rise in public debt, which is projected in the NDC investment scenario without concessional finance but does not fully stabilize the medium-term debt curve. In the Dominican Republic and Barbados, concessional climate finance would lead to lower debt levels over the forecast period compared to the original NDC investment scenario. In contrast, debt dynamics remain unfavorable in El Salvador, even with concessional financing.
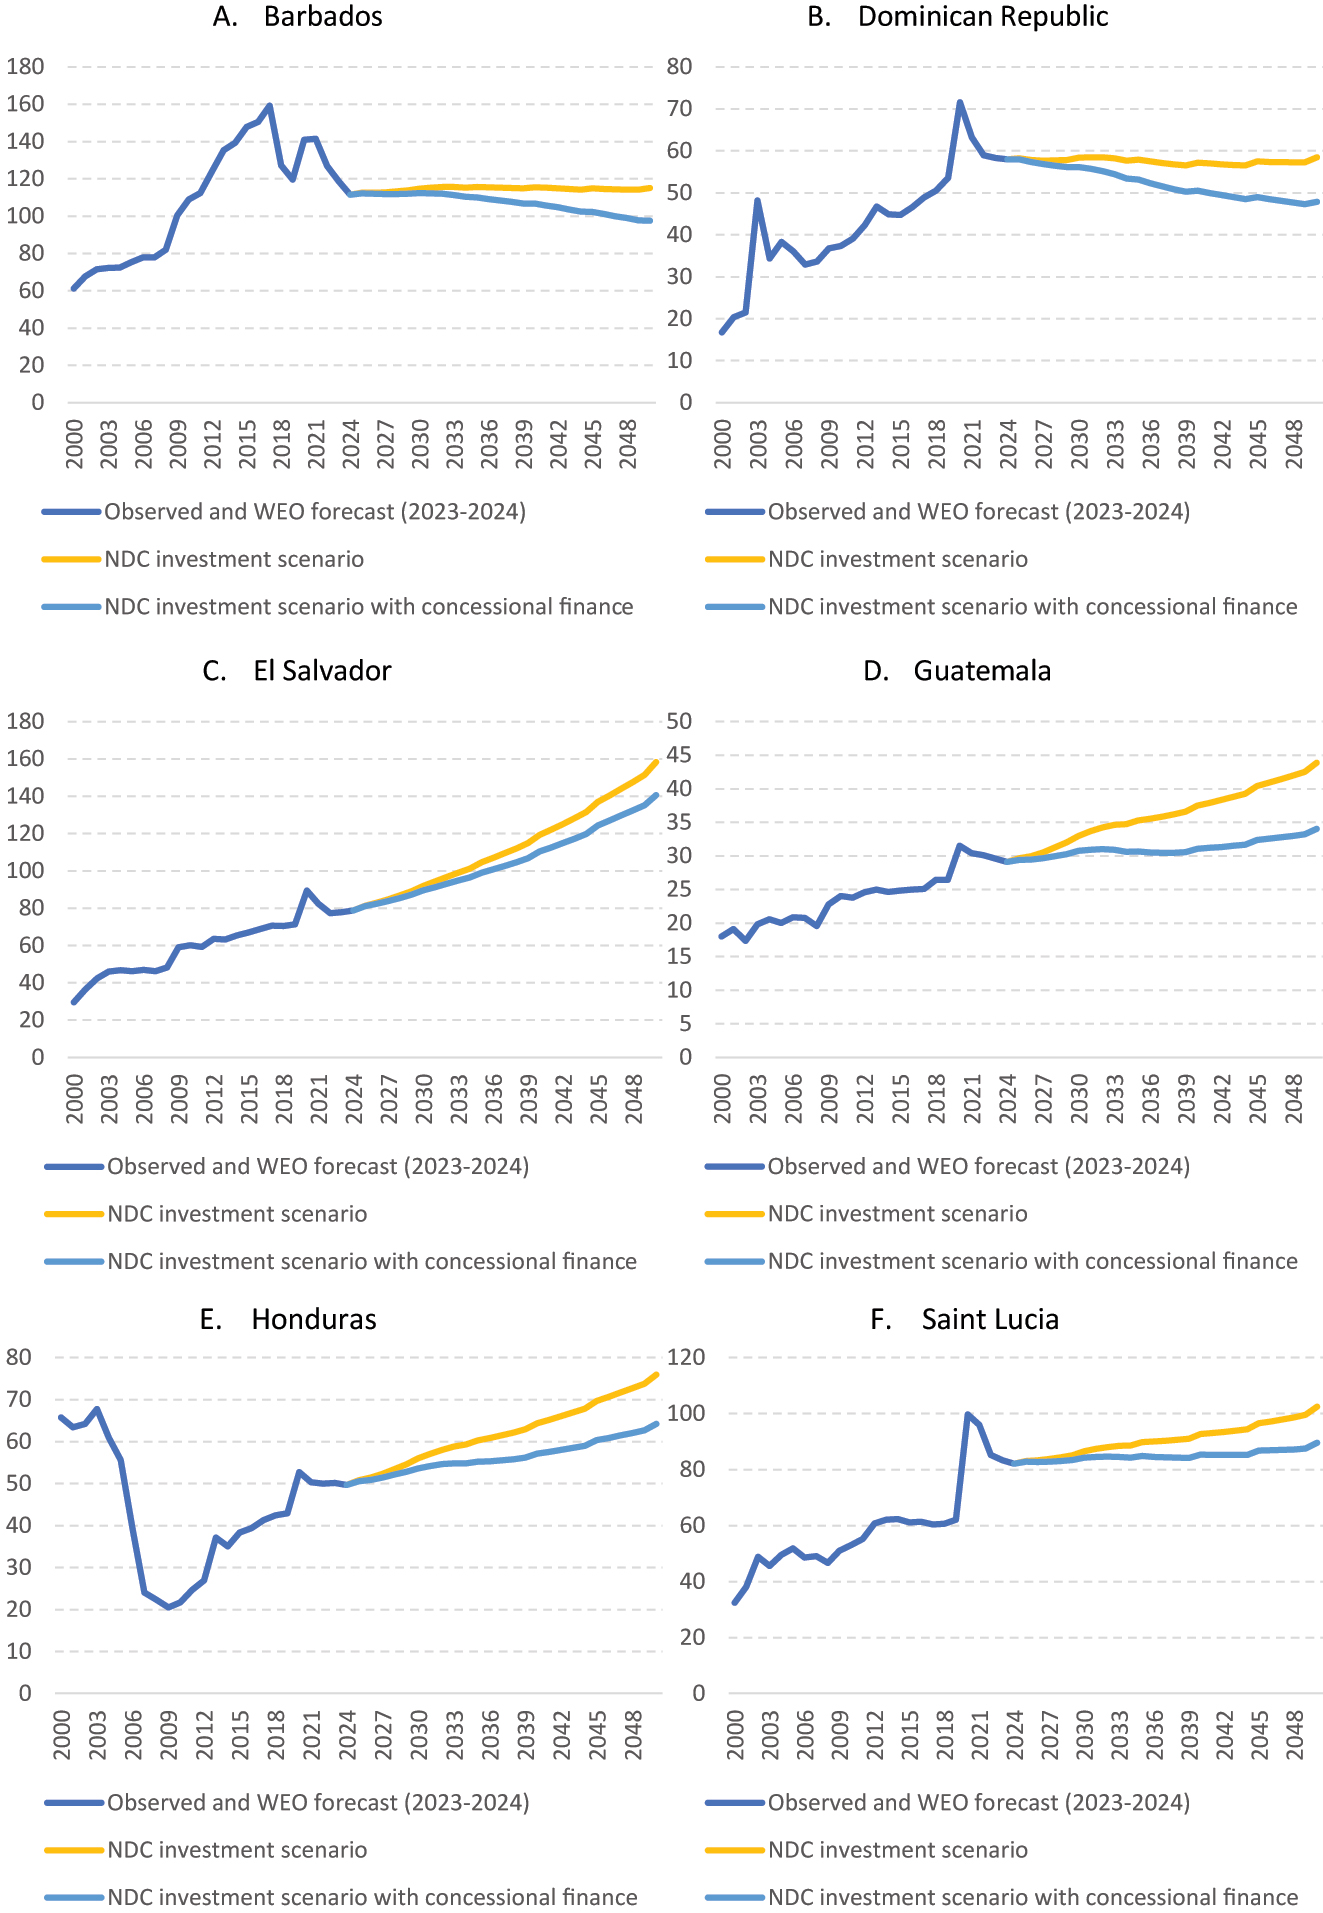
CAC6: central government gross public debt, by scenario, 1990–2050 (percentages of GDP). Source: Authors’ elaboration.
6 Conclusions
Climate change is projected to have a strong negative impact on medium term economic growth and social welfare in Latin America and the Caribbean. CAC6 countries are particularly vulnerable to these shocks due to their geographical location, dependence on climate-sensitive economic sectors, and existing developmental challenges such as poverty and inequality. As presented in this article, the economic losses in CAC6 countries caused by changing hydrometeorological conditions and more intense severe weather events are estimated to be significant, with a sharp deceleration in per capita GDP growth. However, these results should be considered as a lower bound as the model used in this study does not fully account for the non-linear effects of climate risks on economic growth.
Offsetting the economic losses caused by climate change would require a sustained investment effort of unprecedented magnitude in these countries of between 5.3 % of GDP to 10.9 % of GDP per year on average. However, a front-loaded investment push of a smaller magnitude would improve medium term growth, although not completely compensate for the estimated losses from climate change. Such an effort, in line with countries’ Nationally Determined Contributions submissions, would roughly halve the estimated reduction in per capita GDP growth caused by climate change. However, pursuing a front-loaded investment push would negatively impact public debt dynamics, even when accounting for improved economic growth.
CAC6 countries already face significant debt-related development distress which limits fiscal space for active policymaking even though most of their current debt trajectories are sustainable. Borrowing costs, proxied by effective interest rates, are high in most CAC6 countries. These high interest rates make financing climate investments particularly difficult because they lead to higher interest payments, which in turn reduces the fiscal space needed to undertake proactive climate adaptation investments (ECLAC 2023b).
It is therefore essential to take steps to reduce the cost of financing to make climate and development investments fiscally viable over the medium term. We estimate that concessional climate finance, proxied by public debt issued with an interest rate of one half of the prevailing effective rate, could potentially make a front-loaded NDC investment push fiscally viable in most CAC6 countries. This result would be further improved by efforts to increase domestic resource mobilization, especially in countries like the Dominican Republic, Guatemala and Saint Lucia, where total tax revenues represented less than 20 % of GDP in 2022 (OECD et al. 2024).
Low-cost climate financing by international financial institutions is essential to meet investment needs. These entities can provide crucial financing to reduce the cost of capital and unlock investment. Between 2019 and 2020, multilateral institutions and national development banks provided an average of 11.5 billion US dollars (0.2 % of 2019 GDP) per year in climate finance in the region (CPI 2021). A significant portion was in the form of low-cost project debt or project-level market rate debt. However, this amount is currently insufficient to leverage the amount of private capital necessary to meet climate objectives. Multilateral institutions and national development banks should be further capitalized to increase their lending capacity.
It is also critical to build capacity to consider climate investment in policies. It is crucial to mainstream climate change policies in macro-fiscal planning, budgeting, public investment management, and public procurement. It is also necessary to encourage cooperation between countries and between development partners, such as international financial institutions and bilateral donors (The Coalition of Finance Ministers for Climate Action 2023). Technical assistance could play a catalytic role in helping governments adopt a strategic perspective and public policies that prioritize investments with high environmental, economic, and social returns. In this regard, it is important to consider projects with significant positive externalities even if they are not financially viable without assistance.
Furthermore, given that the impacts of climate change and the policies designed to combat them are not equitably distributed, it is essential to understand the distributive effects of policies that are going to be implemented and ensure that the vulnerabilities of low-income individuals and other populations are incorporated into policy analysis. Women, especially those living in poverty, are more vulnerable to the impacts of climate change and experience more significant risks and challenges. The inequalities they face are exacerbated because the majority of the world’s poor are women. Additionally, women’s unequal participation in decision-making processes and labor markets limits their ability to contribute to climate-related planning, policymaking, and implementation (UNFCCC 2022).
Funding source: Boston University
Methodology for the Estimation of Medium-Term GDP Growth in the “Trend Growth” Counterfactual Scenario
Following the Central Bank of Chile (2017), medium-term GDP is forecasted using a Cobb-Douglas function that is frequently employed in neo-classical growth models. This function assumes that total value-added in the economy (output) can be expressed as a function of total factor productivity, the installed capital stock, and the labor force:
Where Y denotes GDP, K is the installed capital stock, L is the labor force and A corresponds to total factor productivity. The values of α and β correspond to the output elasticities of capital and labor, respectively.
The Cobb-Douglas production function assumes constant returns to scale, thus the sum of α and β is constrained to be unitary. As such, the output elasticity of capital (α) is traditionally set to be equivalent to (1 – β).
The value of β in the model is set exogenously based on the labor share of GDP from national accounts, using data generated by the International Labor Organization (ILO) for SDG indicator 10.4.1.
Building on this production function, GDP trend growth is obtained by taking logs and differentiating the equation such that:
Where the lowercase variables correspond to the growth rate of the variables in the previous equation.
Capital accumulation in the model follows a perpetual inventory equation that is typical in the literature:
Where K i,t corresponds to install capital stock, δ to the depreciation rate (set to 5 %), and I i,t to the among of total public and private investment. Investment in the “trend growth” counterfactual scenario is assumed to remain constant relative to GDP – in line with recent trends in investment to GDP ratios – at a level to maintain the capital stock to GDP ratio steady over the forecast period.
The forecast period in this paper corresponds to 2025–2050. Observed data for GDP, GDP deflator, and general government fiscal accounts for 1990–2022 and estimated data for 2023–2024 are from the World Economic Outlook (IMF 2023), CEPALstat, or national sources. The model was calibrated using estimated data for 2023–2024 from IMF (2023), due to significant continuing macroeconomic volatility caused by the COVID-19 pandemic.
Installed capital stock comes from the IMF’s “Investment and Capital Stock Dataset, 1960–2019” database. Capital stock for the period 2020–2024 was estimated based on the growth of public and private investment from national accounts or for overall investment from the IMF (2023).
Observed and forecast values for the potential labor force – defined as the population between the ages of 15 and 64 are from the World Population Prospects 2022; United Nations 2022).
Growth of total factor productivity is taken as the median of the Solow residual for the period 1990–2022, or from estimates derived from Penn World Tables.
Methodology for the Estimation of Medium-Term GDP Growth in the “Intensification of Climate Shocks” Scenario
The impact of climate change on economic output is modelled through two principal channels: the progressive erosion of the underlying determinants of economic growth due to climate change through its negative impact on productivity and agricultural production; and the rising intensity of severe weather events.
To capture the progressive impact of climate change on economic output (GDP), the Cobb-Douglas production function (equation (1)) is expanded to include country-specific expected macroeconomic losses, as published by the Banking Network Centrals and Supervisors to Green the Financial System (2021):
Where Y denotes GDP, θ
i,t
is the cumulative macroeconomic loss caused by climate change in percentage, and
In the “trend growth” counterfactual scenario, the value of θ i,t is set to 0. In the “intensification of climate shocks” scenario, θ i,t is equal to the cumulative country and year specific reduction in GDP (95th percentile) under the “current policies scenario” of the Networking for Greening the Financial System (2021).
The impact of the increasing intensity of severe weather events in the model is captured by subjecting the installed capital stock to a series of shocks that occur every five years.
The damage caused by these events – as a percentage decrease in the overall capital stock – increases linearly, from 1 % in 2050 to a value equivalent to the maximum damage value (4.7 %) for Central American countries in the EM-DAT database in 2050 (CRED 2020). Caribbean countries were excluded from the calculation as estimated damage figures were extreme outliers and would introduce a significant bias.
Methodology for the Estimation of Medium-Term GDP Growth in the “NDC Investment” Scenario
To estimate the impact on growth of an NDC investment push, the capital accumulation equation (equation (3)) is modified to include public and private investment in climate change adaptation and mitigation:
With:
Where I inertial,i,t corresponds to the investment level established for the “trend growth” counterfactual scenario, I public adaptation,i,t and I private adaptation,i,t to public and private adaptation investment, and I public mitigation,i,t and I private mitigation,i,t to public and private mitigation investment.
Given the paucity of available estimates for climate adaptation and mitigation investment needs specifically for CAC6 countries, the annual investment needs from the NDC submission of the Dominican Republic – 1.8 % of GDP: 0.9 % of GDP per year for adaptation and 0.9 % of GDP per years for mitigation – are used as a proxy for all countries.
The distribution of climate adaptation and mitigation investment between the public and private sector is based on UNCTAD (2014), which estimates that 80 % of adaptation investment and 40 % of mitigation investment is carried out by the public sector.
Adaptation investment is assumed to mitigate in part the shocks to the overall capital stock due to severe weather events. In the “NDC investment” scenario the gross impact of the modeled severe weather events on the capital stock is reduced as a function of the share of adaptation capital stock in the total capital stock.
Public sector adaptation investment in the model is assumed to be front-loaded. In the first decade of the forecast period, adaptation investment rises smoothly to double by mid-decade, after which it declines smoothly before returning to a steady-state level. The steady-state level is constrained such that the sum of investment over the forecast period is equivalent to that which would have prevailed without a front-loaded investment push.
The “NDC investment” scenario assumes that global consensus is formed around the objective for achieving net-zero emissions by 2050. Therefore, the scenario sets the value of θ i,t in equation (4) to the cumulative country and year-specific reduction in GDP (95th percentile) under the “net-zero 2050 scenario” of the Networking for Greening the Financial System (2021).
Methodology for the Estimation of Public Fiscal Accounts in the “NDC Investment” Scenario
Very conservative assumptions are used to make the estimation of fiscal accounts more tractable:
Revenue:
Total revenue, excluding carbon tax receipts, is assumed to remain constant as a percentage of GDP during the projection period.
An estimate of carbon tax revenue is included based on the methodology used in Titelman et al. (2022). However, receipts from this tax are minimal and do not impact the results of the model.
Primary expenditure:
Primary current expenditure remains constant as a percentage of GDP during the projection period. This is equivalent to a very stringent fiscal expenditure rule.
Capital expenditure is modeled in two components:
An inertial component in which capital spending excluding climate investment is assumed to remain constant as a percentage of GDP during the projection period.
Another component that captures public investment in adaptation and mitigation.
Movements in primary expenditure and the primary balance are therefore entirely accounted for by changes in public investment in adaptation and mitigation.
Debt dynamics are modelled using the IMF’s Debt Sustainability Assessment (DSA) framework. The components used in the debt dynamics equations include:
Endogenously determined real GDP growth rate;
Endogenously determined primary balance;
Exogenous constant effective interest rate (observed average for 2018–2022); and,
Exogenous constant inflation (estimated change in GDP deflator in 2024) from the IMF (2023).
Methodology for the Estimation of Public Fiscal Accounts in the “NDC Investment with Concessional Finance” Scenario
In the “NDC investment with concessional finance” scenario debt dynamics are calculated in two parts:
Public debt excluding climate investment is modelled using the assumptions employed in the “NDC investment” scenario.
Public climate investment debt is modelled as a separate balance sheet in which the debt dynamics employ a concessional effective rate that is assumed to be equivalent to 50 % of the current effective rate used in the “NDC investment” scenario.
Total public debt is then presented as the sum of these two calculations.
Acknowledgments
The authors would like to thank Elisa Araneda and Patricia Weng for their excellent research assistance. The authors would also like to thank two anonymous referees for their very helpful comments. The usual disclaimers apply.
-
Research funding: This research was financially supported by Boston University (http://dx.doi.org/10.13039/100007161).
References
Acevedo, Sebastian. 2016. “Gone with the Wind: Estimating Hurricane and Climate Change Costs in the Caribbean.”, No 2016/199, IMF Working Papers, International Monetary Fund.10.2139/ssrn.2882636Search in Google Scholar
Alatorre, J. E., and I. Fernández Sepúlveda. 2022. “Impactos macroeconómicos del cambio climático en América Latina y el Caribe: revisión de la literatura, 2010-2021”, Documentos de Proyectos (LC/TS.2022/182), Santiago, Comisión Económica para América Latina y el Caribe (CEPAL), 2022.Search in Google Scholar
Baca, M., P. Läderach, J. Haggar, Götz Schroth, and O. Ovalle. 2014. “An Integrated Framework for Assessing Vulnerability to Climate Change and Developing Adaptation Strategies for Coffee Growing Families in Mesoamerica.” PLoS One 9 (2): e88463. https://doi.org/10.1371/JOURNAL.PONE.0088463.Search in Google Scholar
Batini, N., M. Di Serio, M. Fragetta, G. Melina, and A. Waldron. 2021. Building Back Better: How Big Are Green Spending Multipliers? https://www.imf.org/en/Publications/WP/Issues/2021/03/19/Building-Back-Better-How-Big-Are-Green-Spending-Multipliers-50264.10.5089/9781513574462.001Search in Google Scholar
Beirne, J., N. Renzhi, and U. Volz. 2020. “Feeling the Heat: Climate Risks and the Cost of Sovereign Borrowing.” https://www.adb.org/sites/default/files/publication/620586/adbi-wp1160.pdf.10.2139/ssrn.3657114Search in Google Scholar
Bhatia, K., A. Baker, G. Vecchi, H. Murakami, J. Kossin, P. L. Vidale, K. Hodges, and T. Knutson. 2020. An Environmental Explanation for the Recent Increase in Tropical Cyclone Intensification, EGU General Assembly 2020, 2020: EGU2020-18644. https://doi.org/10.5194/egusphere-egu2020-18644.Search in Google Scholar
Bhattacharya, A., M. Dooley, H. Kharas, and C. Taylor. 2022. Financing a Big Investment Push in Emerging Markets and Developing Economies for Sustainable, Resilient and Inclusive Recovery and Growth. London: Grantham Research Institute on Climate Change and the Environment, London School of Economics and Political Science, and Washington: Brookings Institution.Search in Google Scholar
Bloemendaal, N., H. de Moel, A. B. Martinez, S. Muis, I. D. Haigh, K. van der Wiel, R. J. Haarsma et al.. 2022. “A Globally Consistent Local-Scale Assessment of Future Tropical Cyclone Risk.” Science Advances 8 (17): eabm8438. Epub 2022 Apr 27. PMID: 35476436; PMCID: PMC9045717. https://doi.org/10.1126/sciadv.abm8438.Search in Google Scholar
BID (Banco Interamericano de Desarrollo) – CEPAL (Comisión Económica para América Latina y el Caribe). 2021. “Evaluación de los efectos e impactos de la tormenta tropical Eta y el huracán Iota en Honduras.” NOTA TÉCNICA No IDB-TN-2168. Washington D.C.: Banco Interamericano de Desarrrollo.Search in Google Scholar
Bouroncle, C., P. Imbach, B. Rodríguez-Sánchez, C. Medellín, A. Martinez-Valle, and P. Läderach. 2017. “Mapping Climate Change Adaptive Capacity and Vulnerability of Smallholder Agricultural Livelihoods in Central America: Ranking and Descriptive Approaches to Support Adaptation Strategies.” Climatic Change 141: 123–37. https://doi.org/10.1007/s10584-016-1792-0.Search in Google Scholar
Burke, M., S. M. Hsiang, and E. Miguel. 2015. “Global Non-linear Effect of Temperature on Economic Production.” Nature 527. https://doi.org/10.1038/nature15725.Search in Google Scholar
Castellani, F., M. Olarreaga, U. Panizza, and Y. Zhou. 2019. “Investment Gaps in Latin America and the Caribbean.” International Development Policy | Revue internationale de politique de développement 11.1, https://doi.org/10.4000/poldev.2894.Search in Google Scholar
Castellanos, E., M. F. Lemos, L. Astigarraga, N. Chacón, N. Cuvi, C. Huggel, L. Miranda et al.. 2022. “Central and South America.” In Climate Change 2022: Impacts, Adaptation and Vulnerability. Contribution of Working Group II to the Sixth Assessment Report of the Intergovernmental Panel on Climate Change, edited by H.-O. Pörtner, D. C. Roberts, M. Tignor, E. S. Poloczanska, K. Mintenbeck, A. Alegría, M. Craig et al.., 1689–816. Cambridge: Cambridge University Press.10.1017/9781009325844.014Search in Google Scholar
Central Bank of Chile. 2017. Trend Growth: Medium-Term Outlook and Analysis of Fundamentals. Santiago: Central Bank of Chile.Search in Google Scholar
Cevik, S., and M. Ghazanchyan. 2020. “Perfect Storm: Climate Change and Tourism.” https://www.imf.org/en/Publications/WP/Issues/2020/11/13/Perfect-Storm-Climate-Change-and-Tourism-49828.10.2139/ssrn.3758076Search in Google Scholar
Cevik, S., and J. Tovar Jalles. 2020. “This Changes Everything: Climate Shocks and Sovereign Bonds.” https://www.imf.org/en/Publications/WP/Issues/2020/06/05/This-Changes-Everything-Climate-Shocks-and-Sovereign-Bonds-49476.10.2139/ssrn.3652499Search in Google Scholar
CPI (Climate Policy Initiative). 2021. Preview: Global Landscape of Climate Finance 2021.Search in Google Scholar
CRED (Centre for Research on the Epidemiology of Disasters). 2020. EM-DAT International Disaster Database. [online] https://www.emdat.be/.Search in Google Scholar
ECLAC (Economic Commission for Latin America and the Caribbean). 2023a. Economic Survey of Latin America and the Caribbean 2023. Santiago: United Nations.Search in Google Scholar
ECLAC (Economic Commission for Latin America and the Caribbean). 2023b. Public debt and Development Distress in Latin America and the Caribbean (LC/TS.2023/20). Santiago: United Nations.Search in Google Scholar
ECLAC (Economic Commission for Latin America and the Caribbean). 2022. Economic Survey of Latin America and the Caribbean 2022. Santiago: United Nations.Search in Google Scholar
Fay, Marianne, Luis Alberto Andres, Charles Fox, Ulf Narloch, Stephane Staub, and Michael Slawson. 2017. Rethinking Infrastructure in Latin America and the Caribbean: Spending Better to Achieve More. Washington: World Bank.10.1596/978-1-4648-1101-2_ch1Search in Google Scholar
Granvorka, C., and E. Strobl. 2013. “The Impact of Hurricane Strikes on Tourist Arrivals in the Caribbean.” Tourism Economics 19 (6): 1401–9. https://doi.org/10.5367/te.2013.0238.Search in Google Scholar
IMF (International Monetary Fund). 2021a. Regional Economic Outlook for Latin America and the Caribbean, October 2021. https://www.imf.org/en/Publications/REO/WH/Issues/2021/10/21/Regional-Economic-Outlook-October-2021-Western-Hemisphere.Search in Google Scholar
IMF (International Monetary Fund). 2022a. A Post-Pandemic Assessment of the Sustainable Development Goals: Background Notes (SDN/2021/003 BN). Washington D.C.: International Monetary Fund.Search in Google Scholar
IMF (International Monetary Fund). 2022b. Barbados: Request for an Arrangement under the Extended Fund Facility and Request for an Arrangement under the Resilience and Sustainability Facility-Press Release; and Staff Report. https://www.imf.org/en/Publications/CR/Issues/2022/12/16/Barbados-Request-for-an-Arrangement-Under-the-Extended-Fund-Facility-and-Request-for-an-527041.10.5089/9781498319942.002Search in Google Scholar
IMF (International Monetary Fund). 2022c. Dominican Republic: 2022 Article IV Consultation-Press Release; and Staff Report. https://www.imf.org/en/Publications/CR/Issues/2022/07/08/Dominican-Republic-2022-Article-IV-Consultation-Press-Release-and-Staff-Report-520543.10.5089/9798400207143.002Search in Google Scholar
IMF (International Monetary Fund). 2022d. Guatemala: 2022 Article IV Consultation-Press Release. Staff Report; and Informational Annex. Available at: https://www.imf.org/en/Publications/CR/Issues/2022/06/07/Guatemala-2022-Article-IV-Consultation-Press-Release-Staff-Report-and-Informational-Annex-519033.10.5089/9798400212215.002Search in Google Scholar
IMF (International Monetary Fund). 2022e. St. Lucia: 2022 Article IV Consultation-Press Release; Staff Report; and Statement by the Executive Director for St. Lucia. https://www.imf.org/en/Publications/CR/Issues/2022/11/18/St-Lucia-2022-Article-IV-Consultation-Press-Release-Staff-Report-and-Statement-by-the-525789.10.5089/9798400203886.002Search in Google Scholar
IMF (International Monetary Fund). 2022f. El Salvador: 2021. Article IV Consultation-Press Release; Staff Report; and Statement by the Executive Director for El Salvador. https://www.imf.org/en/Publications/CR/Issues/2022/01/26/El-Salvador-2021-Article-IV-Consultation-Press-Release-Staff-Report-and-Statement-by-the-512245.10.5089/9798400200151.002Search in Google Scholar
IMF (International Monetary Fund). 2023. “World Economic Outlook April 2023.” In A Rocky Recovery. https://www.imf.org/en/Publications/WEO/Issues/2023/04/11/world-economic-outlook-april-2023.Search in Google Scholar
IMF (International Monetary Fund). 2021b. “Honduras: Fourth Reviews under the Stand-By Arrangement and the Arrangement under the Standby Credit Facility.” In Requests for Augmentation of Access, Extension and Rephasing of the Arrangements, and Waivers of Nonobservance of Performance Criteria-Press Release; Staff Report. https://www.imf.org/en/Publications/CR/Issues/2021/09/14/Honduras-Fourth-Reviews-Under-the-Stand-by-Arrangement-and-the-Arrangement-Under-the-465812.10.5089/9781513596105.002Search in Google Scholar
Izquierdo, A., R. Lama, J. P. Medina, J. Puig, D. Riera-Crichton, C. A. Végh Gramont, and G. J. Vuletin. 2019. “Is the Public Investment Multiplier Higher in Developing Countries?” An Empirical Exploration. https://www.imf.org/en/Publications/WP/Issues/2019/12/20/Is-the-Public-Investment-Multiplier-Higher-in-Developing-Countries-An-Empirical-Exploration-48836.10.3386/w26478Search in Google Scholar
Kahn, M. E., D. Vega-Lira, J. Ramirez-Villegas, H. Achicanoy, I. Madurga-Lopez, T. Dutta Gupta, B. Carneiro, G. Resce, G. Ruscica, and G. Pacillo. 2019. “Long-term Macroeconomic Effects of Climate Change: A Cross-Country Analysis.” In NBER Working Papers, No. 26167. National Bureau of Economic Research (NBER).10.5089/9781513514598.001Search in Google Scholar
Läderach, P., V. Kommerell, F. Schapendonk, J. Van Loon, D. Martinez-Baron, A. Castellanos, C. E. Gonzalez et al.. 2021. Climate Security in the Dry Corridor of Latin America, Position Paper No. 2021/2. CGIAR FOCUS Climate Security.Search in Google Scholar
Linke, A., S. Leutert, J. Busby, M. Duque, M. Shawcroft, and S. Brewer. 2023. “Dry Growing Seasons Predicted Central American Migration to the US from 2012 to 2018”. Scientific Reports 13 (1): 18400, https://doi.org/10.1038/s41598-023-43668-9.Search in Google Scholar
NGFS (Networking for Greening the Financial System). 2021. NGFS Climate Scenarios for Central Banks and Supervisors. Networking for Greening the Financial System. https://www.ngfs.net/en/ngfs-climate-scenarios-central-banks-and-supervisors-june-2021.Search in Google Scholar
OECD; Economic Commission for Latin America and the Caribbean; Inter-American Development Bank; Inter-American Center of Tax Administrations. 2024. Revenue Statistics in Latin America and the Caribbean 2024. Paris: OECD Publishing.Search in Google Scholar
Pathak, A., F. A. Akiwumi, and K. C. Lindeman. 2021. “Impacts of Climate Change on the Tourism Sector of a Small Island Developing State: A Case Study for the Bahamas.” Environmental Development 37. https://doi.org/10.1016/j.envdev.2020.100556.Search in Google Scholar
Ranasinghe, R., A. C. Ruane, R. Vautard, N. Arnell, E. Coppola, F. A. Cruz, S. Dessai et al.. 2021. “Climate Change Information for Regional Impact and for Risk Assessment.” In Climate Change 2021: The Physical Science Basis. Contribution of Working Group I to the Sixth Assessment Report of the Intergovernmental Panel on Climate Change, edited by V. Masson-Delmotte, P. Zhai, A. Pirani, S. L. Connors, C. Péan, S. Berger, N. Caud et al.., 1767–926. Cambridge: Cambridge University Press.Search in Google Scholar
Romanello, M., A. McGushin, C. Di Napoli, P. Drummond, N. Hughes, L. Jamart, and H. Kennard et al.. 2021. “The 2021 Report of the Lancet Countdown on Health and Climate Change.” Lancet 398 (10311): 1619–62, https://doi.org/10.1016/S0140-6736(21)01787-6.Search in Google Scholar
Rozenberg, J. y., M. Fay. 2019. “Beyond the Gap: How Countries Can Afford the Infrastructure They Need while Protecting the Planet.” In Sustainable Infrastructure Series. Washington: World Bank.10.1596/978-1-4648-1363-4Search in Google Scholar
Swiss Re Institute. 2021. The Economics of Climate Change: No Action Not an Option. Zurich: Swiss Re Institute.Search in Google Scholar
The Coalition of Finance Ministers for Climate Action. 2023. Helsinki Principle 4: Mainstream Climate in Economic Policies. https://www.financeministersforclimate.org/mainstream.Search in Google Scholar
Titelman, D., M. Hanni, N. Perez Benitez, and J. Carpentier. 2023. “Keys to Climate Action.” In Chapter 10: Tackling Climate Change from an Investment-Led Development Perspective in Latin America and the Caribbean. https://www.brookings.edu/research/tackling-climate-change-from-an-investment-led-development-perspective-in-latin-america-and-the-caribbean/.Search in Google Scholar
Titelman, D., N. Pérez Benítez, M. Hanni, C. Pérez Verdía Canales, and M. Saade Hazin. 2022. Fiscal Impact Estimates of a Net-Zero Emissions Transition for Major Hydrocarbon Producers in Latin America and the Caribbean. https://www.bu.edu/gdp/2022/04/05/fiscal-impact-estimates-of-a-net-zero-emissions-transition-for-major-hydrocarbon-producers-in-latin-america-and-the-caribbean.Search in Google Scholar
United Nations. 2022. World Population Prospects 2022. New York.Search in Google Scholar
UNCTAD (United Nations Conference on Trade and Development). 2014. World Investment Report 2014 (E.14.II.D.1). Geneva.Search in Google Scholar
UNFCCC (United Nations Framework Convention on Climate Change). 2022. Dimensions and Examples of the Gender-Differentiated Impacts of Climate Change, the Role of Women as Agents of Change and Opportunities for Women (FCCC/SBI/2022/7). Available at https://unfccc.int/documents/494455.Search in Google Scholar
Van der Borght, R., J. Samaniego, L.M. Galindo, and J.E. Alatorre. 2023. “Los efectos del cambio climático en la actividad económica de América Latina y el Caribe: una perspectiva empírica.” In Project Documents (LC/TS.2023/83) (LC/TS.2023/83). Santiago: Economic Commission for Latin America and the Caribbean (ECLAC).Search in Google Scholar
WMO (World Meteorological Organization). 2022. State of the Climate in Latin America and the Caribbean 2021. https://library.wmo.int/doc_num.php?explnum_id=11270.Search in Google Scholar
© 2024 Walter de Gruyter GmbH, Berlin/Boston
Articles in the same Issue
- Frontmatter
- Policy Analysis
- An Analysis of the IMF’s International Carbon Price Floor
- India’s Energy and Fiscal Transition
- Macroeconomic and Fiscal Consequences of Climate Change in Latin America and the Caribbean
- Symposia_Articles
- Sovereign Debt and Climate Change in Argentina – The Catalytic Role of the IMF
- Climate Change Risks and Consequences on Growth and Debt-Sustainability in Africa
- Policy Analysis
- Gaps and Fiscal Adjustment for Debt Stability in Climate-Vulnerable Developing Countries: How Large and by How Much?