
Correlative study of peripheral ATP1A1 gene expression level to anxiety severity score on major depressive disorder patients
-
Jingjie Zhao
 ,
Jialin Qian
,
Jialin Qian

Abstract
Background:
Major depressive disorder (MDD) frequently co-occurs with other psychiatric problems. Our previous study showed that ATP1A1 gene expression level was significantly decreased in MDD patients. This research explores the potential correlations between the ATP1A1 expression level reduction and MDD patients’ clinical manifestation.
Methods:
All participant patients were diagnosed by Diagnostic and Statistical Manual of Mental Disorders – 4th edition (DSM-IV). Hamilton rating scale for depression (HAM-D) and anxiety (HAM-A) were applied to group patients into different categories. ATP1A1 expression level was measured by reverse transcript real-time polymerase chain reaction.
Results:
ATP1A1 expression levels of all MDD subgroups showed significant reduction compared to the control group (p<0.01). Further, the trend of ATP1A1 expression level reduction is significantly related to MDD patients’ HAM-A scores (p<0.01). However, there was no significance between ATP1A1 level and HAM-D scores (p>0.05).
Conclusions:
ATP1A1 expression level reduction is related to MDD anxiety score, which may be an explanation for the clinical manifestations and the underlining physiological mechanisms.
Introduction
Major depressive disorder (MDD) is a highly prevalent psychiatric disorder which is becoming an increasingly serious public health concern [1], [2]. Previous studies showed that MDD affects the central nervous system and thereafter affects multiple systems to cause both psychic and somatic symptoms [3], [4], [5]. Accordingly, gene expression levels in peripheral blood leukocytes will be affected and changed to reflect the changes in the central nervous system [4]. Currently, about 150 genes in peripheral blood leukocytes have been identified to demonstrate expression level differences in MDD patients [6]. Our previous study confirmed that the expression level of ATP1A1 gene, coding for Na+/K+ ATPase α1 subunit – the most abundant Na+/K+ ATPase subunit in cerebrum and cerebellum [7], in MDD patient peripheral blood showed a significant reduction compared to normal controls [8]. Na+/K+ ATPase is a membrane protein which plays a key role in the maintenance of ion homeostasis for regular neuronal excitability, secondary transport, and neurotransmitter uptake [9]. The α1 Na+/K+ ATPase possesses both pumping and signaling functions [10]. Its primary physiological role is the maintenance of cellular transmembrane sodium and potassium ion gradients necessary for the control of resting membrane potential [7]. In addition, the α1 Na+/K+ ATPase nucleotide binding domain is actively involved in cellular signal transduction and cell growth [10]. The inhibition of Na+/K+ ATPase activity decreased the uptake of norepinephrine [11], serotonin, and dopamine [12], and, therefore, altered neuronal firing [13]. On the other hand, Na+/K+ ATPase α subunit functional deficiency will interfere with the interaction and regulation of the cellular Src pathway, and therefore, inhibit ouabain-activated signal transduction and cause the depression-like symptoms [14], [15].
Major depressive disorder frequently co-occurs with other psychiatric problems. Among the MDD patient population, nearly 50% of lifetime MDD patients were reported to have, at least, one type of lifetime anxiety disorder [16]. Besides the general MDD diagnosis, additional clinical evaluation was performed to assess the comorbidity of MDD by using hamilton rating scale for depression (HAM-D) [17] and hamilton anxiety rating scale (HAM-A) [18]. Previous studies showed that there were three types of Na+/K+ ATPase α subunit isoforms expressed in the central nervous system encoded by the genes of ATP1A1, ATP1A2, and ATP1A3, respectively [7], [19]. The decreased expression level of ATP1A3 gene that codes for the α3 subunit isoform plays an important role in the MDD’s depression-like endophenotypes [15], while the ATP1A2 gene that codes for the α2 subunit isoform has a significant association with bipolar disorder and anxiety-related behavior [20], [21]. The expression level reduction of ATP1A1 gene that codes for α1 subunit isoform has also been proven to be involved in MDD [8]. However, the role of ATP1A1 in MDD endophenotypes (anxiety-like or depression-like) remains unclear. This study combines MDD patients’ clinical HAM-D and HAM-A evaluations with peripheral blood ATP1A1 expression levels to investigate the correlations between ATP1A1 gene expression level and MDD endophenotypes.
Materials and methods
Subject selection
All participants were from the Chinese Han ethnic group. A total of 40 drug-free MDD patients (25 females, 15 males, age 29–60 years) were included in the experimental group, while an additional 40 healthy subjects (25 females, 15 males, age 30–60 years) participated as the normal control. All subjects were recruited from the clinic of Beijing Friendship Hospital, Capital Medical University (Beijing, China) and were clinically screened to eliminate possible diseases of other systems. The MDD patients were diagnosed and enrolled into study group according to the criteria of Diagnostic and Statistical Manual of Mental Disorders – 4th edition (DSM-IV) (American Psychiatric Association) through “The Mini International Neuropsychiatric Interview” (MINI) structured clinical interview [22]. All research procedures were reviewed and approved by the Institutional Research Ethics Committee of Capital Medical University and a written informed consent statement was obtained from each participant.
The inclusion criteria for MDD patients were: (1) diagnosed by two well-trained senior psychiatrists in accordance with the DSM-IV criteria; (2) absence of evidence and history of any other systemic diseases; (3) medication-free for at least 2 weeks; (4) HAM-D 24 and/or HAM-A 17 scores (HAM-D≥20 and/or HAM-A≥14). For normal control subjects, the scores of HAM-D 24 and HAM-A 17 were <8 and 7, respectively.
Peripheral venous blood collection and total RNA extraction
Following 12 h fasting, 5 mL of peripheral venous blood was collected from both MDD patients and normal controls. The collected blood was stored in EDTA and was processed for total RNA extraction within 2 h of collection. Whole blood total RNAs were isolated by using PureLink® RNA Mini Kit (Life Technologies, Carlsbad, CA, USA) according to manufacturer’s instructions. The isolated total RNAs were subjected to the BioSpec-nano Spectrophotometer (Shimadzu, Kyoto, Japan) for quantization of optical density (OD) at OD260 and quality assessment at OD260/OD280 and OD260/OD230, respectively. In addition, 1% agarose gel electrophoresis was also used for total RNA quality control.
Reverse transcription and real-time PCR
Total RNAs were reverse transcribed into cDNAs by using PrimerScript™ RT Reagent Kit (Takara Bio Inc., Shiga, Japan) according to the manufacturer’s instructions. Briefly, the 10 μL reaction system was composed of 500 ng total RNA, 25 pmol Oligo dT primer, 50 pmol Random 6 mers, 2 μL of 5× PrimerSript buffer, 0.5 μL PrimerScript™ RT Enzyme Mix, and RNase free dH2O. The reaction was performed on S1000™ Thermal Cycler (BIO-RAD, Hercules, CA, USA) by the program of 37 °C for 15 min and 85 °C for 5 s.
Beacon Designer™ software (PREMIER Biosoft, Palo Alto, CA, USA) was applied to design the polymerase chain reaction (PCR) primers for ATP1A1 (target) and β-actin (control) genes according to GenBank nucleotide sequence records. The forward and reverse primers for ATP1A1 gene (Accession number: NM_000701) were GGTCCCAACGCCCTCACTC and ACCACACCCAGGTACAGATTATCG, respectively. The forward and reverse primers for β-actin gene (Accession number: NM_001101) were GGCGGCACCACCATGTACCCT and AGGGGCCGGACTCGTCATACT, respectively. The primer sequences of ATP1A1 gene were subjected to nucleotide BLAST investigation against GenBank “Human genomic” and “transcript” databases to ensure the specificity (i.e. no sequence overlapping with other Na+/K+ ATPase α subunit isoforms). The real-time PCR was performed by using Applied Biosystems 7500 Fast Real-Time PCR System (Life Technologies, Carlsbad, CA, USA) according to the manufacturer’s instruction. Briefly, the 25 μL reaction system was composed of 2 μL of diluted cDNA template, 12.5 μL SYBR® Green Real-Time PCR Master Mix (Life Technologies, Carlsbad, CA, USA), and 0.2 mmol/L of each primer. The reaction conditions were 95 °C for 20 s, followed by 40 cycles of 95 °C for 3 s, 60 °C for 30 s, and then 95 °C for 15 s, 60 °C for 1 min, 95 °C for 15 s, and 60 °C for 15 s. The amplified fragments were checked by running 1% agarose gel electrophoresis of the PCR products. A 10-fold dilution series of cDNA (10−3–10−10 times) for each target gene was applied as a standard to construct a relative standard curve and to determine the PCR efficiency that would be used in converting quantification cycle into relative quantity.
Data analysis
The real-time PCR data was processed and analyzed by using 7500 Fast Real-Time PCR System Sequence Detection Software (version 1.4) (Life Technologies, Carlsbad, CA, USA). The standard curve of each target gene and their amplification (Rn vs. Cycle) and dissociation curves were derived. The equations of each target gene amplification were then calculated for optimal experimental condition evaluation. The final absolute copy number of each target gene was calculated by using the formulation of target gene absolute copy numbers=sample concentration/sample molecular weight×6×10¹⁴ and then was converted to target gene relative copy numbers by using the formulation of target gene relative copy numbers=target gene absolute copy numbers/reference control gene absolute copy numbers. The data of both control and MDD groups were statistically assessed by using Microsoft Excel T-test program (Microsoft, Seattle, WA, USA). The comparative studies of ATP1A1 gene expression levels to MDD patients’ HAM-A and HAM-D scores were performed, respectively. Further, the correlative statistical analysis between ATP1A1 expression level and HAM-A score in all 40 patients’ samples was also performed by using Microsoft Excel CORREL program (Microsoft, Seattle, WA, USA).
Results
Demographics
The general information about MDD and normal control groups is listed in Table 1. There were no significant differences between the control and each patient groups regarding age (p>0.05). However, there were significant differences in both HAM-A and HAM-D scores between the normal control and the MDD patients (p<0.01) (Table 2). According to the clinical survey scores of HAM-A and HAM-D, the MDD patients were reorganized into HAM-A1 (HAM-A score≥15) and HAM-A2 (HAM-A score≤14) groups, and HAM-D1 (HAM-D score≥24) and HAM-D2 (HAM-D score≤23) groups in further (Table 2). Additional analysis of MDD group regarding HAM-A and HAM-D scores showed that there was a significant difference in HAM-A scores between HAM-A1 and HAM-A2 groups (p<0.01), but no significant difference in HAM-D scores between those two groups (p>0.05) was observed. The comparative of HAM-D1 and HAM-D2 groups showed a significant difference in HAM-D scores (p<0.01) and no significant difference in HAM-A scores (p>0.05) (Table 2).
General information of MDD and control groups.
| Groups | Sex | Age, years (range) | |
|---|---|---|---|
| Male | Female | ||
| Control (n=40) | 15 | 25 | 46.95±9.99 (30–60) |
| MDD (n=40) | 15 | 25 | 46.95±9.86 (29–60) |
HAM-A and HAM-D scores of MDD and control groups.
| Groups | HAM-A score (range) | HAM-D score (range) |
|---|---|---|
| Control (n=40) | 2.05±1.62 (0–6) | 2.56±1.92 (0–7) |
| MDD (n=40) | 20.05±11.34 (6–43) | 25.43±4.20 (20–34) |
| HAM-A1 (score≥15) (n=20) | 29.80±7.63 (15–43) | 24.30±3.87 (20–34) |
| HAM-A2 (score≤14) (n=20) | 10.30±2.95 (6–14) | 26.55±4.21 (20–34) |
| HAM-D1 (score≥24) (n=23) | 19.78±12.59 (6–43) | 28.22±3.37 (24–34) |
| HAM-D2 (score≤23) (n=17) | 20.41±9.36 (6–39) | 21.65±1.13 (20–23) |
Real-time PCR reactions of target and control genes
Both ATP1A1 and β-actin genes demonstrated satisfactory amplification and unique PCR product in each individual gradient reaction with a single sharp amplification peak and a smooth amplification curve. Both genes’ standard equations showed a linear relationship with R2-values larger than 0.99 and the slopes less than –3, which indicated the success of reactions for both genes’ amplifications.
Comparative study of ATP1A1 expression among control and MDD patient groups
The absolute and relative copy numbers of ATP1A1 and β-actin genes of each individual subject among the control and MDD groups were calculated. The distribution of ATP1A1 gene relative expression levels among control and MDD groups were shown in Figure 1. There was a significant difference on ATP1A1 expression level between control and whole MDD patient groups (p<0.01). Additional studies showed that the ATP1A1 gene expression levels of all MDD subgroups showed significant reduction compared to that of control group (p<0.01). Further, there was a significant difference in ATP1A1 gene expression level reduction between HAM-A1 and HAM-A2 groups (p<0.01). However, there was no significant difference in ATP1A1 gene expression level changes between HAM-D1 and HAM-D2 groups (p>0.05). In addition, the correlation statistical analysis between ATP1A1 and HAM-A scores of all 40 patients showed a weak negative correlation between two groups (–0.3234) (Figure 2A).
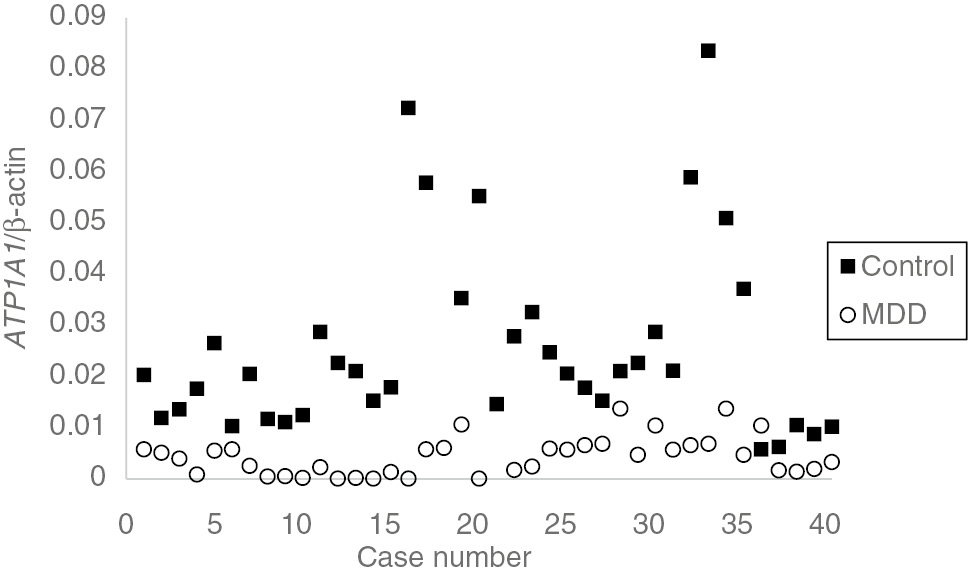
The distribution of ATP1A1 gene relative expression level among control and MDD groups.

The relations and trends (solid line) of ATP1A1 gene expression level changes among HAM-A (A) and HAM-D (B) groups.
Discussion
ATP1A1 is one of the three members of sodium/potassium pump (Na+/K+-ATPase) family genes expressed in brain, which maintains the sodium and potassium concentrations across the cellular membrane [23]. Past studies confirmed that α subunit isoforms of brain Na+/K+-ATPase are involved in different behavioral aspects, especially α2 and α3 subunits that were involved in human mental and behavioral disorders [15], [20], [24], [25]. However, there are not many studies that deal with the relationship between α1 subunit and MDD. Our previous study confirmed that ATP1A1 gene expression level demonstrated a significant reduction in clinically diagnosed MDD patients’ peripheral blood [8], which indicated that α1 subunit was also involved in a human mental disorder.
The results of this study provide an additional evidence that ATP1A1 expression level is closely related to MDD (Figure 1). Additional analysis between the clinical diagnostic criteria – HAM-A and HAM-D rating scales and ATP1A1 expression levels were performed in this study. The results showed that ATP1A1 expression level reduction is positively correlated to MDD patients’ clinical anxiety score level with a significant difference between the two-scaled HAM-A groups (p<0.01) (Figure 2A). However, there was no significant difference observed in HAM-D groups (p>0.05) (Figure 2B). Past studies also confirmed that ATP1A1 regulated sodium and potassium homeostasis in pyramidal cells and, therefore, contributed to the generation of resting membrane potential locally [23]. In addition, Na+/K+-ATPase regulates the formation of a cohesive neuroepithelium and the restriction of neuroepithelial permeability [26]. Reduction of ATP1A1 expression level in brain neuronal cells may cause an increase of intracellular Na+ concentration by reducing the pumping capability of sodium from inside of cell to the outside, and increasing the intracellular potassium concentration [27]. The overall effects may elevate the resting potential level of neuronal cell inner membrane, and, therefore, facilitate the generation of neuronal action potentials with a relatively reduced threshold level and lesser stimulation strength than in a normal neuron. An MDD patient with anxiety is more easily irritated by external environment alternation. Even a slight or mild change of the environment may cause the anxious reactions and symptoms. In other words, such patients are sensitive to external environmental stimulation and generate the neuronal innervated symptoms accordingly. In conclusion, the results of this study, that the ATP1A1 expression level reduction is related to MDD anxiety score, may explain these clinical manifestations and the underlining physiological mechanisms.
Author contributions: All authors have accepted responsibility for the entire content of this submitted manuscript and approved submission.
Research funding: This work was supported by the National Natural Science Foundation of China (grant no. 81450029) and the Beijing Science and Technology Project of Traditional Chinese Medicine (grant no. JJ2012-32).
Employment or leadership: None declared.
Honorarium: None declared.
Competing interests: The funding organization(s) played no role in the study design; in the collection, analysis, and interpretation of data; in the writing of the report; or in the decision to submit the report for publication.
References
1. Kraft JB, Slager SL, McGrath PJ, Hamilton SP. Sequence analysis of the serotonin transporter and associations with antidepressant response. Biol Psychiatry 2005;58:374–81.10.1016/j.biopsych.2005.04.048Search in Google Scholar PubMed
2. Polanczyk GV, Salum GA, Sugaya LS, Caye A, Rohde LA. Annual research review: a meta-analysis of the worldwide prevalence of mental disorders in children and adolescents. J Child Psychol Psychiatry 2015;56:345–65.10.1111/jcpp.12381Search in Google Scholar PubMed
3. McIntyre RS, Soczynska JK, Konarski JZ, Woldeyohannes HO, Law CW, Miranda A, et al. Should depressive syndromes be reclassified as “Metabolic Syndrome Type II”?. Ann Clin Psychiatry 2007;19:257–64.10.1080/10401230701653377Search in Google Scholar PubMed
4. Iga J, Ueno S, Ohmori T. Molecular assessment of depression from mRNAs in the peripheral leukocytes. Ann Med 2008;40:336–42.10.1080/07853890802082088Search in Google Scholar PubMed
5. Teyssier JR, Chauvet-Gelinier JC, Ragot S, Bonin B. Up-regulation of leucocytes genes implicated in telomere dysfunction and cellular senescence correlates with depression and anxiety severity scores. PLoS One 2012;7:e49677.10.1371/journal.pone.0049677Search in Google Scholar PubMed PubMed Central
6. Yi Z, Li Z, Yu S, Yuan C, Hong W, Wang Z, et al. Blood-based gene expression profiles models for classification of subsyndromal symptomatic depression and major depressive disorder. PLoS One 2012;7:e31283.10.1371/journal.pone.0031283Search in Google Scholar PubMed PubMed Central
7. Horisberger JD, Geering K. Brain Na, K-ATPase. Reference Module in Biomedical Sciences: Encyclopedia of Neuroscience. 2009; 395–9. doi:10.1016/B978-008045046-9.01737-X.Search in Google Scholar
8. Li L, Wu HJ, Qian JL, Li MZ, Li Y, Li BM, et al. Decreased Na+/K+ ATPase α1 (ATP1A1) gene expression in major depression patients’ peripheral blood. Cent Eur J Biol 2013;8:1077–82.10.2478/s11535-013-0207-8Search in Google Scholar
9. Scherer EB, Loureiro SO, Vuaden FC, Schmitz F, Kolling J, Siebert C, et al. Mild hyperhomocysteinemia reduces the activity and immunocontent, but does not alter the gene expression, of catalytic α subunits of cerebral Na+, K+-ATPase. Mol Cell Biochem 2013;378:91–7.10.1007/s11010-013-1598-6Search in Google Scholar PubMed
10. Lai F, Madan N, Ye Q, Duan Q, Li Z, Wang S, et al. Identification of a mutant α1 Na/K-ATPase that pumps but is defective in signal transduction. J Biol Chem 2013;288:13295–304.10.1074/jbc.M113.467381Search in Google Scholar PubMed PubMed Central
11. Vatta M, Peña C, Fernández BE, Rodríguez de Lores Arnaiz G. Endobain E, a brain Na+, K+ -ATPase inhibitor, decreases norepinephrine uptake in rat hypothalamus. Life Sci 2004;76:359–65.10.1016/j.lfs.2004.09.004Search in Google Scholar PubMed
12. Steffens M, Feuerstein TJ. Receptor-independent depression of DA and 5-HT uptake by cannabinoids in rat neocortex – involvement of Na+/K+-ATPase. Neurochem Int 2004;44:529–38.10.1016/j.neuint.2003.08.009Search in Google Scholar PubMed
13. Vaillend C, Mason SE, Cuttle MF, Alger BE. Mechanisms of neuronal hyperexcitability caused by partial inhibition of Na+-K+-ATPases in the rat CA1 hippocampal region. J Neurophysiol 2002;88:2963–78.10.1152/jn.00244.2002Search in Google Scholar PubMed
14. Goldstein I, Levy T, Galili D, Ovadia H, Yirmiya R, Rosen H, et al. Involvement of Na(+), K(+)-ATPase and endogenous digitalis-like compounds in depressive disorders. Biol Psychiatry 2006;60:491–9.10.1016/j.biopsych.2005.12.021Search in Google Scholar PubMed
15. Kirshenbaum GS, Saltzman K, Rose B, Petersen J, Vilsen B, Roder JC. Decreased neuronal Na+, K+ -ATPase activity in Atp1a3 heterozygous mice increases susceptibility to depression-like endophenotypes by chronic variable stress. Genes Brain Behav 2011;10:542–50.10.1111/j.1601-183X.2011.00691.xSearch in Google Scholar PubMed
16. Kessler RC, Sampson NA, Berglund P, Gruber MJ, Al-Hamzawi A, Andrade L, et al. Anxious and non-anxious major depressive disorder in the World Health Organization World Mental Health Surveys. Epidemiol Psychiatr Sci 2015;27:1–17.10.1017/S2045796015000189Search in Google Scholar PubMed PubMed Central
17. Hamilton M. Rating depressive patients. J Clin Psychiatry 1980;41:21–24.Search in Google Scholar
18. Hamilton M. The assessment of anxiety states by rating. Br J Med Psychol 1959;32:50–5.10.1111/j.2044-8341.1959.tb00467.xSearch in Google Scholar PubMed
19. Shamraj OI, Lingrel JB. A putative fourth Na+, K+-ATPase alpha-subunit gene is expressed in testis. Proc Natl Acad Sci USA 1994;91:12952–6.10.1073/pnas.91.26.12952Search in Google Scholar PubMed PubMed Central
20. Goldstein I, Lerer E, Laiba E, Mallet J, Mujaheed M, Laurent C, et al. Association between sodium- and potassium-activated adenosine triphosphatase alpha isoforms and bipolar disorders. Biol Psychiatry 2009;65:985–91.10.1016/j.biopsych.2008.10.033Search in Google Scholar PubMed
21. Moseley AE, Williams MT, Schaefer TL, Bohanan CS, Neumann JC, Behbehani MM, et al. Deficiency in Na, K-ATPase alpha isoform genes alters spatial learning, motor activity, and anxiety in mice. J Neurosci 2007;27:616–26.10.1523/JNEUROSCI.4464-06.2007Search in Google Scholar PubMed PubMed Central
22. Sheehan DV, Lecrubier Y, Sheehan KH, Amorim P, Janavs J, Weiller E, et al. The Mini-International Neuropsychiatric Interview (M.I.N.I.): the development and validation of a structured diagnostic psychiatric interview for DSM-IV and ICD-10. J Clin Psychiatry 1998;59:22–33.10.1037/t18597-000Search in Google Scholar
23. Richards KS, Bommert K, Szabo G, Miles R. Differential expression of Na+/K+-ATPase alpha-subunits in mouse hippocampal interneurons and pyramidal cells. J Physiol 2007;585:491–505.10.1113/jphysiol.2007.144733Search in Google Scholar PubMed PubMed Central
24. Lingrel JB, Williams MT, Vorhees CV, Moseley AE. Na, K-ATPase and the role of alpha isoforms in behavior. J Bioenerg Biomembr 2007;39:385–9.10.1007/s10863-007-9107-9Search in Google Scholar PubMed
25. Tochigi M, Iwamoto K, Bundo M, Sasaki T, Kato N, Kato T. Gene expression profiling of major depression and suicide in the prefrontal cortex of postmortem brains. Neurosci Res 2008;60:184–91.10.1016/j.neures.2007.10.010Search in Google Scholar PubMed
26. Chang JT, Lowery LA, Sive H. Multiple roles for the Na, K-ATPase subunits, Atp1a1 and Fxyd1, during brain ventricle development. Dev Biol 2012;368:312–22.10.1016/j.ydbio.2012.05.034Search in Google Scholar PubMed PubMed Central
27. Li B, Hertz L, Peng L. Cell-specific mRNA alterations in Na+, K+-ATPase α and β isoforms and FXYD in mice treated chronically with carbamazepine, an anti-bipolar drug. Neurochem Res 2013;38:834–41.10.1007/s11064-013-0986-3Search in Google Scholar PubMed
©2016 Walter de Gruyter GmbH, Berlin/Boston
Articles in the same Issue
- Frontmatter
- Behavior and Neuroprotection
- Analgesic properties of aqueous leaf extract of Haematostaphis barteri: involvement of ATP-sensitive potassium channels, adrenergic, opioidergic, muscarinic, adenosinergic and serotoninergic pathways
- Correlative study of peripheral ATP1A1 gene expression level to anxiety severity score on major depressive disorder patients
- Comparison of fluoxetine and 1-methyl-L-tryptophan in treatment of depression-like illness in Bacillus Calmette-Guerin-induced inflammatory model of depression in mice
- Reproduction
- Tobacco smoke exposure induces irreversible alteration of testicular function in prepubertal rats
- Oxidative Stress
- α-Lipoic acid attenuates transplacental nicotine-induced germ cell and oxidative DNA damage in adult mice
- Effects of nicotine in the presence and absence of vitamin E on morphology, viability and osteogenic gene expression in MG-63 osteoblast-like cells
- Metabolism
- Age-dependent features of CYP3A, CYP2C, and CYP2E1 functioning at metabolic syndrome
- Exercise increases the level of plasma orexin A in humans
- Inflammation
- Drug combinations in diabetic neuropathic pain: an experimental validation
- Pharmacokinetics of ceftriaxone in patients undergoing continuous renal replacement therapy
- Hematology
- Phenotypic homogeneity with minor deviance in osmotic fragility of Sahel goat erythrocytes in non-ionic sucrose media during various physiologic states
- Protection against arsenic-induced hematological and hepatic anomalies by supplementation of vitamin C and vitamin E in adult male rats
- One more health benefit of blood donation: reduces acute-phase reactants, oxidants and increases antioxidant capacity
- Phytotherapy
- Antithrombotic and cytotoxic activities of four Bangladeshi plants and PASS prediction of their isolated compounds