Evaluation and homogenization of a marine gravity database from shipborne and satellite altimetry-derived gravity data over the coastal region of Nigeria
-
Michael Bako

 and
Jürgen Kusche
and
Jürgen Kusche

Abstract
Accurate geoid modelling in marine areas requires the integration of gravity data from multiple sources including shipborne gravity measurements, global geopotential models, and satellite altimetry-derived gravity data. This study aims to develop homogenized gravity data for the coastal region of Nigeria to improve geoid modelling accuracy. Residual linear drifts in the shipborne gravity dataset from the Bureau Gravimétrique International (BGI) were corrected using crossover adjustments for each survey leg. We eliminated gross errors for each survey leg by using the 2-sigma method. Outliers in the historical shipborne gravity data were identified and removed using the leave-one-out cross-validation technique, resulting in a refined shipborne gravity dataset. The refined shipborne data were compared with the gravity data predicted by DTU21GRA, SSv29.1, SGG-UGM-2, XGM2019e_2159, GECO, EIGEN-6C4, and EGM2008. Our findings show that DTU21GRA outperformed the other models in the same region when compared with shipborne gravity data. The refined shipborne gravity data were merged with the DTU21GRA data using Least-Squares Collocation (LSC) to create a combined gravity dataset. The results of comparison between the complete refined shipborne gravity data and DTU21GRA before and after the integration process, shows that both the mean offset and the SD values decreased from 0.43 to −0.02 mGal and 3.14 to 2.69 mGal, respectively, which reveal an improvement in the final combined data. The geoid model constructed using the combined gravity data before and after the integration process showed an improvement in the SD values, decreasing from 0.023 m to 0.016 m when evaluated against the CNES-CLS22 MDT.
1 Introduction
Precise marine gravity measurements are essential for determining marine geoids and high-resolution mean dynamic topography (MDT), connecting offshore and land height systems and marine geological structures, identifying the distribution of mineral resources, and conducting gas and petroleum exploration [1], 2].
Nigeria does not have officially accepted geoid model [3]. Consequently, geodetic scientists in Nigeria face challenges in converting ellipsoidal heights obtained from Global Navigation Satellite System (GNSS) observations to their orthometric equivalents. This limitation leads to heavy reliance on spirit-level observations, especially for engineering projects. However, spirit levelling can be difficult and time-consuming, particularly over large and rugged terrains or coastal regions [4], 5]. The GNSS technology can simplify the determination of orthometric measurements if a well-known and accurate geoid model is accessible.
The lack of an official geoid model in Nigeria leads to other problems, such as difficulty in connecting land and sea datum, assessing sea level rise, and implementing infrastructure projects. This results in incompatible height systems in mountainous or flat areas, causing complications for engineers, who require orthometric heights referenced to the geoid. It is important to create a marine gravity database for computing a geoid model for Nigeria.
Currently, there is no official gravity database available for Nigeria. Efforts have been made to develop a gravimetric geoid model for Nigeria using airborne and shipborne gravity data from the Bureau Gravimétrique International [6] database and local Digital Terrain Models (DTMs) [7]. However, the developed geoid model does not include gravity data derived from altimetry in its computations. With the introduction of new gravity data, such as marine gravity data calculated from the altimetry-based Technical University of Denmark (DTU) 21 Mean Sea Surface (MSS) [8], hereafter referred to as the DTU21 Gravity (GRA) [9], it is crucial to revisit the development of a geoid model for Nigeria to address these limitations.
Multiple data sources, including shipborne, airborne, and satellite-derived gravity data, are available for determining marine gravity fields. However, relying solely on a single data source may not provide an accurate and high-resolution representation of desired results [10]. To address this, it is essential to merge gravity datasets from various sources such as global geopotential models (GGMs), shipborne observations, and altimetry-derived gravity data. Combining satellite gravimetry observations with terrestrial data and other sources has led to the development of combined GGMs, such as the Satellite Gravity Gradiometer-Universal Geopotential Model (SGG-UGM-2), combined global gravity field model (XGM2019e_2159), and Earth Gravitational Model (EGM2008), which improves the medium-to-short wavelength characteristics of the gravity field ([11], [12], [13]).
Satellite altimetry missions have become instrumental in providing regional and global marine gravity data, offering high resolution and easy accessibility, particularly in regions with limited shipborne gravity data, such as the coastal regions of Nigeria. However, the precision of altimetry measurements is affected near coastlines and in shallow waters because of challenges such as inadequate tidal modelling, substantial sea surface variations, and interference from onshore reflectors [14].
Recent missions such as CryoSat-2 and Sentinel-3A/B have played a crucial role in enhancing the quality and accessibility of altimetry-derived gravity data. These missions employ synthetic aperture radar (SAR) altimeters, enabling precise sea surface height measurements up to a few kilometers near the coast. CryoSat-2, with its long repeat cycle, provides dense cross-track spacing, making it well-suited for deriving marine gravity data [15]. CryoSat-2 operates in different modes, including low-resolution mode (LRM), SAR mode, and SAR interferometry (SARIn) mode [16]. Sentinel-3A/B, which inherits the SAR altimeter technology from CryoSat-2, offers denser along-track measurements than conventional altimetry, including the LRM mode. As a result, SAR altimetry data achieve high accuracy levels, ranging from centimeters to decimeters, particularly near coastlines and lakes [17]. DTU13GRA [18], DTU15GRA [19], DTU17GRA [20], and DTU21GRA [9] utilized CryoSat-2 data, which operate in the LRM mode over the coastal region of Nigeria. However, these models did not incorporate SAR altimetry data. By contrast, DTU21GRA [9] integrated SAR altimeter measurements from Sentinel-3A/B over the coastal region of Nigeria to improve the quality of gravity data in the region. We anticipate the forthcoming availability of novel datasets characterized by unprecedented resolution facilitated by the recently launched Surface Waters and Ocean Topography (SWOT) altimeter mission.
Furthermore, no research has evaluated the accuracy of the altimetry gravity models DTU21GRA [9] and SSv29.1 [21] using shipborne gravity data in regional gravity field modelling over the coastal region of Nigeria. Therefore, the primary objective of this study was to assess the performance of altimetry-derived gravity models (DTU21GRA and SSv29.1) over the coastal region of Nigeria by comparing them with shipborne gravity data obtained from the BGI, originating from surveys conducted in the 1970s. This poses a challenge for analysis because of their limited information.
This study aimed to develop homogenized gravity data for geoid modelling in the coastal region of Nigeria. Section 2 outlines the different sources of the datasets used in this study. Section 3 describes the methodology used in the study. Section 4 presents and discusses the results. Finally, we summarize the findings and conclusions of the study in Section 5.
2 Datasets
The datasets used in this study were divided into five main categories: (1) altimetry-derived gravity data, (2) GGMs, (3) shipborne gravity data, (4) high-resolution digital terrain models, and (5) DTU21 MSS and Center National d’Etudes Spatiales (CNES-CLS22) MDT.
2.1 Altimetry derived-gravity data
In this study, we utilized marine satellite altimetry-derived gravity datasets, namely DTU21GRA [9] and SSv29.1 data [21], provided as grids with a 1-arc-minute resolution. EGM2008 [13] was employed as a reference field model to compute the DTU21GRA and SSv29.1. Among the DTU series models, DTU21GRA stands out for its focus on the near-coastal areas. Simultaneously, SSv29.1 distinguishes itself from other Sand well and Smith (SS) series models by incorporating two additional years of Sentinel-3A/B datasets in its computation. However, the critical difference between DTU21GRA and SSv29.1 lies in their choice of estimation algorithm. DTU21GRA incorporates residual sea surface heights (SSHs) into its estimation method [9] whereas SSv29.1 utilizes the residual slopes of the SSH obtained through mathematical differentiation of neighboring altimeter data [21].
The SSv29.1 gravity model can be downloaded from ftp://topex.ucsd.edu/pub/archive/grav/. The DTU21GRA gravity model was obtained from https://ftp.space.dtu.dk/pub/. The DTU21GRA, SSv29.1 gravity model and their differences are illustrated in Figure 1. The differences between DTU21GRA and SSv29.1 gravity values show a minimum, maximum, mean offset, and SD of −46.85, 79.93, 0.02 and 4.12 mGal, respectively. Larger differences were observed around coastal areas and islands, demonstrating the poor accuracy of satellite altimetry near coastal areas.
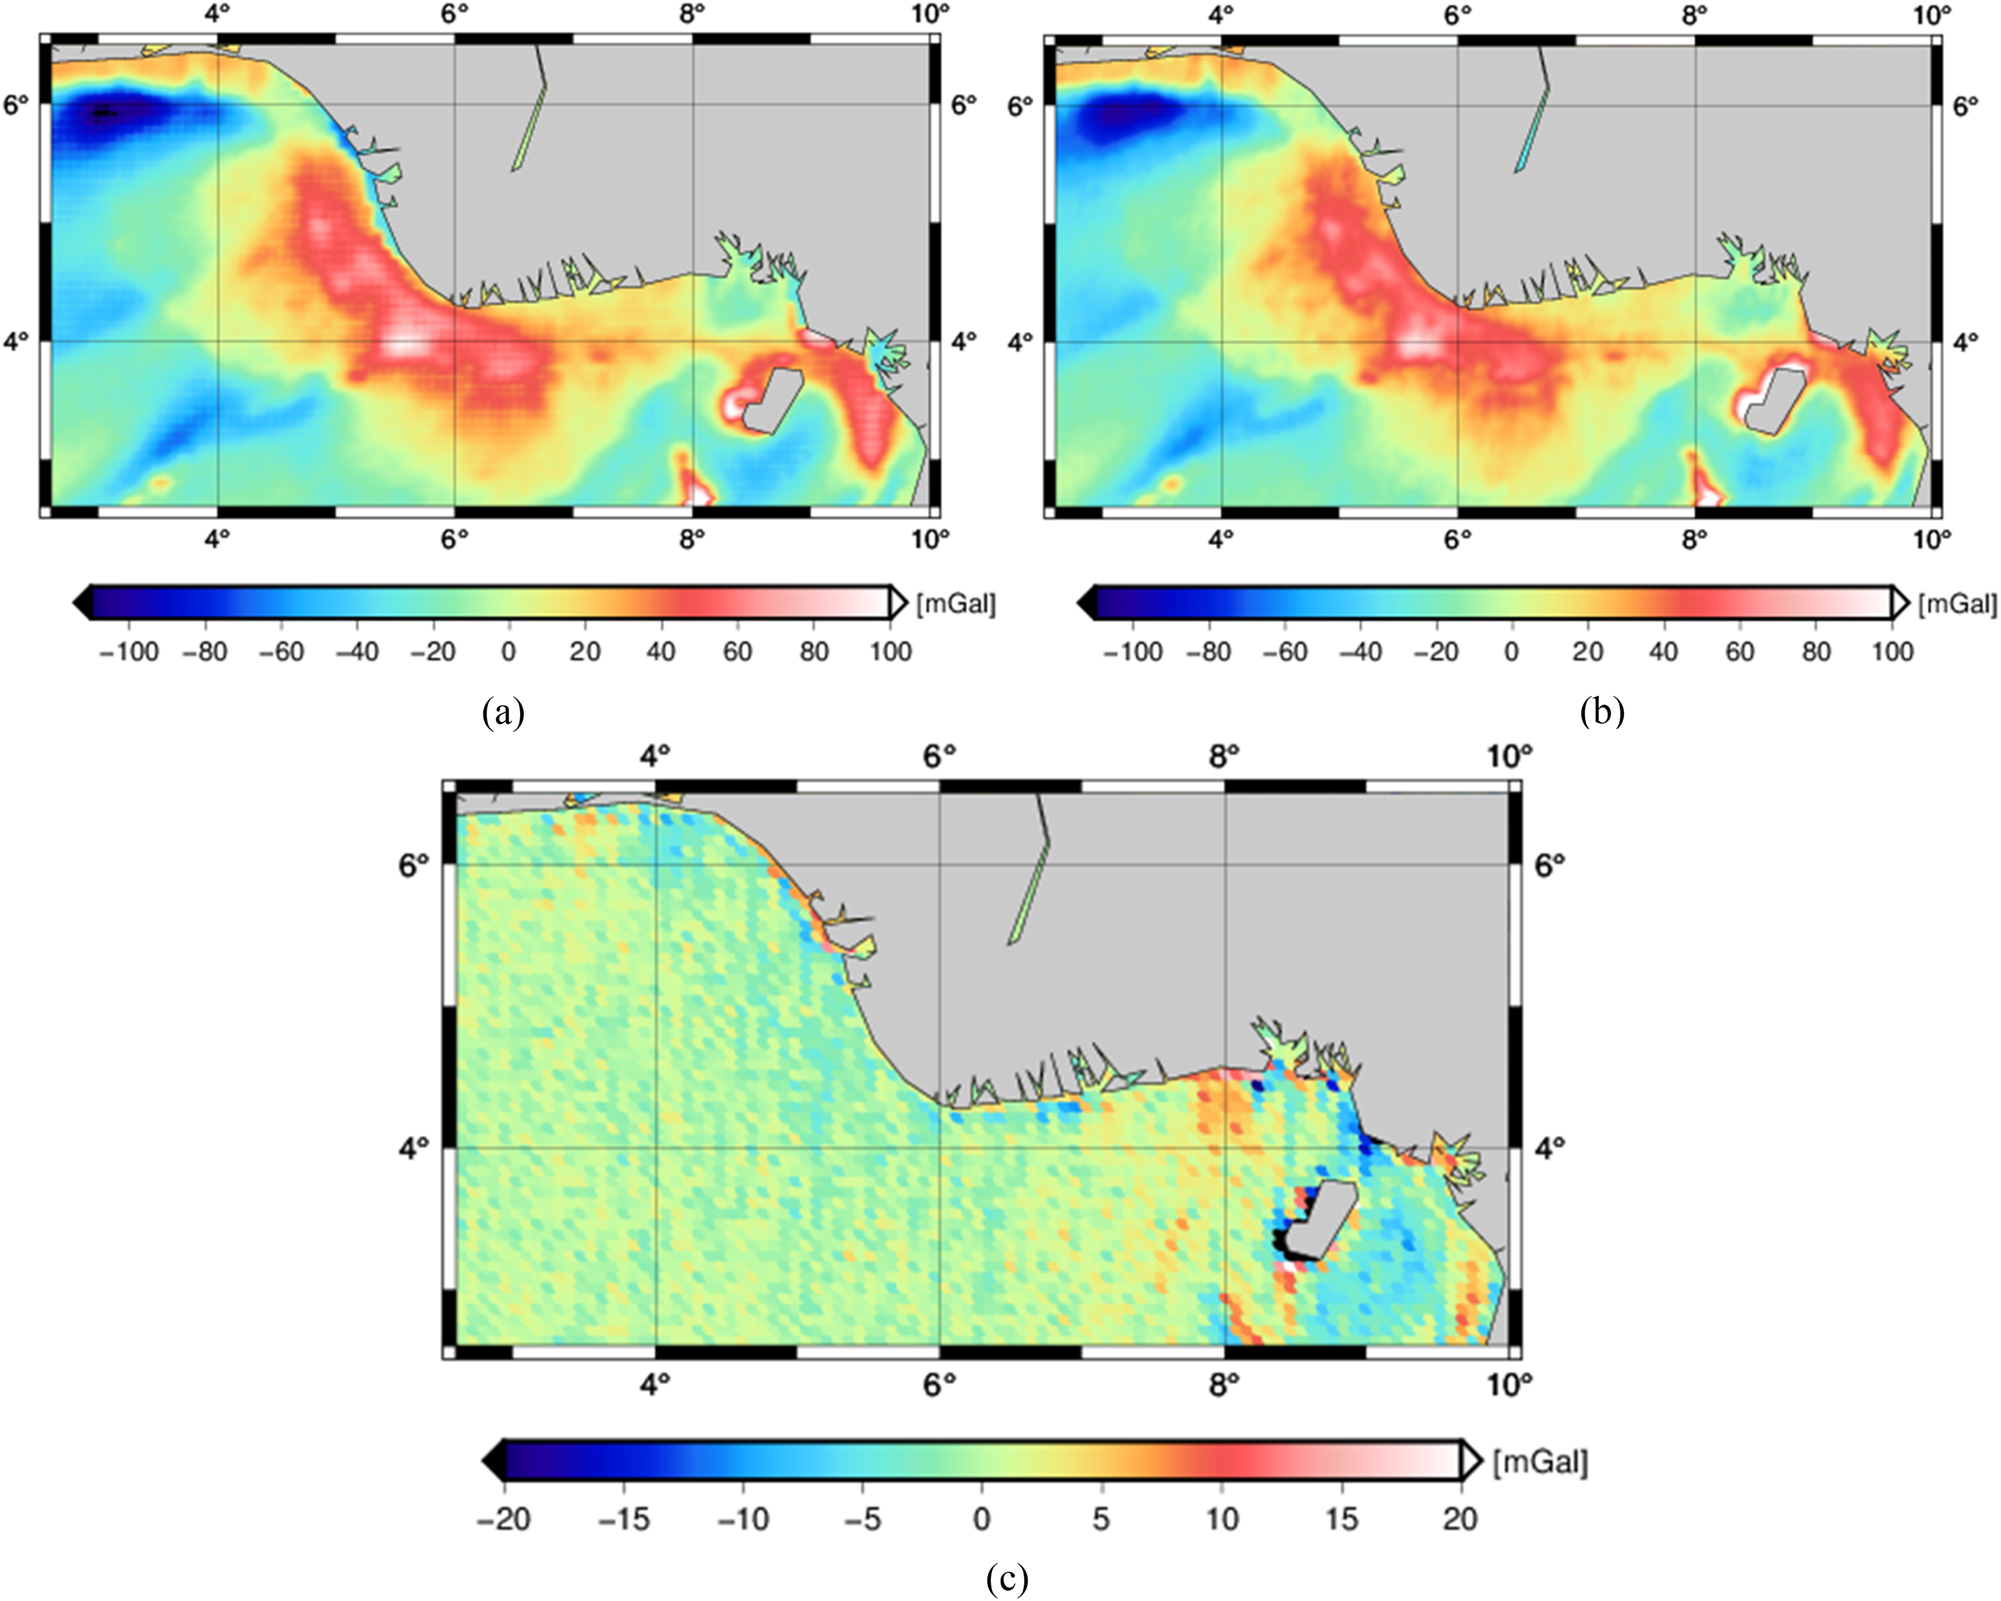
Free-air gravity anomalies from the DTU21GRA model (a) SSv29.1 model (b) and the differences between DTU21GRA and SSv29.1 gravity values (c) in the coastal region of Nigeria.
Characteristics of combined GGMs used in this study.
| Geopotential model | Data used | Maximum degree | Year | References |
|---|---|---|---|---|
| SGG-UGM-2 | S (GRACE, GOCE), EGM2008, A | 2,190 | 2020 | [11] |
| XGM2019e | S (GOCO06s), A, G, T | 2,190 | 2019 | [12] |
| GECO | S (GOCE), EGM2008 | 2,190 | 2016 | [23] |
| EIGEN-6C4 | S (GOCE, GRACE, LAGEOS), A, G | 2,190 | 2014 | [24] |
| EGM2008 | S (GRACE), A, G | 2,190 | 2008 | [13] |
2.2 Global geopotential models
The combined GGMs were generated by integrating satellite gravity measurements with terrestrial, airborne, shipborne gravity, and satellite altimetry observations. This integration results in a detailed gravity field with a refined spatial resolution. Five recently combined GGMs were used, as summarized in Table 1. These datasets were accessed using the International Center for Global Earth Models (ICGEM) Web Service [22]. The ICGEM calculation service was used to calculate free-air anomalies (FA) from the GGMs. The Geodetic Reference System 1980 (GRS80) ellipsoid was employed, and the zero-tide convention was consistently applied [22].
The dataset comprises five marine surveys conducted by different ships.
| S/N | 1 | 2 | 3 | 4 | 5 |
|---|---|---|---|---|---|
| Survey no | Survey 61021051 | Survey 61021332 | Survey 61021790 | Survey 65100022 | Survey 65100023 |
| Owners | Lamont doherty geological observatory | Lamont doherty geological observatory | Woods hole oceanographic institution | Ifremer | Ifremer |
| Vessel name | Robert D. Conrad | Vema | Atlantis II | Jean Charcot | Jean Charcot |
| Project | Cruise 13, leg 12 | Cruise 29, leg 07 | Cruise 75, leg 2 | Oceanographic cruises | Oceanographic cruises |
| No of data points | 306 | 382 | 688 | 249 | 837 |
| Chief scientist | R. Leyden | Dr. Philip Rabinowitz | Dr. K. O. Emery | Roland Schlich | Vincent Renard |
| Begin and end of legs dates | 02/9/1970 to 01/10/1970 | 21/05/1972 to 12/06/1972 | 10/02/1973 to 6/03/1973 | 04/09/1971 to 27/09/1971 | 19/07/1971 to 06/08/1971 |
| Departure port | Abidjan, Ivory coast | Luada, Angola | Dakar, Senegal | Abidjan | Luada, Angola |
| Arrival port | Mossamedes, Angola | Abidjan, Ivory coast | Terma, Ghana | Dakar | Dakar, Senegal |
| Instrument type | Continuous recording sea gravimeter | GRAF-ASKANIA GSS2-12 | Vibrating string accelerometer (VSA) sea gravimeter | Unknown | Unknown |
| Positioning system | US Navy satellite system (TRANSIT) | Satellite/sextant | Satellite navigation and a gyroscope | US Transit satellite positioning system | US Transit satellite positioning system |
| Reference | [6], 29] | [6], 29] | [30], 31] | [32], 33] | [34] |
The combined GGMs used were SGG-UGM-2 [11], GOCE and EGM2008 Combination model (GECO) [23] and European Improved Gravity models (EIGEN-6C4) [24]. The surface gravity data utilized in the computation of the above-mentioned GGMs were the same as those utilized in EGM2008 [13] for the terrestrial regions. Marine gravity data obtained through satellite altimetry were used to compute SGG-UGM-2 and GECO, whereas DTU10GRA [25] satellite altimetry gravity data contributed to the computation of EIGEN-6C4 over the coastal region of Nigeria [25]. XGM2019e_2159 [12] used terrestrial gravity anomaly data obtained from the United States (US) National Geospatial-Intelligence Agency (NGA) over Nigeria’s Land and DTU13GRA [13] satellite altimetry data and other datasets over the coastal region of Nigeria. Finally, in the computation of EGM2008 [13], the authors employed terrestrial gravity anomalies over land and altimetry-derived gravity anomalies from the Danish National Space Center (DNSC07) [26] along the coastal region of Nigeria. Table 1 lists the characteristics of the five combined GGMs used in this study.
In Table 1, S represents satellite-based data (e.g., Gravity Field and Steady-State Ocean Circulation Explorer (GOCE)) mission [27] Laser Geodynamics Satellite (LAGEOS), and Gravity Recovery and Climate Experiment (GRACE) data [28], G represents ground data (e.g., terrestrial, shipborne, and airborne measurements), A represents altimetry, and T represents topographic-based data [22].
2.3 Shipborne gravity data
This study utilized shipborne gravity data from the BGI. The dataset comprised five marine surveys conducted on different ships [6], as shown in Table 2.
These surveys collectively covered a large part of the study area in the coastal region of Nigeria, with longitudes ranging from 2.5° E to 10° E, and latitudes ranging from 2.5° N to 6.5° N. A total of 2,462 data points were collected, with shipborne gravity anomalies ranging from −84.40 mGal to 131.81 mGal and an average value of 15.17 mGal. Figure 2 illustrates the spatial distribution of the shipborne gravity data, and Figure 3 illustrates the different survey legs using different colors. The distribution of the shipborne gravity dataset in the study area was not homogeneous for geoid modelling research, with a significant data gap. To ensure the reliability of our analysis, we considered the possibility of residual errors in the shipborne gravity data used in this study arising from various sources, such as instrumental drifts, navigational errors, discrepancies in ties to harbor base stations, and inconsistent use of reference systems [29], 35]. In addition, the accuracy of shipborne data is highly dependent on the quality of ship navigation. Hence, it is essential to thoroughly evaluate the consistency of these data and identify any outliers before integrating them with selected altimetry-derived gravity data.

Distribution of the available shipborne gravity data within the coastal region of Nigeria.
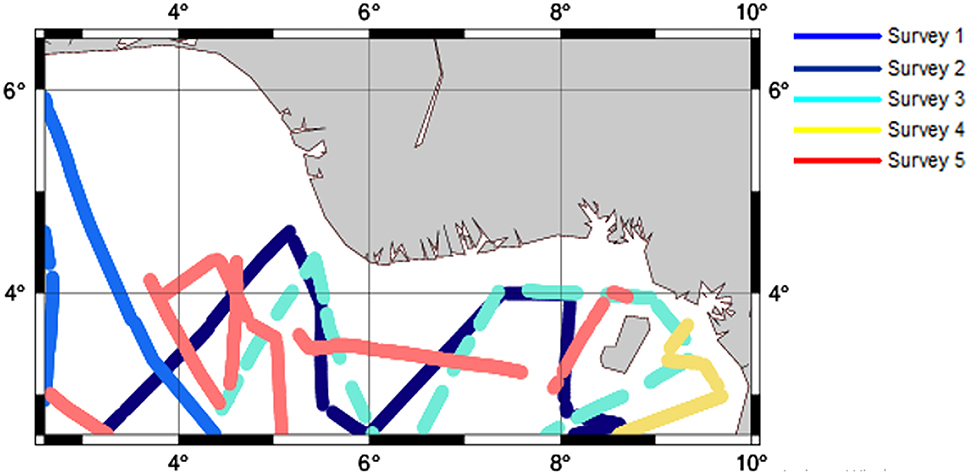
Geographical distribution of five surveys using different colours within the study area.
The cruises mentioned above (Table 2) were linked to the local network with absolute gravity points on land [36]. During the cruises, gravity data were collected using a GRAF-Askania GSS2-12, vibrating string accelerometer (VSA) sea gravimeter, and a continuous recording sea gravimeter, which were equipped with navigational instruments such as satellite/sextant, satellite navigation and gyroscope, and the US Transit satellite positioning system [29], 30], 32], 34].
It is important to highlight that there are other shipborne gravimetry campaigns performed in the coastal region of Nigeria by the United States Geological Survey (USGS) between July 22 and August 20, 1987, utilizing Lacoste Air-Sea gravimeter and Global Positioning System (GPS) technology in compliance with a request from the Defense Mapping Agency, encompassing the African coast, with the aim of augmenting gravity coverage in areas where it has been insufficient or inadequate. However, this dataset is not publicly accessible [37].
2.4 High-resolution terrain data
In this study, the General Bathymetric Chart of the Oceans (GEBCO) with a spatial resolution of 15 arcsec [38] was used to compute the topographic potential effect over the coastal region of Nigeria, which represents a very short-wavelength signal from the terrain data (Figure 4). A residual terrain model (RTM) [39] was computed using GEBCO data. The RTM computations within the ocean domain were executed using the TC toolbox in the GRAVSOFT package [40]. Given that bathymetry correction pertains to the disparities between ocean crust/sediment density and seawater density, we adopted a seawater density value of 1.028 g/cm3 and an ocean crust reference density of 2.9 g/cm3, resulting in a density difference of 1.872 g/cm3 [41]. We employed inner and outer integration radii of 10 km and 200 km, respectively. The RTM reduction utilizes two distinct bathymetry surfaces: a detailed surface and a reference surface over the data region. The effect of the detailed bathymetry surface was estimated from GEBCO 15 arc-second data [38]. A reference surface representing the mean elevation of the area was obtained by applying a suitable low-pass filter to the detailed surface. In our study, a smoothed grid of 5 min (a resolution corresponding to the gravity model SGG-UGM-2) was estimated from the detailed grid GEBCO 15 arc-seconds data, which we named GEBCO 5′ in this study [42]. The RTM results, utilizing the 1.872 g/cm3 density for the coastal region of Nigeria exhibit mean and SD of 0.46 mGal and 0.24 mGal respectively.

High-resolution GEBCO 15 arc seconds model over the coastal region of Nigeria.
2.5 DTU21 MSS and CNES-CLS22 MDT
This study used the DTU21MSS model [8] because it used five years of Sentinel-3A data and Sentinel-3B data for two years. Furthermore, the SAMOSA+ physical re-tracker, an advanced waveform re-tracker, was utilized for pre-processing CryoSat-2 data to compute DTU21MSS. The selection of the SAMOSA+ re-tracker over others, such as the MWaP re-tracker or empirical retrackers, is justified by its generally lower root-mean-square error (RMSE) [43]. For validation purposes, the CNES-CLS22 MDT [44] was chosen because it uses the latest Gravity Observation Combination (GOCO06s) geoid model [45], which is based on the comprehensive reprocessing of the entire GOCE mission [27] and 14 years of GRACE data [28]. This model also incorporated the new CNES-CLS 2022 MSS [46]. Overall, the precision analysis of the CNES-CLS22 MSS showed a 40 % improvement compared with the 2015 model [46]. Additionally, in computing the CNES-CLS22 MDT, drifter and high-frequency radar data were processed to retain only the geostrophic components [44]. The CNES-CLS22 MDT and DTU21 MSS datasets are shown in Figure 5.

DTU21MSS (left) and CNES-CLS22 MDT (right) over the coastal region of Nigeria.
3 Methods
This section outlines the research methodology used in this study. The objectives were: (i) accuracy assessment of shipborne and satellite altimetry-derived gravity data, (ii) comparison of refined shipborne and predicted gravity models, (iii) integration of refined shipborne and selected altimetry-derived gravity data, and (iv) the effect of geoid determination. Figure 6 provides an overview of our research methodology.

The framework of the research methodology.
3.1 Accuracy assessment of shipborne and altimetry-derived gravity data
In this section, we address the fact that the survey was conducted by different institutions (see Table 2) over various years, using different instruments. Consequently, linear drift and systematic bias must be corrected before validation. Additionally, these shipborne data contain several gross errors and outliers owing to varying measurement conditions. Therefore, it is necessary to eliminate these limitations based on preliminary evaluations using altimetry-derived gravity data (DTU21GRA and SSv29.1).
This assessment involves the adoption of a method similar to that outlined by Wessel and Watts [29], which addresses the inherent linear drifts within a shipborne gravity dataset by utilizing crossover (XO) points that commonly arise because of temporal variations in gravimeters, thereby introducing systematic errors in gravity measurements.
The conventional approach to mitigating this distortion involves connecting the gravimeter to the local network upon the conclusion of the cruise, followed by checking the differences between the meter readings and base station values. Any offset indicates potential linear drift.
To compute the drift error of a gravimeter utilizing XO points, the drift error was characterized as linear over time, and the drift factor was determined via a least-squares adjustment based on multiple XO points. A design matrix ‘A’ for the least-squares adjustment was formulated, where each row represents an XO point along with the measurement days and a constant term. The XO points between the track segments were calculated by computing the differences between consecutive gravity measurement points, and a linear interpolation was applied at the crossover points.
As previously discussed, it is necessary to remove the systematic bias in shipborne gravity measurements from the BGI before validation. This method involves editing these data by comparing them with altimetry-derived gravity data. We calculated the discrepancies between the altimetry-derived gravity data and shipborne gravity measurements using linear interpolation.
To mitigate this systematic error (mean offset), linear corrective models were applied to the residual [47] as expressed in Eq. (1). After eliminating linear drift and systematic bias, gross errors within each survey leg were identified and eliminated using rejection criteria. Specifically, data points showing residuals exceeding twice the average SD were identified as outliers and subsequently removed from the dataset.
The transformation models involve parameters related to the random noise term (vi), latitude (φi), and longitude (λi). The transformation parameters were ai = 0, 1, …, 2.
Finally, to ensure the reliability and accuracy of the remaining shipborne gravity data, we adopted a cross-validation (XV) approach, following the method described by Zaki et al. [48]. The XV method provides an unbiased statistical estimate of the error. This process involved excluding one observation at a time and utilizing each excluded point for validation. The remaining data were used for the interpolation. We used the 2-sigma approach as a rejection criterion, in which points exhibiting differences between the interpolated and observed values exceeding twice the SD of the residuals were removed as outliers. In this section, 436 data points were removed during the aforementioned process, representing 17.7 % of the entire dataset.
This study used the Kriging interpolation method for the XV technique because it is a widely employed interpolation method for detecting biased values [49].
3.2 Comparison of refined shipborne with predicted gravity models
The refined shipborne gravity measurements were compared with various estimated gravity models (DTU21GRA, SSv29.1, SGG-UGM-2, XGM2019e, GECO, EIGEN-6C4, and EGM2008) after eliminating the linear drift, systematic bias, and outliers. The discrepancies between the shipborne free-air anomaly (FA) and FA derived from various predicted gravity models were compared by interpolating the FA values from the various predicted gravity models into the positions of the shipborne FA measurements using linear interpolation. To identify the most suitable altimetry gravity model for integration, the model with the lowest SD and Root Mean Square (RMS) fit was selected.
3.3 Integrating the refined shipborne with DTU21GRA gravity data
This study focused on establishing a coherent gravity field covering the coastal region of Nigeria by integrating shipborne gravity data with selected altimetry-derived gravity data, primarily for geoid modelling purposes.
Following the refinement process of the shipborne marine gravity data, which entailed the removal of data points (as elaborated in Sections 3.2 and 4.2), we merged this refined shipborne gravity data with the selected altimetry-derived gravity data (DTU21GRA). The DTU21GRA 1′ × 1′ marine dataset was converted into point data, where each record at the grid node was treated as an individual data point, resulting in 3,371 records. The integration of refined shipborne data with the DTU21GRA [9] marine gravity anomaly grid was accomplished using the least squares collocation (LSC) technique, as reported by Kamto et al. [50], Zaki et al. [48], and El-Fiky [51]. At any arbitrary point P, the predicted value of the gravity anomaly, (S p ), is given by (2).
where C ll is the covariance matrix of the gravity measurements and C pl denotes the cross-covariance vector between the estimated signal and measurements L.
First, we computed the residuals between the refined shipborne gravity data and DTU21GRA model. Gridding of the resultant residuals was then performed using the LSC method and the second-order Gauss–Markov covariance model used in LSC Eq. (3). The residuals were gridded onto a 1 arc-minute resolution, with the same resolution as the DTU21GRA grid. Consequently, a second-order Gauss–Markov covariance model with a 30-km correlation length and a white noise of 1 mGal was applied during the LSC after testing over a range of 10–50 km and 1–5 mGal [52].
where C0 denotes the empirical covariance determined from the input data, α is the correlation length parameter, and S is the distance between the points under consideration. Finally, the grid of the residuals was added to the pre-gridded DTU21GRA [9] altimetry gravity anomaly values to obtain an enhanced altimetry dataset.
Validation was performed independently by examining the combined datasets at randomly selected scattered shipborne gravity stations, accounting for approximately 5 % of the data, which were not included in the LSC process. A total of 100 points were selected based on their geographical distributions in the northern, eastern, western, and southern regions of the study area. None of the 100 points selected for testing were considered outliers. This was because the test points were selected from the refined shipborne data and were not affected by outliers or gross errors.
3.4 The effect on geoid determinations over the coastal region of Nigeria
In this section, two gravimetric geoid models for the study area are generated: one uses refined shipborne data and the other uses the combined gravity dataset. The MDT was computed using the DTU21MSS model [8]. This was validated using CNES-CLS22 MDT [44]. The computed gravimetric geoid model adopted a methodology similar to that outlined by El-Fiky [51], and Moka et al. [7]. The approach for gravimetric geoid modelling is based on the Remove-Compute-Restore (RCR) technique, exemplified by Sanso and Sidera [53]; Hofmann-Wellnhof and Moritz [54], coupled with the RTM reduction method [39]. The RCR procedure was employed to compute the gravimetric geoid model for the coastal regions of Nigeria. Within this procedure, the components of the short and very short wavelengths of the functional of the disturbing potential were derived from the GGM and high-resolution GEBCO 15 arc seconds dataset [38], respectively. These effects were removed from shipborne gravity data and combined gravity data during the initial stage, resulting in residual gravity anomalies. Δg res (see Eq. (4))
where Δg FA represents the free-air shipborne gravity anomaly (both refined shipborne and combined gravity datasets), the long-to-short wavelength component of the gravity anomaly computed from GGMs is Δg GGM , and Δg RTM is the very short wavelength contribution of the gravity anomaly induced by local topography.
Before the marine geoid computation, the GGM was required as a reference model in the RCR procedures. Hence, selecting ideal GGMs is crucial for producing precise gravimetric geoid models. In this study, the SGG-UGM-2 [11] GGM at a spherical harmonic (SH) degree truncated up to degree and order (d/o) 360 was selected for the geoid computation to recover the long-to-short wavelength component of the gravity signal when modelling the gravimetric marine geoid, as it approximates the gravity field well over the coastal region of Nigeria (see Table 6 in Section 4.2).
The determination of the very short-wavelength component of the gravity signal is achieved through the RTM reduction method when using the shipborne free-air gravity anomaly for geoid determination. The gravimetric marine geoid model's computation involves integrating reference geoid heights from the GGM, residual geoid heights, and the very short-wavelength component of the geoid heights. This computational task was performed using the GRAVSOFT package [40].
4 Results and discussion
4.1 Accuracy assessment of shipborne and altimetry-derived gravity data
In this section, the results based on the method described in Section 3.1 were presented. Our analysis revealed that after the residual linear drifts inherent within the shipborne gravity dataset using crossover adjustment for each leg of the surveys were addressed, survey 1 demonstrated a noticeable drift of −0.185 mGal/day. Likewise, Surveys 2, 3, 4, and 5 exhibited drift behaviors, with drift rates recorded as −0.0082, −0.020, −0.028, and 0.070 mGal/day, respectively (see Figure 7).

Bar chart of estimated drift rate in mGal/day for each survey leg.
The statistical results of the differences between each survey leg and the altimetry-derived gravity data from the DTU21GRA [9] and SSv29.1 [21] models before and after addressing the residual linear drift and data editing are listed in Tables 3 and 4, respectively. The use of XO adjustment to address linear drift and data editing resulted in the subsequent elimination of linear drift, systematic errors (mean offset), and gross errors in each leg of the survey.
Preliminary shipborne gravity data evaluated with DTU21GRA and SSv29.1 gravity model before applying all the corrections; units [mGal].
| Gravity model | Survey no | No of data | Min. | Max. | Mean | SD | RMS |
|---|---|---|---|---|---|---|---|
| DTU21GRA | 1 | 306 | 3.75 | 27.84 | 14.16 | 3.54 | 14.59 |
| 2 | 382 | −6.27 | 5.50 | −1.54 | 1.89 | 2.44 | |
| 3 | 688 | 5.94 | 25.76 | 18.29 | 2.61 | 18.48 | |
| 4 | 249 | −5.79 | 10.89 | 2.33 | 3.001 | 3.79 | |
| 5 | 837 | −37.09 | 43.13 | 13.563 | 10.49 | 17.14 | |
| SSv29.1 | 1 | 308 | 3.47 | 28.75 | 13.92 | 3.64 | 14.39 |
| 2 | 382 | −9.57 | 5.59 | −1.51 | 2.07 | 2.56 | |
| 3 | 688 | 8.72 | 27.70 | 18.54 | 2.77 | 18.74 | |
| 4 | 249 | −6.27 | 14.83 | 4.40 | 3.67 | 5.72 | |
| 5 | 837 | −38.69 | 41.53 | 13.33 | 10.43 | 16.92 |
Shipborne gravity data evaluated with DTU21GRA and SSv29.1 gravity model after all the corrections were applied; units [mGal].
| Gravity model | Survey no | No of outlier | No remaining data | Min. | Max. | Mean | SD | RMS |
|---|---|---|---|---|---|---|---|---|
| DTU21GRA | 1 | 65 | 241 | −6.71 | 8.80 | −0.00 | 2.79 | 2.78 |
| 2 | 30 | 352 | −6.60 | 4.51 | −0.00 | 1.79 | 1.78 | |
| 3 | 31 | 657 | −7.09 | 6.95 | 0.00 | 2.37 | 2.37 | |
| 4 | 10 | 239 | −6.07 | 6.50 | 0.00 | 2.47 | 2.47 | |
| 5 | 222 | 615 | −9.84 | 9.71 | 1.58 | 4.40 | 4.67 | |
| SSv29.1 | 1 | 65 | 241 | −7.03 | 9.09 | 0.19 | 2.90 | 2.91 |
| 2 | 30 | 352 | −6.69 | 4.85 | −0.02 | 1.84 | 1.85 | |
| 3 | 31 | 656 | −9.03 | 8.13 | −0.27 | 2.69 | 2.70 | |
| 4 | 10 | 239 | −9.94 | 4.94 | −2.09 | 2.79 | 3.48 | |
| 5 | 222 | 615 | −11.20 | 11.56 | −1.83 | 4.32 | 4.68 |
The mean offsets identified in Surveys 1, 3, and 5, initially measured at 14.16, 18.29, and 13.56 mGal for both altimetry gravity models (Table 3), have been eliminated (Table 4).
The large offsets observed in surveys 1, 3, and 5 (Table 3) may be attributed to incorrect ties to the land gravity datum or different land gravity datum [29].
This removal of the mean offset led to a reduction in the RMS values across all surveys (Table 4). Notably, the RMS values for Surveys 1, 3, and 5, which were originally around 14.59 mGal, 18.48 mGal, and 17.14 mGal for both models, have dropped to approximately 2.78 mGal, 2.32 mGal, and 4.67 mGal, respectively. These findings demonstrate that by addressing linear drift using XO adjustment and data editing, even a fifty-year old shipborne dataset can be corrected to attain an accuracy within a few mGal, rendering it suitable for combination with modern satellite data. Through this process, 358 shipborne gravity measurement points were eliminated from five survey legs. The remaining shipborne gravity dataset after removing the outliers, consisting of 2,104 points, demonstrates a mean and SD of −2.33, and 27.81 mGal, respectively. Consequently, all marine ship surveys are deemed acceptable and can be used for the next stage of refinement of shipborne gravity data using the XV techniques. Seventy-eight (78) shipborne gravity points with residual values greater than twice the SD were identified as gross errors, and outliers were removed after the XV method was applied. Following the XV procedure, 2026 refined shipborne gravity remained. Table 5 summarizes the statistical analyses conducted on the shipborne gravity data.
Statistics of the shipborne gravity data before and after removing the gross errors and outliers; unit [mGal].
| Data type | No. of values | Min. | Max. | Mean | SD |
|---|---|---|---|---|---|
| Before cross-validation | 2,104 | −68.92 | 62.47 | −2.33 | 27.81 |
| Residuals | 2,104 | −17.38 | 11.19 | −0.02 | 0.98 |
| After cross-validation | 2,026 | −68.91 | 60.99 | −2.86 | 27.79 |
| Residuals | 2,026 | −13.63 | 8.75 | −0.01 | 0.78 |
4.2 Comparison of refined shipborne with predicted gravity models
The evaluation results for the refined shipborne and gravity models are listed in Table 6. Among the gravity models, the DTU21GRA [9] gravity model demonstrated better agreement in fitting the shipborne gravity data, with the least SD and RMS differences of 3.14 and 3.17 mGal, respectively. On the other hand, the EIGEN-6C4 [24] model produced the largest SD and RMS values of 4.50 and 4.51 mGal, respectively. The findings of this study highlight the consistency of altimetry-derived gravity data with existing refined shipborne gravity data in the coastal region of Nigeria, which is attributed to the use of new satellite data and advanced data-processing techniques. We found that DTU21GRA [9] outperformed other models in the same region when compared with shipborne data.
The differences between the refined shipborne dataset and the gravity models.
| Gravity model | Degree/resolution | Type | No of data | Min. | Max. | Mean | SD | RMS |
|---|---|---|---|---|---|---|---|---|
| DTU21 | 1 min | Altimetry | 2026 | −9.84 | 9.71 | 0.43 | 3.14 | 3.17 |
| SSv29.1 | 1 min | Altmetrey | 2026 | −11.20 | 11.56 | 0.22 | 3.39 | 3.39 |
| SGG-UGM-2 | 2,190 | GGM | 2026 | −12.11 | 12.56 | −0.04 | 3.69 | 3.69 |
| XGM2019e_2159 | 2,190 | GGM | 2026 | −19.61 | 15.20 | 0.17 | 4.24 | 4.35 |
| GECO | 2,190 | GGM | 2026 | −20.43 | 11.91 | −0.09 | 4.25 | 4.25 |
| EIGEN-6C4 | 2,190 | GGM | 2026 | −14.82 | 12.98 | −0.29 | 4.50 | 4.51 |
| EGM2008 | 2,190 | GGM | 2026 | −18.22 | 12.12 | −0.13 | 4.14 | 4.14 |
Consequently, DTU21GRA [9] was chosen as the preferred altimetry-derived gravity model for further integration with refined shipborne gravity data for two reasons: the low SD value of 3.14, and the algorithm used to obtain gravity data from altimetric observations, that is, sea surface height (SSH). DTU21GRA [9] is the only gravity model that integrates Sentinel-3A/B SAR altimeter measurements in the coastal region of Nigeria. Abdallah et al. [55] obtained similar findings for the Red Sea when shipborne gravity data were compared with satellite altimetry-derived gravity data (DTU21GRA and SS v29.1). Their analysis revealed that the DTU21GRA model outperformed the SS v29.1 model, with SD and RMS values of 7.37 mGal and 8.73 mGal, respectively. In this study, when we compared our results with those of Abdallah et al. [55], our results showed an improvement of approximately 57.4 % in terms of SD and RMS, which is attributed to the processing strategy applied to the shipborne gravity data in our research.
4.3 Integrating the refined shipborne with DTU21GRA gravity data
In this section, the results based on the method described in Section 3.3 are presented. The refined shipborne data were integrated into the DTU21GRA [9] marine gravity anomaly grid by using the LSC technique. This analysis utilized 1926 records obtained by excluding 78 outliers identified through XV procedures and 100 points reserved for validation from the original dataset of 2,104 refined shipborne gravity (Table 5 and Figure 9). The statistical results of these data before and after the integration process reflect an improvement gained by employing LSC, as shown in Table 7. Where the SD dropped from 30.83 mGal to 26.84 mGal.
Marine surface gravity data before and after applying LSC; units [mGal].
| Marine gravity data | No data points | Min. | Max. | Mean | SD |
|---|---|---|---|---|---|
| DTU21GRA gravity | 3,371 | −104.07 | 151.66 | −3.20 | 30.83 |
| Shipborne gravity | 1,926 | −68.92 | 60.99 | −2.89 | 27.72 |
| Combine dataset | 1 min | −114.82 | 152.3 | −1.96 | 26.84 |
The free-air gravity anomalies from DTU21GRA [9] and the combined dataset with their differences are illustrated in Figure 8. The results of their differences exhibit minimum, maximum, mean, and SD values of −10.46, 10.64, 0.35 mGal, and 1.11 mGal, respectively.
![Figure 8:
Free-air gravity anomalies from the DTU21GRA model (a) and combined gravity data (b) differences between the two models (c) along the coastal region of Nigeria: units [mGal].](/document/doi/10.1515/jag-2024-0059/asset/graphic/j_jag-2024-0059_fig_008.jpg)
Free-air gravity anomalies from the DTU21GRA model (a) and combined gravity data (b) differences between the two models (c) along the coastal region of Nigeria: units [mGal].
The comparison between the selected 100 shipborne observations (Figure 9) and the DTU21GRA [9] before and after the LSC procedures demonstrated an improvement in the fit, as shown in Table 8. The SD values drop from 2.91 to 2.24 mGal. On the other hand, Table 9 shows the comparison between the complete refined shipborne gravity data and DTU21GRA [9] before and after the integration process.
![Figure 9:
The distribution of 100 testing shipborne station units; [mGal].](/document/doi/10.1515/jag-2024-0059/asset/graphic/j_jag-2024-0059_fig_009.jpg)
The distribution of 100 testing shipborne station units; [mGal].
The differences between 100 randomly selected refined shipborne stations and combined gravity data over the coastal region of Nigeria; units [mGal].
| Integration | Min. | Max. | Mean | STD | RMS |
|---|---|---|---|---|---|
| Before | −6.17 | 9.27 | 0.17 | 2.91 | 2.90 |
| After | −8.96 | 6.72 | −0.05 | 2.24 | 2.25 |
The differences between the 2026 refined shipborne stations and combined gravity data over the coastal region of Nigeria; units [mGal].
| Integration | Min. | Max. | Mean | STD | RMS |
|---|---|---|---|---|---|
| Before | −9.84 | 9.70 | 0.43 | 3.14 | 3.17 |
| After | −8.96 | 8.59 | −0.02 | 2.69 | 2.69 |
Both the mean offset and the SD values decreased from 0.43 to −0.02 mGal and 3.14 to 2.69 mGal, respectively, which reveal an improvement in the final combined gravity data. This combination established a unified and consistent gravity field over the coastal region of Nigeria, ensuring the absence of data voids (Figure 8b).
4.4 The effect on geoid determinations over the coastal region of Nigeria
In this section, the results based on the method described in Section 3.4 are presented.
The marine geoid model computed using refined shipborne gravity data utilized the DTU21 MSS [8] to calculate the refined MDT. Similarly, the marine geoid model computed using the combined gravity datasets employed DTU21 MSS to calculate the combined MDT. Table 10 presents a comparison between the refined MDT and combined MDT against the CNES-CLS22 MDT [44]. Figure 10 illustrates the marine geoid computed using the combined dataset.
Validation of computed geoid model over the over the coastal region of Nigeria (away from the coastline and islands).
| Differences between CLS22 MDT and computed MDT | Min. (meter) | Max. (meter) | Mean (meter) | STD (meter) |
|---|---|---|---|---|
| CLS22MDT – refined MDT | 0.176 | 0.719 | 0.080 | 0.023 |
| CLS22MDT – combined MDT | 0.202 | 0.697 | 0.076 | 0.016 |

Gravimetric geoid model computed with combined gravity dataset. Contour interval: 1 m.
Both the mean offset and SD values decreased from 0.080 to 0.076 mGal and from 0.023 to 0.016 m, respectively, indicating an improvement in SD when evaluated against the CLS22 MDT [44].
These outcomes affirm the efficacy of incorporating recently published satellite altimeter-derived gravity data (DTU21GRA) into the regional geoid modelling process, which is particularly beneficial in island regions, as pointed out by Wu et al. [56]. Additionally, including Sentinel-3A/3 B Synthetic Aperture Radar (SAR) altimetry data in the computation of DTU21GRA [9] further augments regional accuracy, thereby contributing to the observed improvements.
5 Conclusions
We integrated shipborne gravity anomalies with an altimetry-based gravity dataset to create a consistent gravity field for the coastal region of Nigeria that can improve marine and coastal geoid estimations based on gravity measurements. We eliminated gross errors for each survey leg by using the 2-sigma method. Outliers in the historical shipborne gravity data were identified and removed using the leave-one-out cross-validation technique, resulting in a refined shipborne gravity dataset. The refined shipborne data were compared with the gravity data predicted by DTU21GRA, SSv29.1, SGG-UGM-2, XGM2019e_2159, GECO, EIGEN-6C4, and EGM2008. Our findings show that DTU21GRA outperformed the other models in the same region when compared with shipborne data. The refined shipborne data were merged with the DTU21GRA data using LSC to create a combined dataset. A comparison of these 100 shipborne observations with DTU21GRA, both before and after the LSC procedures, showed an improvement in fit. Moreover, the comparison between the complete refined shipborne gravity data and DTU21GRA before and after the integration process, shows that both the mean offset and the SD values decreased from 0.43 to −0.02 mGal and 3.14 to 2.69 mGal, respectively, which reveals an improvement in the final combined data.
Finally, the marine geoid model constructed using the combined gravity data before and after the integration process showed an improvement in SD values, decreasing from 0.023 m to 0.016 m when evaluated against the CLS22 MDT. The implications of this investigation emphasize the potential for improvement in geoid modelling accuracy across the coastal region of Nigeria by integrating the combined gravity datasets. This integration allows for a more detailed representation of the geoid within these domains and offers valuable insights into applications covering coastal and offshore operations. Based on the results of this study, we recommend a renewed shipborne survey for this region.
Acknowledgements
The authors express their gratitude to Ole Baltazar Andersen from the Technical University of Denmark and David Sandwell from the University of California, San Diego for providing the altimetry-derived gravity models used in this study. They also extend their appreciation to the BGI for supplying shipborne gravity data, and to the teams at the Wood Hole Oceanographic (WHO) and other institutions that carried out shipborne surveys. ICGEM and AVISO offer the GGMs and CNES-CLS22 MDT data, respectively.
-
Research ethics: This study adheres to ethical standards in the research.
-
Author contributions: Michael Bako and Jurgen Kusche designed and implemented the study. Michael Bako analyzed the results and wrote the manuscript. Jurgen Kusche supervised the project.
-
Competing interests: The authors declare that they have no competing interests.
-
Research funding: Research and Open access Funding are provided by the University of Bonn.
-
Data availability: The raw data can be obtained on request from the corresponding author.
References
1. Sandwell, DT, Smith, WHF. Marine gravity anomaly from geosat and ERS satellite altimetry. J Geophys Res 1997;102:10039–54. https://doi.org/10.1029/96JB03223.Search in Google Scholar
2. Li, Q, Bao, L, Wang, Y. Accuracy evaluation of altimeter-derived gravity field models in offshore and coastal regions of China. Front Earth Sci 2021;9:722019. https://doi.org/10.3389/feart.2021.722019.Search in Google Scholar
3. Nwilo, PC. Technological advancements in surveying and mapping: the Nigeria adaptation. In: FIG working week 2015 “from the wisdom of the ages to the challenges of the modern world”, Bulgaria, 17th-21st May 2015. Sofia. FIG publications; 2013.Search in Google Scholar
4. Odumuso, JO. Determination and utilization of a homogenized gravity dataset for the development of a gravimetric geoid for South Western Zone of Nigeria. In: A PhD thesis submitted to the school of postgraduate, federal university of technology, Minna, Nigeria; 2019.Search in Google Scholar
5. Bako, M, Ojigi, LM, Dodo, JD. An evaluation of different GNSS orbit solutions for precise point positioning in the federal capital territory, abuja. J Geoinf Earth Sci 2019;1:1–8.Search in Google Scholar
6. Bureau Gravimetrique International. Marine gravity data; 2018. Available from: http://bgi.omp.obs-mip.fr/data-products/Gravity-Databases/Marine-Gravity-data.Search in Google Scholar
7. Moka, EC, Jackson, K, Lawrence, H. Development of a gravimetric geoid model for Nigeria. Nigeria J Geodesy 2018;1:1–9.Search in Google Scholar
8. Andersen, OB, Abulaitijiang, A, Zhang, S, Rose, SK. A new high-resolution Mean Sea Surface (DTU21MSS) for improved sea level monitoring. In: EGU general assembly conference abstracts (EGU21-16084); 2020.10.5194/egusphere-egu21-16084Search in Google Scholar
9. Andersen, OB, Knudsen, P. The DTU 21 global marine gravity field-first evaluation Ocean surf topogr sci team meet. Boulder, Colorado; 2021. Available from: http://Ftp.space.dtu.dk/pub/Altimetry/CUNDERLIK.Search in Google Scholar
10. Zamri, ANM, Pa’Suya, MF, Din, AHM, Azmin, NSHN, Othman, NA. Optimizing the integration of gravity data inputs for geoid modelling over peninsular Malaysia. In: 2024 20th IEEE international colloquium on signal processing & its applications (CSPA); 2024:41–6 pp.10.1109/CSPA60979.2024.10525293Search in Google Scholar
11. Liang, W, Li, J, Xu, X, Zhang, S, Zhao, Y. A high-resolution Earth’s gravity field model SGG-UGM-2 from GOCE, GRACE, satellite altimetry, and EGM2008. Engineering 2020;6:860–78. https://doi.org/10.1016/j.eng.2020.05.008.Search in Google Scholar
12. Zingerle, P, Pail, R, Gruber, T, Oikonomidou, X. The combined global gravity field model XGM2019e. J Geodesy 2020;94:1–12. https://doi.org/10.1007/s00190-02001398-0.Search in Google Scholar
13. Pavlis, NK, Holmes, SA, Kenyon, SC, Factor, JK. The development and evaluation of the Earth gravitational model 2008 (EGM2008). J Geophys Res Solid Earth 2012;117:1–38. https://doi.org/10.1029/2011jb008916.Search in Google Scholar
14. Zhang, S, Sandwell, DT, Jin, T, Li, D. Inversion of marine gravity anomalies over southeastern China seas from multi-satellite altimeter vertical deflections. J Appl Geophys 2017;137:128–37. https://doi.org/10.1016/j.jappgeo.2016.12.014.Search in Google Scholar
15. Abulaitijiang, A, Andersen, OB, Stenseng, L. Coastal sea level from inland CryoSat‐2 interferometric SAR altimetry. Geophys Res Lett 2015;42:1841–7. https://doi.org/10.1002/2015gl063131.Search in Google Scholar
16. Calafat, FM, Cipollini, P, Bouffard, J, Snaith, H, Féménias, P. Evaluation of new CryoSat-2 products over the ocean. Remote Sens Environ 2017;191:131–44. https://doi.org/10.1016/j.rse.2017.01.009.Search in Google Scholar
17. Nielsen, K, Stenseng, L, Andersen, OB, Villadsen, H, Knudsen, P. Validation of cryostat-2 sar mode-based lake levels. Remote Sens Environ 2015;171:162–70. https://doi.org/10.1016/j.rse.2015.10.023.Search in Google Scholar
18. Andersen, OB, Knudsen, P, Kenyon, S, Factor, J, Holmes, S. The DTU13 global marine gravity field-first evaluation. In: Ocean surface topography science team meeting. Boulder, Colorado; 2013.Search in Google Scholar
19. Andersen, OB, Knudsen, P, Kenyon, S, Factor, J, Holmes, S. Global gravity field from recent satellite (DTU15) –arctic improvements. First Break 2017;35:37–40. https://doi.org/10.3997/1365-2397.2017022.Search in Google Scholar
20. Andersen, OB, Knudsen, P. The DTU17 global marine gravity field: first validation results. In: International association of geodesy symposia. Springer; 2019:83–7 pp.10.1007/1345_2019_65Search in Google Scholar
21. Sandwell, DT, Harper, H, Tozer, B, Smith, WHF. Gravity field recovery from geodetic altimeter missions. Adv Space Res 2021;68:1059–72. https://doi.org/10.1016/j.asr.2019.09.011.Search in Google Scholar
22. Sinem Ince, E, Barthelmes, F, Reißland, S, Elger, K, Förste, C, Flechtner, F, et al.. ICGEM−15 years of successful collection and distribution of global gravitational models, associated services, and future plans. Earth Syst Sci Data 2019; 11:647–74.10.5194/essd-11-647-2019Search in Google Scholar
23. Gilardoni, M, Reguzzoni, M, Sampietro, D. GECO: a global gravity model by locally combining GOCE data and EGM2008. Studia Geophys Geod 2016;60:228–47. https://doi.org/10.1007/s11200-015-1114-4.Search in Google Scholar
24. Förste, C, Bruinsma, SL, Abrikosov, O, Lemoine, JM, Schaller, T, Gotze, HJ, et al.. EIGEN-6C4 the latest combined global gravity field model including GOCE data up to degree and order 2190 of GFZ postdam and GRGS toulouse. In: 5th GOCE user workshop. Paris, France: European Space Agency; 2015.Search in Google Scholar
25. Andersen, OB, Knudsen, P, Berry, PA. The DNSC08GRA global marine gravity field from double-tracked satellite altimetry. J Geodesy 2010;84:191–9. https://doi.org/10.1007/s00190-009-0355-9.Search in Google Scholar
26. Andersen, OB, Knudsen, P. Global gravity field from the ERS-1 and the GEOSAT geodetic mission altimetry: the Mediterranean Sea. In: ESA SP (Print). Noordwijk: ESA Publications Division; 1997:1573–6 pp.10.1007/978-3-662-03482-8_58Search in Google Scholar
27. Drinkwater, M, Floberghagen, R, Haagmans, R, Muzi, D, Popescu, A. GOCE: ESA’s first Earth explorer core mission. Space Sci Rev 2003;108:419–32. https://doi.org/10.1023/a:1026104216284.10.1007/978-94-017-1333-7_36Search in Google Scholar
28. Tapley, B, Bettadpur, S, Watkins, M, Reigber, C. The gravity Recovery and climate experiment: mission overview and early results. Geophys Res Lett 2004;31. https://doi.org/10.1029/2004GL019779.Search in Google Scholar
29. Wessel, P, Watts, AB. On the accuracy of marine gravity measurements. J Geophys Res Solid Earth 1988;93:393–413. https://doi.org/10.1029/jb093ib01p00393.Search in Google Scholar
30. Unesco. Intergovernmental oceanographic commission technical series. Presented at the eighth session at the IOC assembly unesco, Paris 5-17 november 1973, PP 52-54; 1973. Available from: https://unesdoc.unesco.org/in/rest/annotationSVC/DownloadWatermarkedAttachment/attach_import_6ecf4695-d2b2-4dfb-b275-ede3c437fcac.Search in Google Scholar
31. Emery, KO, Uchupi, E, Phillips, J, Bowin, C, Mascle, J. Continental margin off western Africa: Angola to Sierra Leone. AAPG Bull 1975;59:2209–65. https://doi.org/10.1306/83d92249-16c7-11d7-8645000102c1865d.Search in Google Scholar
32. Schlich, R. Benin cruise. RV Jean Charcot; 1971. https://doi.org/10.17600/71003811.Search in Google Scholar
33. Basile, C, Mascle, J, Sage, F, Lamarche, G, Pontoise, B. Precruise and site surveys: a synthesis of marine geological and geophysical data on the Côte d’Ivoire-Ghana Transform Margin. In: Mascle, J, Lohmann, GP, Clift, PD, editors. Proc. ODP, init. repts; 1996, 159:47–60 pp.10.2973/odp.proc.ir.159.103.1996Search in Google Scholar
34. Renard, V. Walda-004 CH21 cruise. RV Jean Charcot; 1971. https://doi.org/10.17600/71003811.Search in Google Scholar
35. Denker, H, Roland, M. Compilation and evaluation of a consistent marine gravity data set surrounding Europe. In: A window on the future of geodesy: proceedings of the international association of geodesy IAG general assembly aapporo. Berlin, Heidelberg: Springer; 2005:248–53 pp.10.1007/3-540-27432-4_42Search in Google Scholar
36. Morelli, C, Gantar, C, McConnell, RK, Szabo, B, Uotila, U. The international gravity standardization net (IGSN 71). DTIC Document; 1972. Available from: https://apps.dtic.mil/sti/pdfs/ADA006203.pdf.Search in Google Scholar
37. Folger, DW, Irwin, BJ, McCullough, JR, Driscoll, GR, Polloni, CF. Map showing free-air gravity anomalies off the western coast of Africa Senegal (south of 15° north latitude) to Sierra Leone. Virginia: USGS; 1990.Search in Google Scholar
38. Dorschel, B, Hehemann, L, Viquerat, S, Warnke, F, Dreutter, S, Tenberge, YS, et al.. The international bathymetric chart of the southern ocean version 2. Sci Data 2022;9:275. https://doi.org/10.1038/s41597-022-01366-7.Search in Google Scholar PubMed PubMed Central
39. Forsberg, R. A study of terrain reductions, density anomalies and geophysical inversion methods in gravity field modelling. Columbus, Ohio: Department of Geodetic Science and Surveying. Ohio State University; 1984.10.21236/ADA150788Search in Google Scholar
40. Forsberg, R, Tscherning, CC. An overview manual for the GRAVSOFT geodetic gravity field modelling programs. DRAFT, 1st ed. Copenhagen: Contract report for JUPEM; 2008.Search in Google Scholar
41. Chen, W, Tenzer, R, Gu, X. Sediment stripping correction to marine gravity data. Mar Geodesy 2014;37:419–39. https://doi.org/10.1080/01490419.2014.932870.Search in Google Scholar
42. Forsberg, R, Tscherning, CC. The use of height data in gravity field approximation by collocation. J Geophys Res Solid Earth 1981;86:7843–54. https://doi.org/10.1029/JB086iB09p07843.Search in Google Scholar
43. Villadsen, H, Deng, X, Andersen, OB, Stenseng, L, Nielsen, K, Knudsen, P. Improved inland water levels from SAR altimetry using novel empirical and physical retrackers. J Hydrol 2016;537:234–47. https://doi.org/10.1016/j.jhydrol.2016.03.051.Search in Google Scholar
44. Jousset, S, Mulet, S, Greiner, E, Wilkin, J, Vidar, L, Dibarboure, G, et al.. New global mean dynamic topography CNES-CLS-22 combining drifters, hydrological profiles and high-frequency radar data. Authorea Preprints; 2023.10.22541/essoar.170158328.85804859/v1Search in Google Scholar
45. Kvas, A, Brockmann, JM, Krauss, S, Schubert, T, Gruber, T, Meyer, U, et al.. GOCO06s–a satellite-only global gravity field model. Earth Syst Sci Data Discuss 2021;13:1–31. https://doi.org/10.5194/essd-13-99-2021.Search in Google Scholar
46. Schaeffer, P, Pujol, MI, Veillard, P, Faugere, Y, Dangneaux, Q, Dibarboure, G, et al.. The CNES CLS 2022 mean sea surface: short wavelength improvements from cryostat-2 and SARAL/Altika high-sampled altimeter data. Rem Sens 2023;15:2910. https://doi.org/10.3390/rs15112910.Search in Google Scholar
47. Heisknen, WA, Moritz, H. Physical geodesy. San Francisco: W. H. Freeman; 1967.10.1007/BF02525647Search in Google Scholar
48. Zaki, A, Magdy, M, Rabah, M, Saber, A. Establishing a marine gravity database around Egypt from satellite altimetry-derived and shipborne gravity data. Mar Geodesy 2021;45:101–20. https://doi.org/10.1080/01490419.2021.2020185.Search in Google Scholar
49. Matheron, G. Principles of geostatistics. Econ Geol 1963;58:1246–66. https://doi.org/10.2113/gsecongeo.58.8.1246.Search in Google Scholar
50. Kamto, PG, Yap, L, Nguiya, S, Kande, LH, Kamguia, J. Evaluation of latest marine gravity field models derived from satellite altimetry over the Gulf of Guinea (Central Africa) with shipborne gravity data. Studia Geophys Geod 2022;66:23–37. https://doi.org/10.1007/s11200-021-0157-y.Search in Google Scholar
51. El-Fiky, G. Satellite gradiometry for modeling sea current circulation [Doctoral dissertation]. Zagazig University; 2018.Search in Google Scholar
52. Zaki, A, Mansi, AH, Selim, M, Rabah, M, El-Fiky, G. Comparison of satellite altimetric gravity and global geopotential models with shipborne gravity in the Red Sea. Mar Geodesy 2018;41:258–69. https://doi.org/10.1080/01490419.2017.1414088.Search in Google Scholar
53. Sansò, F, Michael, GS. Geoid determination: theory and methods. Berlin, Germany: Springer Science & Business Media; 2013.10.1007/978-3-540-74700-0Search in Google Scholar
54. Hofmann-Wellenhof, B, Helmut, M. Physical geodesy. Berlin, Germany: Springer Science & Business Media; 2006.Search in Google Scholar
55. Abdallah, M, Abd El Ghany, R, Rabah, M, Zaki, A. Comparison of recently released satellite altimetric gravity models with shipborne gravity over the Red Sea. Egypt J Remote Sens Space Sci 2022;25:579–92. https://doi.org/10.1016/j.ejrs.2022.03.016.Search in Google Scholar
56. Wu, Y, Wang, J, Abulaitijiang, A, He, X, Luo, Z, Shi, H, et al.. Local enhancement of marine gravity field over the spratly islands by combining satellite SAR altimeter-derived gravity data. Remote Sens 2022;474:14. https://doi.org/10.3390/rs1403047456.56.56.56.Search in Google Scholar
© 2024 the author(s), published by De Gruyter, Berlin/Boston
This work is licensed under the Creative Commons Attribution 4.0 International License.
Articles in the same Issue
- Frontmatter
- Original Research Articles
- Locally robust Msplit estimation
- Extending geodetic networks for geo-monitoring by supervised point cloud matching
- Evaluation and homogenization of a marine gravity database from shipborne and satellite altimetry-derived gravity data over the coastal region of Nigeria
- Modelling geoid height errors for local areas based on data of global models
- Unmanned aerial vehicle-based aerial survey of mines in Shanxi Province based on image data
- Ionospheric TEC and its irregularities over Egypt: a comprehensive study of spatial and temporal variations using GOCE satellite data
- Monitoring of volcanic precursors using satellite data: the case of Taftan volcano in Iran
- Modeling of temperature deformations on the Dnister HPP dam (Ukraine)
- Impact of temporal resolution in global ionospheric models on satellite positioning during low and high solar activity years of solar cycle 24
- Comparative performance of PPP software packages in atmospheric delay estimation using GNSS data
- Assessment and fitting of high/ultra resolution global geopotential models using GNSS/levelling over Egypt
- An efficient ‘P1’ algorithm for dual mixed-integer least-squares problems with scalar real-valued parameters
- Spatio-temporal trajectory alignment for trajectory evaluation
- Monitoring of networked RTK reference stations for coordinate reference system realization and maintenance – case study of the Czech Republic
- Crustal deformation in East of Cairo, Egypt, induced by rapid urbanization, as seen from remote sensing and GNSS data