Complex dielectric, electric modulus, impedance, and optical conductivity of Sr3−x Pb x Fe2TeO9 (x = 1.50, 1.88 and 2.17)
-
Abdelhadi El Hachmi

 und
Bouchaib Manoun
und
Bouchaib Manoun

Abstract
Sr3−x
Pb
x
Fe2TeO9 (x = 1.50, 1.88 and 2.17) were synthesized in polycrystalline form via the solid-state reaction route in air, and were studied at room temperature using powder X-ray diffraction and ultraviolet visible spectroscopy techniques. The crystal structures were resolved by the Rietveld refinement method; x = 1.50 and 1.88 adopt a tetragonal phase (space group I4/mmm) while x = 2.17 adopts a hexagonal phase (space group R
1 Introduction
Perovskite compounds with general formula A3B2B’O9 demonstrate a huge variety of interesting functional properties such as ferroelectricity, piezoelectricity, pyroelectricity, electrostrictive, magnetic ordering, colossal magnetoresistance, superconductivity, nonlinear optics, etc. due to their compositional and structural diversity [1], [2], [3], [4]. There are few materials that simultaneously possess two or more kinds of order parameters in the same phase such as ferroelectric, ferromagnetic and/or ferroelastic orderings [5], for that reason the coupling between electric and magnetic ordering in multiferroic materials leads to an electromagnetic effect, offering a wide range of potential applications such as memories, sensors, and communication [6]. Lead-based perovskites with magnetic cations in the B-sites more often exhibit a magnetoelectric effect; which are potentially excellent candidates for both magnetic and electric orderings [5, 7]. The lead-based compound Pb(Fe2/3W1/3)O3 belongs to the multiferroic materials; it has been reported to exhibit coexistence of ferroelectric and antiferromagnetic properties with both Fe3+ and W6+ cations disorder on the octahedral B-sites [4].
The ordered perovskites Pb2FeTaO6 and Pb2FeNbO6 have been widely studied since both demonstrate antiferromagnetic order below Néel Temperature (T N) ≈ 150 K and ferroelectric order close to room temperature [8, 9]. For these types of materials, the displacements of the B-cations as well as the tilt of the BO6 octahedra are responsible for the spontaneous polarization.
The coexistence of ferroelectric and magnetic properties at room temperature is very rarely reported. It was found that Pb(Fe x Ti1−x )O3 perovskite oxides [5] exhibit ferroelectric and ferromagnetic properties at room temperature. In the reported Pb2MnTeO6 compound [10], the phase transition from I2/m to C2/c is accompanied by a displacement of the Pb2+ cations from the center of the polyhedra due to the lone-pair electrons in the outermost shell (6s2). The existence of p-block elements in some perovskite compounds such as tellurium could be useful in stabilizing ferroelectric properties. The study of the optical properties of many perovskite compounds, including optical constants, optical conductivity, complex dielectric function, electrical modulus, and impedance, has proven to be very useful in elucidating optoelectronic applications of the materials.
The evaluation of optical refractive indices of certain materials is of great importance for applications in integrated optical devices such as filters, modulators and switches, etc., where the refractive index is one of the most important and fundamental characteristics of materials used in optical design [11].
Recently, we reported the synthesis method, crystal structure, magnetic state and optical bandgap energy of the compositions Sr3−x Pb x Fe2TeO9 (0 ≤ x ≤ 2.25) [12].
In this work, we continued to evaluate the other optical parameters that characterize these three selected compositions (x = 1.50, 1.88 and 2.17) such as the refractive index, extinction coefficient, real and imaginary parts of the complex optical conductivity, real and imaginary parts of the dielectric function, linear and nonlinear optical susceptibilities, real and imaginary parts of the electrical modulus, real and imaginary parts of the impedance and dissipation factor. In addition, we determined the values of Urbach energy, single oscillator energy, dispersion energy, static refractive index from the spectral plots of ln(α) versus hʋ and (n 2 − 1)−1 versus (hʋ)2.
2 Experimental procedures
Polycrystalline samples of ceramics Sr3−x Pb x Fe2TeO9 (x = 1.50, 1.88 and 2.17) [12] were synthesized by a solid-state reaction route, in air. High-purity powders SrCO3 (99.995 %), PbO (≥99.9 %), Fe2O3 (≥99.98 %) and TeO2 (≥99 %) were used as starting materials. Stoichiometric amounts of reagents were weighed in order to obtain appropriate metal ratios, then mixed and ground in an agate mortar to a uniform powder. The resulting samples were placed in alumina crucible and then heated progressively at higher temperature with intermittent grinding at 600 °C/12 h, 800 °C/12 h, 900 °C/12 h, and 950 °C/20 h, in air. The samples were cooled to room temperature for regrinding several times to improve their homogeneity. The X-ray diffraction (XRD) patterns of the studied samples were recorded at room temperature on a D2 PHASER diffractometer, using Cu-Kα radiation (λ = 1.54056 Å). The XRD patterns were scanned through steps of 0.010142° (2θ), between 15 and 105 (2θ, Bragg position) with a fixed time counting 2 s/step. The UV–visible diffuse reflectance spectra of the Sr3−x Pb x Fe2TeO9 (x = 1.50, 1.88 and 2.17) samples were measured at room temperature in the wavelength range 250–800 nm. The analyses were carried out using a Lambda 1050 UV/Vis/NIR spectrometer along with 150 mm integrating sphere (PerkinElmer, Inc.). The measurements were used to determine the optical properties. The thickness (e) of the samples was found to be 250 nm. Moreover, the area (A) of the samples was determined to be 1.32732 × 10⁻⁴ m2.
3 Results and discussion
3.1 Structural characterization
Figure 1 presents the powder XRD patterns of Sr3−x
Pb
x
Fe2TeO9 perovskites with x = 1.50, 1.88 and 2.17. The inset in Figure 1 shows excellent agreement between the observed and calculated patterns. The crystal structures were resolved using the Rietveld refinement method; it revealed that x = 1.50 and 1.88 adopt a tetragonal phase of space group I4/mmm (#139) and it also revealed that x = 2.17 adopts a hexagonal phase of space group R
where D is the crystallite size in nanometers, λ is the X-ray wavelength (Cu-Kα average = 1.54178 Å), K is a Scherrer constant equal to 0.94, θ is the Bragg angle of the most intense peak and β hkl is the line broadening, i.e., full width at half maximum (FWHM) on the highest peak of the tetragonal (112) (200) planes and the hexagonal (104) (110) planes, which are located at around 2θ ≈ 32°.
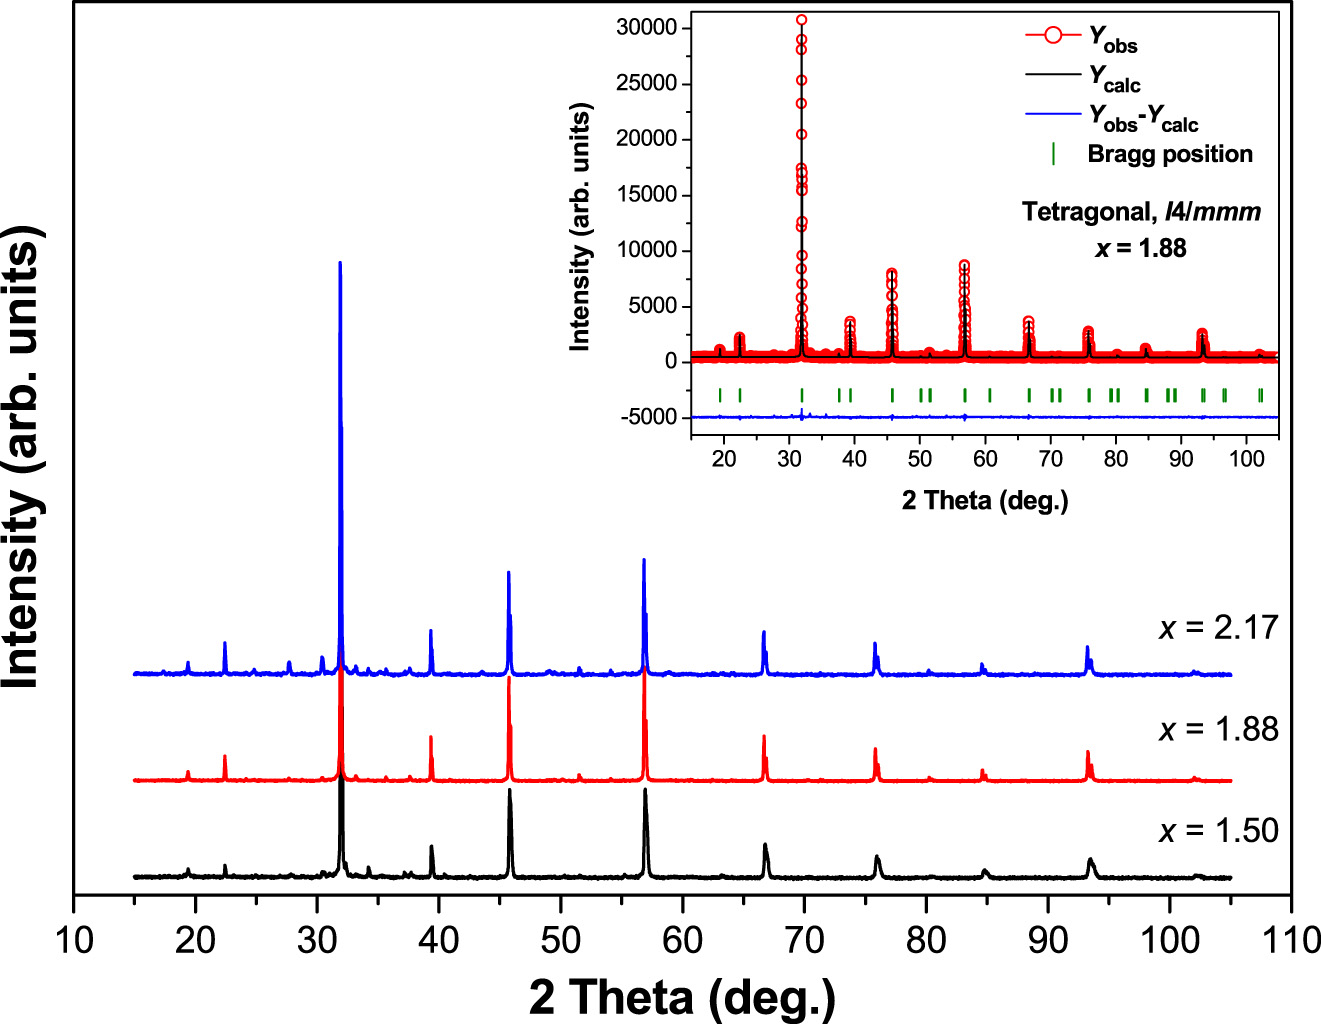
XRD patterns of Sr3−x Pb x Fe2TeO9 (x = 1.50, 1.88 and 2.17) perovskites collected at 298 K. The inset shows the final Rietveld refinement plot of x = 1.88.
In the Williamson–Hall (W–H) method [14], strain-induced broadening resulting from imperfection and distortions was related as follows:
where (ε = Δd/d) is an upper limit of lattice distortion. Assuming that the contributions of particle size and strain to the line broadening are independent of each other and both have a Cauchy-type profile, the observed linewidth can be expressed from Equations (1) and (2) as:
The unit-cell parameters, crystallite size and microstrain of the studied samples are computed and presented in Table 1. It can be noted that the crystallite size calculated using the Scherrer technique is smaller than that obtained using the W–H method.
Unit-cell parameters, crystallite sizes and strains of Sr3−x Pb x Fe2TeO9 (x = 1.50, 1.88 and 2.17).
| Compositions → | x = 1.50 | x = 1.88 | x = 2.17 |
|---|---|---|---|
| Crystal system | Tetragonal | Tetragonal | Hexagonal |
| Space group | I4/mmm | I4/mmm |
R
|
| Lattice parameters | a = b = 5.5960 Å, c = 7.9214 Å | a = b = 5.6066 Å, c = 7.9288 Å | a = b = 5.6086 Å, c = 13.7424 Å |
| α = β = γ = 90° | α = β = γ = 90° | α = β = 90°, γ = 120° | |
| Cell volume (Å3) | 248.06 | 249.24 | 374.38 |
| Density (g cm−3) | 7.368 | 7.732 | 8.033 |
| D Sch (nm) | 88.18 | 128.04 | 114.95 |
| D W–H (nm) | 128.25 | 135.45 | 117.83 |
| Microstrain (ε) | 0.466113 | 0.053839 | 0.029688 |
3.2 Optical parameters
The optical properties of Sr3−x Pb x Fe2TeO9 (x = 1.50, 1.88 and 2.17) ceramics have been investigated using UV/Vis/NIR spectrophotometer measurements. Absorbance and transmittance plots of the present compositions in the wavelength range 250–800 nm are shown in Figure 2a and b, respectively. By decreasing the wavelength from 800 to 500 nm, the absorbance spectra show a significant increase, while the transmittance spectra show a substantial decrease.
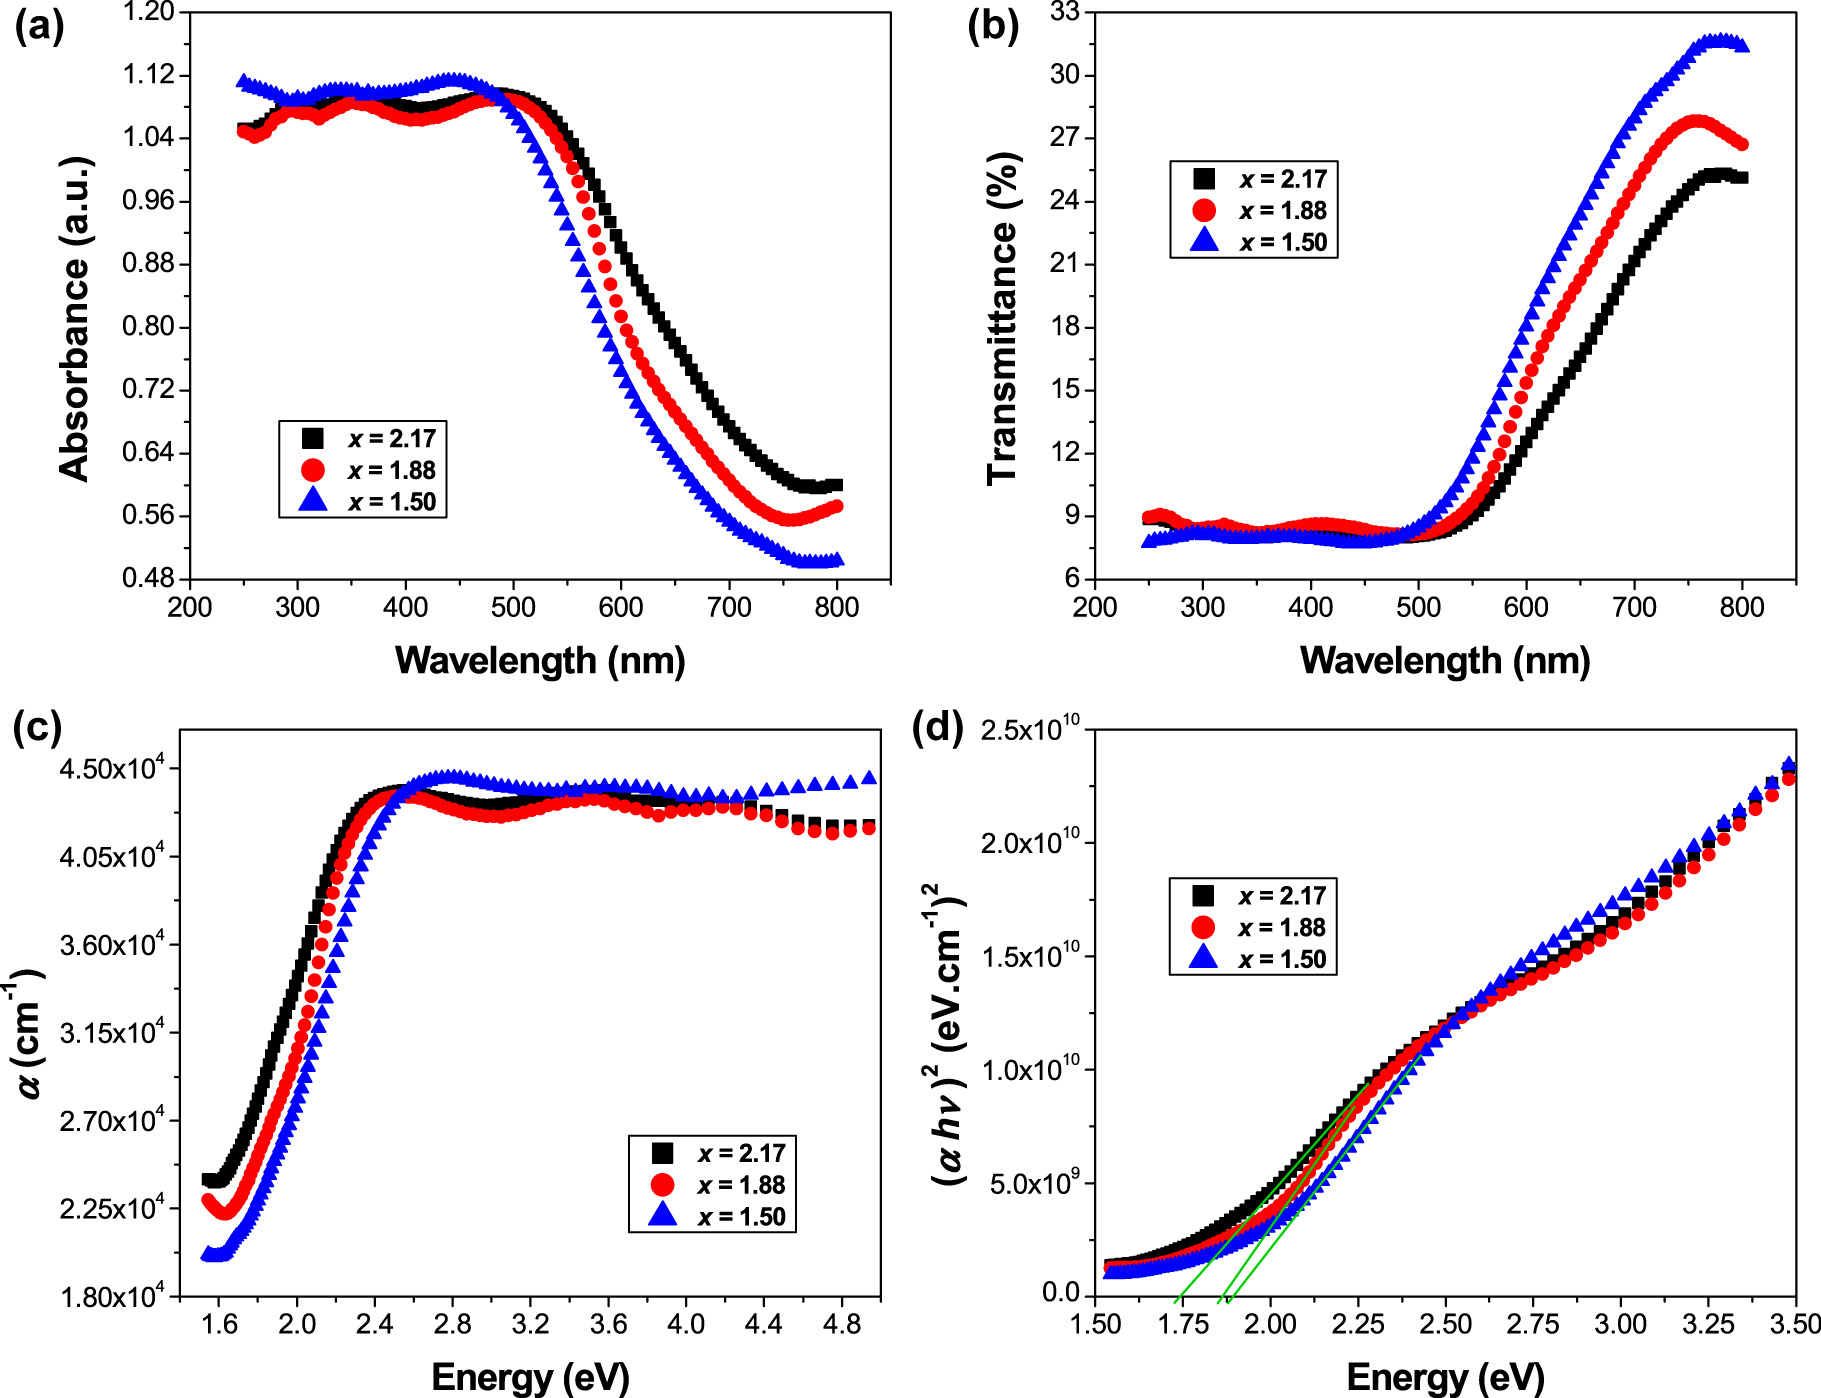
(a) Absorbance, and (b) transmittance spectra of Sr3−x Pb x Fe2TeO9 (x = 1.50, 1.88 and 2.17) ceramics as a function of wavelength, (c) absorption coefficient versus photon energy, (d) Tauc plots of (αhυ)2 against hυ.
Figure 2c exhibits the absorption coefficient (α) as a function of photon energy (hʋ) which can be computed from the transmittance data using the following Equation [15]:
where T is the optical transmittance and d is the thickness of the material.
The relation between the absorption coefficient (α) and the incident photon energy (hʋ) can be expressed using Tauc’s relationship in the high absorption region of semiconductor as follows [16]:
where B is a constant, hʋ is the photon energy (h = 6.626 × 10⁻³⁴ J is Planck’s constant, ʋ = c/λ is the light frequency s−1) and m represents the nature of the material transition (m = 2 for direct transition, m = 1/2 for indirect transition).
The optical bandgap energy of the compositions x = 1.50, 1.88 and 2.17 was determined using the expression of a direct bandgap semiconductor, m = 2, close to the band edge, with hʋ greater than E g of semiconductors, i.e., (αhʋ)2 ≈ B(hʋ − E g). Plots of (αhʋ)2 versus photon energy hʋ (known as Tauc plots [16]) for some selected compositions are displayed in Figure 2d. The values of the direct bandgap energy were estimated by extrapolating the linear region of the Tauc plots to the energy axis with a condition of (αhʋ)2 = 0 (as seen in Figure 2d). Therefore, E g values are estimated to be ∼1.89 eV for (x = 1.50), ∼1.87 eV for (x = 1.88) and ∼1.74 eV for (x = 2.17). The bandgap energy (E g) reduces with increasing Pb concentration in the system, indicating that the hybridization between the metal and oxygen orbital is enhanced. It can be confirmed that the observed values of E g obtained by multiplying the absorption coefficient by hʋ (Equation (5)) are slightly lower than those obtained in Reference [12] using the (F(R) × hυ)2 Kubelka–Munk (K–M) equation [17] for the same compositions. The absorption and refraction of a medium can be described by a single quantity called the complex refractive index which is written as follows [18]:
where the real part n is called the refractive index, and the imaginary part k is called the extinction coefficient. The refractive index (n) is an important parameter for the application of optical materials in optics-based devices because of its direct relationship to energy dispersion. The extinction coefficient (k) vanishes for lossless materials. The both parameters (n and k) are collectively called the optical constants of the material, were calculated using the following expressions [19, 20]:
where n is computed from the reflectance and extinction coefficient data. The photon energy hʋ dependence of refractive index (n) and extinction coefficient (k) of ceramics Sr3−x Pb x Fe2TeO9 (x = 1.50, 1.88 and 2.17) is depicted in Figure 3a and b, respectively. It was found that the refractive index (n) of the studied samples strictly decreases when the photon energy rises from 1.60 to 2.50 eV; then it becomes saturated in the high photon energy region.
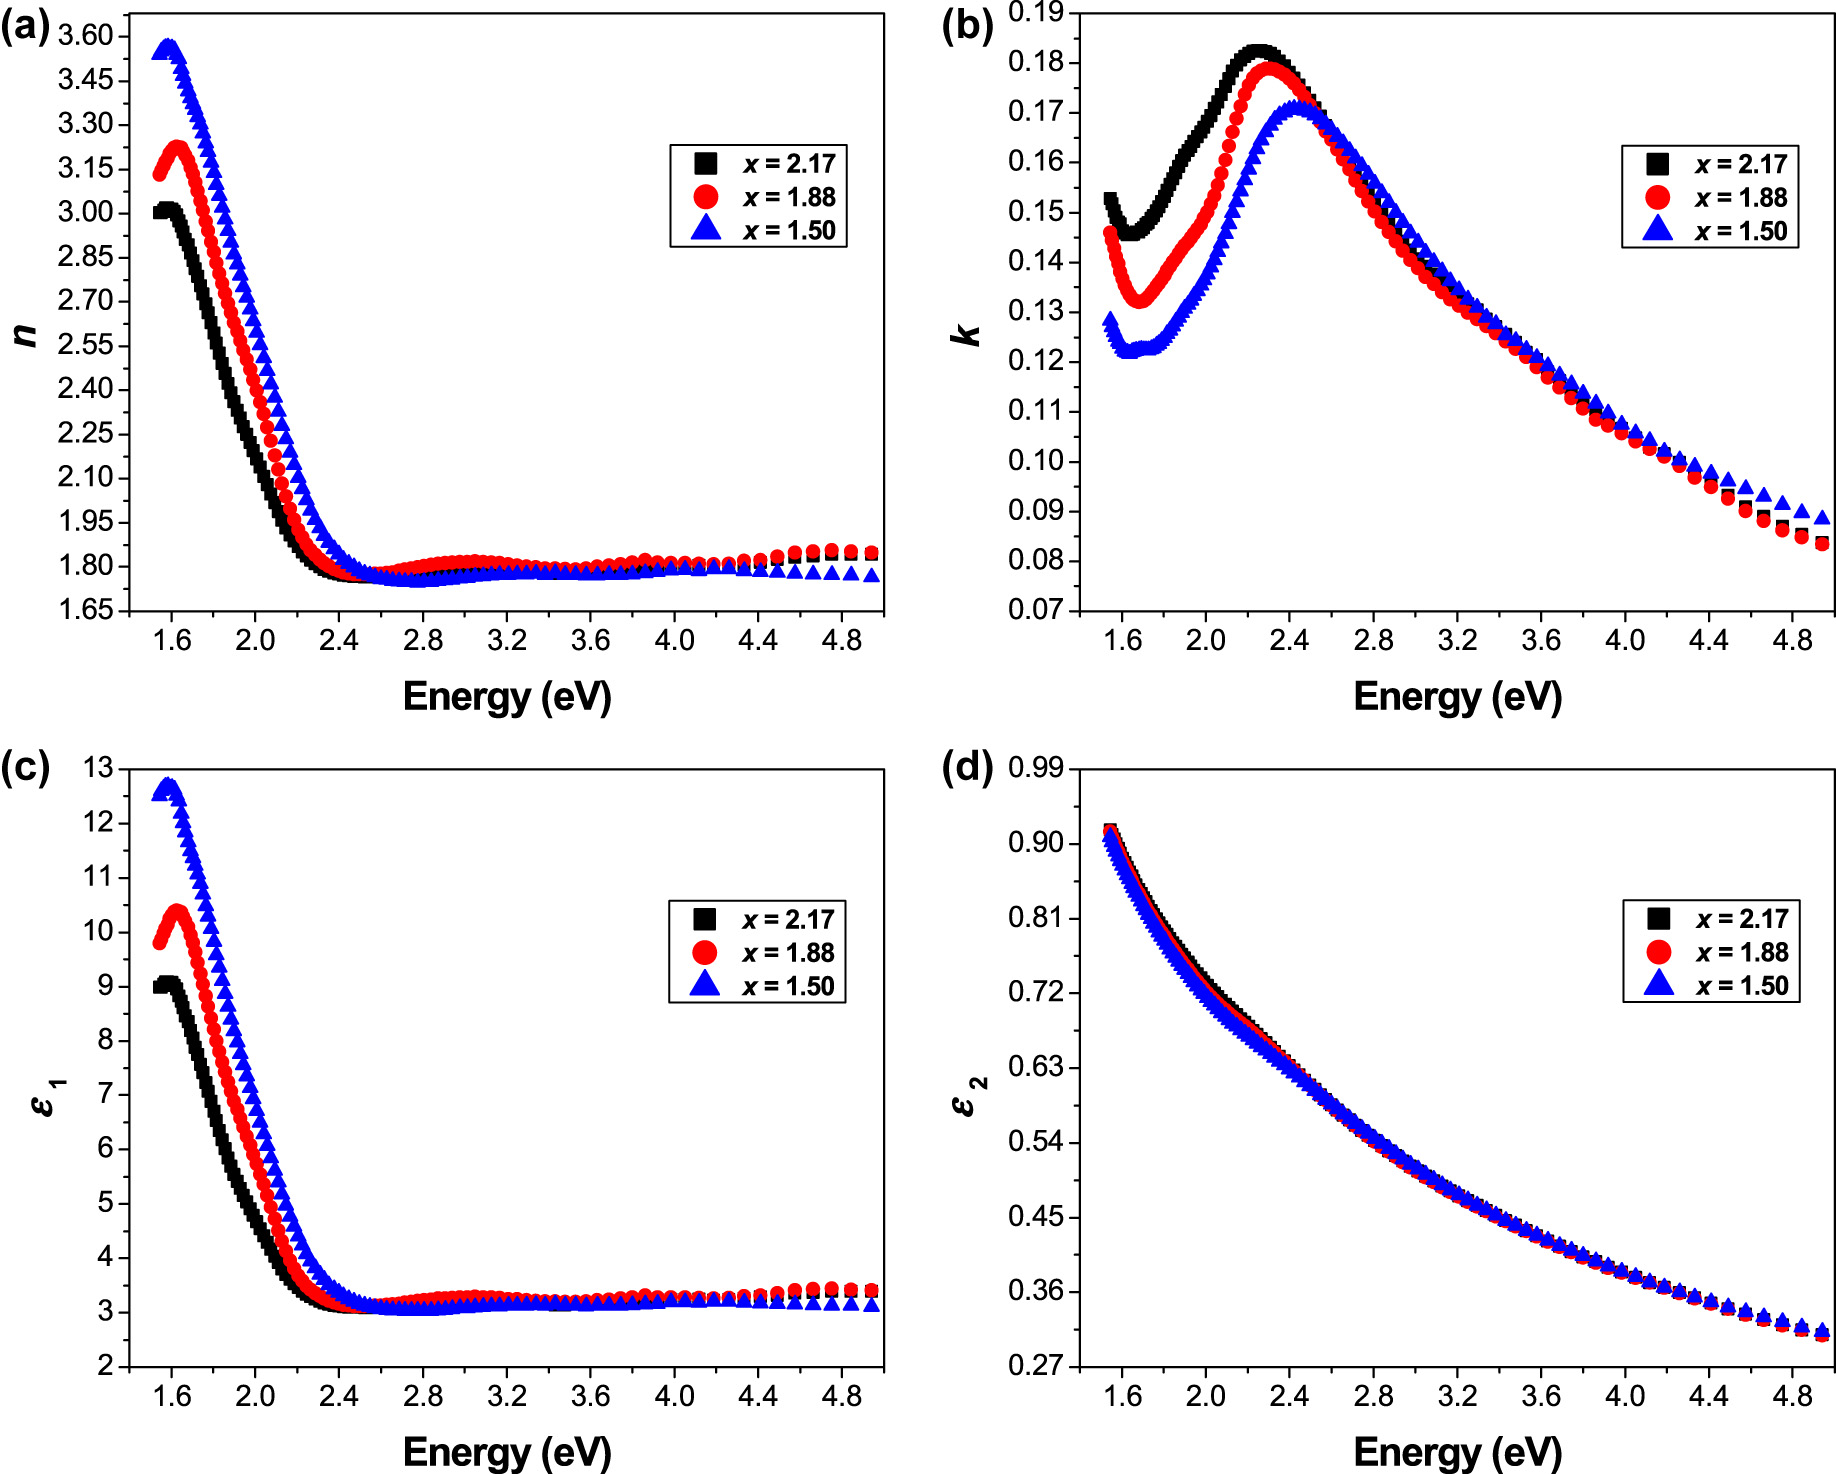
(a) Refractive index, and (b) extinction coefficient dependence on hυ for the Sr3−x Pb x Fe2TeO9 (x = 1.50, 1.88 and 2.17) perovskites, (c) real, and (d) imaginary parts of the dielectric permittivity as a function of photon energy.
However, the behavior of the extinction coefficient (k) differs from the refractive index (n); where k strictly increases when the photon energy rises from 1.70 to 2.43 eV to reach the maximum at 0.1709 for (x = 1.50), at 0.1789 for (x = 1.88), and at 0.1826 for (x = 2.17); then a considerable decrease was observed above k max with increasing photon energy.
The complex dielectric function (ε*) is usually defined in terms of its real and imaginary parts using the following Equation [18]:
The real (ε 1) and imaginary (ε 2) parts of the dielectric permittivity were evaluated using the relations derived from the complex refractive index as follows:
The variation of ε 1 and ε 2 as a function of photon energy hʋ of the samples (x = 1.50, 1.88 and 2.17) is presented in Figure 3c and d, respectively. It can be noted that the real part (ε 1) of the dielectric function exhibits the same behavior as the refractive index (n), where it strictly decreases when the photon energy rises from 1.60 to 2.50 eV; and then becomes saturated in the high photon energy region (>2.50 eV). In contrast, the imaginary part (ε 2) shows a sharp decrease with increasing photon energy from 2.50 to 4.94 eV.
An obvious consistency between the spectral plots of Figure 3a and c was observed, because there is a relationship between the dielectric permittivity (ε 1, ε 2) and the optical constants (n, k):
It can be seen that the real part (ε 1) shows the same trend as the refractive index (n) when the photon energy hʋ increases from 1.54 to 4.94 eV, and the values of the real part are larger than those of the imaginary part.
The optical conductivity is one of the important quantities that describe the optical properties of solids, and it is mainly used to detect any further allowed interband optical transition of a material. The complex optical conductivity (σ* = σ 1 + iσ 2) is related to the real and imaginary parts (ε 1, ε 2) of the complex dielectric function (ε*) by the following expressions [21]:
where ω (=2πν) is the angular frequency and ε 0 (=8.854 × 10⁻¹² F m−1) is the free space dielectric constant. The photon energy (hυ) dependence of the real and imaginary parts (σ 1, σ 2) of the complex optical conductivity (σ*) of ceramics Sr3−x Pb x Fe2TeO9 (x = 1.50, 1.88 and 2.17) is presented in Figure 4a and b, respectively.
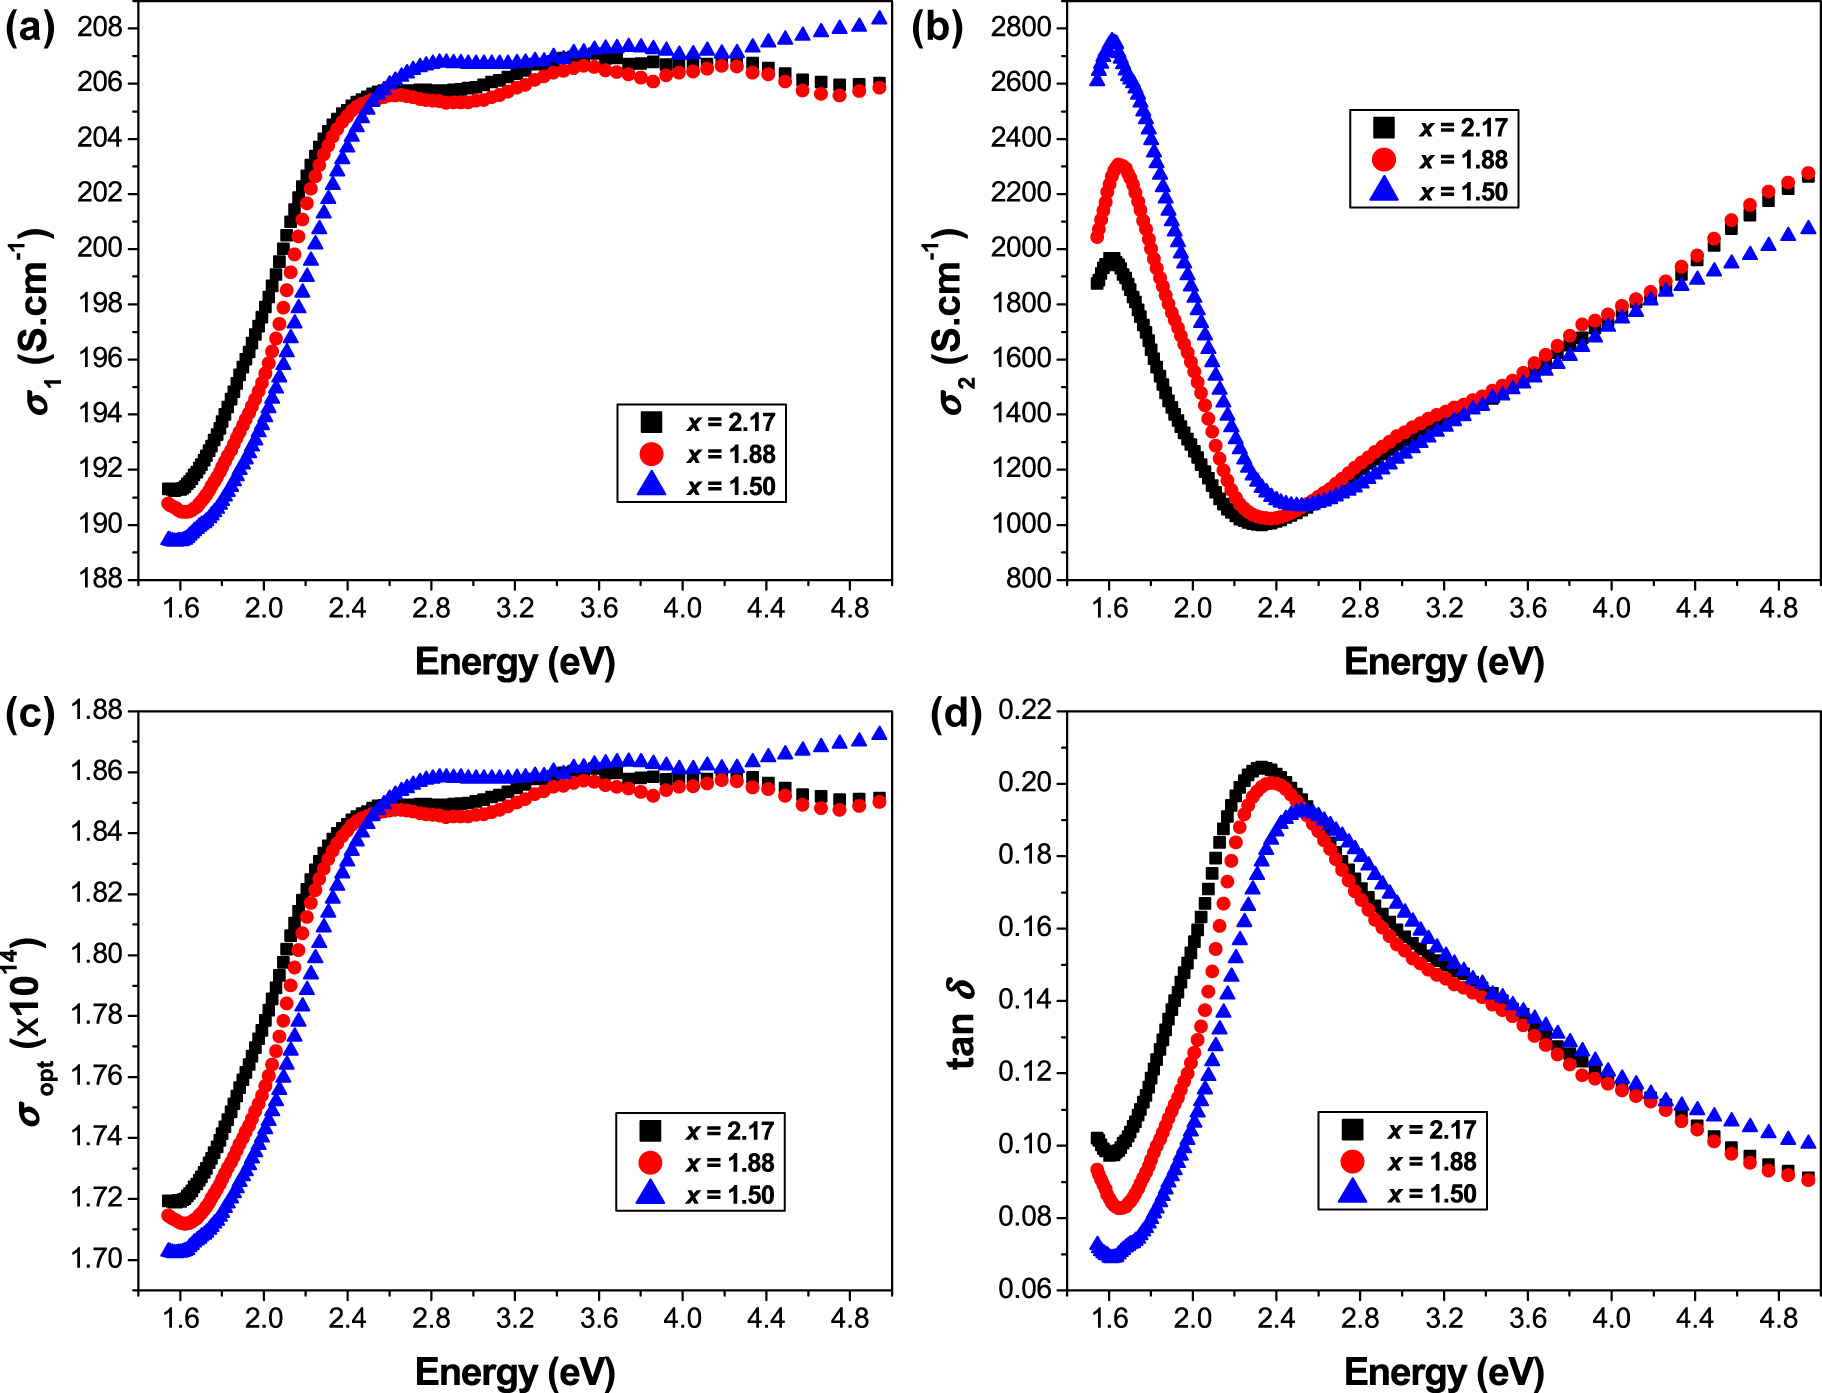
(a) Real, and (b) imaginary parts of the complex optical conductivity versus photon energy for the Sr3−x Pb x Fe2TeO9 (x = 1.50, 1.88 and 2.17) ceramics, (c) optical conductivity σ opt, and (d) dissipation factor as a function of hυ.
It can be seen that the real part (σ 1) progressively rises with increasing photon energy, while the imaginary part (σ 2) decreases in the low photon energy region to reach the minimum at ∼2.50 eV for (x = 1.50), at ∼2.37 eV for (x = 1.88), and at ∼2.32 eV for (x = 2.17); then it shows a significant increase above its minimum in the high photon energy region. The observed values of the real part (σ 1) are much smaller than those observed in the imaginary part (σ 2).
To evaluate the optical conductivity of the present compositions x = 1.50, 1.88 and 2.17, we used the refractive index and its relationship with the absorption coefficient as follows [22]:
Figure 4c shows the variation of optical conductivity as a function of photon energy. It can be observed that the plots of σ opt as a function of hυ exhibit the same behavior as that observed in the plots of the real part (σ 1) of the complex optical conductivity versus hυ.
In physics, the dissipation factor (or dielectric loss), tanδ, is a measure of the rate of energy loss from a mechanical or electrical oscillation mode in a dissipative system. For example, electrical energy in all dielectric materials is generally dissipated in the form of heat. The dissipation factor (tanδ) can be written as follows [23]:
The variation of tanδ as a function of photon energy hυ for the samples x = 1.50, 1.88 and 2.17 is displayed in Figure 4d.
The dispersion of the refractive index depends on the frequency of the light beam. As part of the energy evaluation that characterizes our compounds, we also investigated the dependence of the photon energy on the refractive index using the single effective oscillator model proposed by Wemple—DiDomenico [24] as:
where E 0 and E d are single oscillator constants. E 0 is the single oscillator energy, which is considered to be the average excitation energy of the electronic transitions; it is proportional to the bandgap, while E d is the dispersion energy, which is considered as a direct measure of the average strength of the optical transitions between the bands.
The curves of refractive index factor (n 2 − 1)−1 versus (hυ)2 of ceramics Sr3−x Pb x Fe2TeO9 with x = 1.50, 1.88 and 2.17 are shown in Figure 5a. The plots of Equation (15) allow us to determine the single oscillator constants (E 0 and E d) directly from the slope 1/(E 0 E d) and intercept (E 0/E d) of the linear fit. The estimated values of E 0 and E d are listed in Table 2.
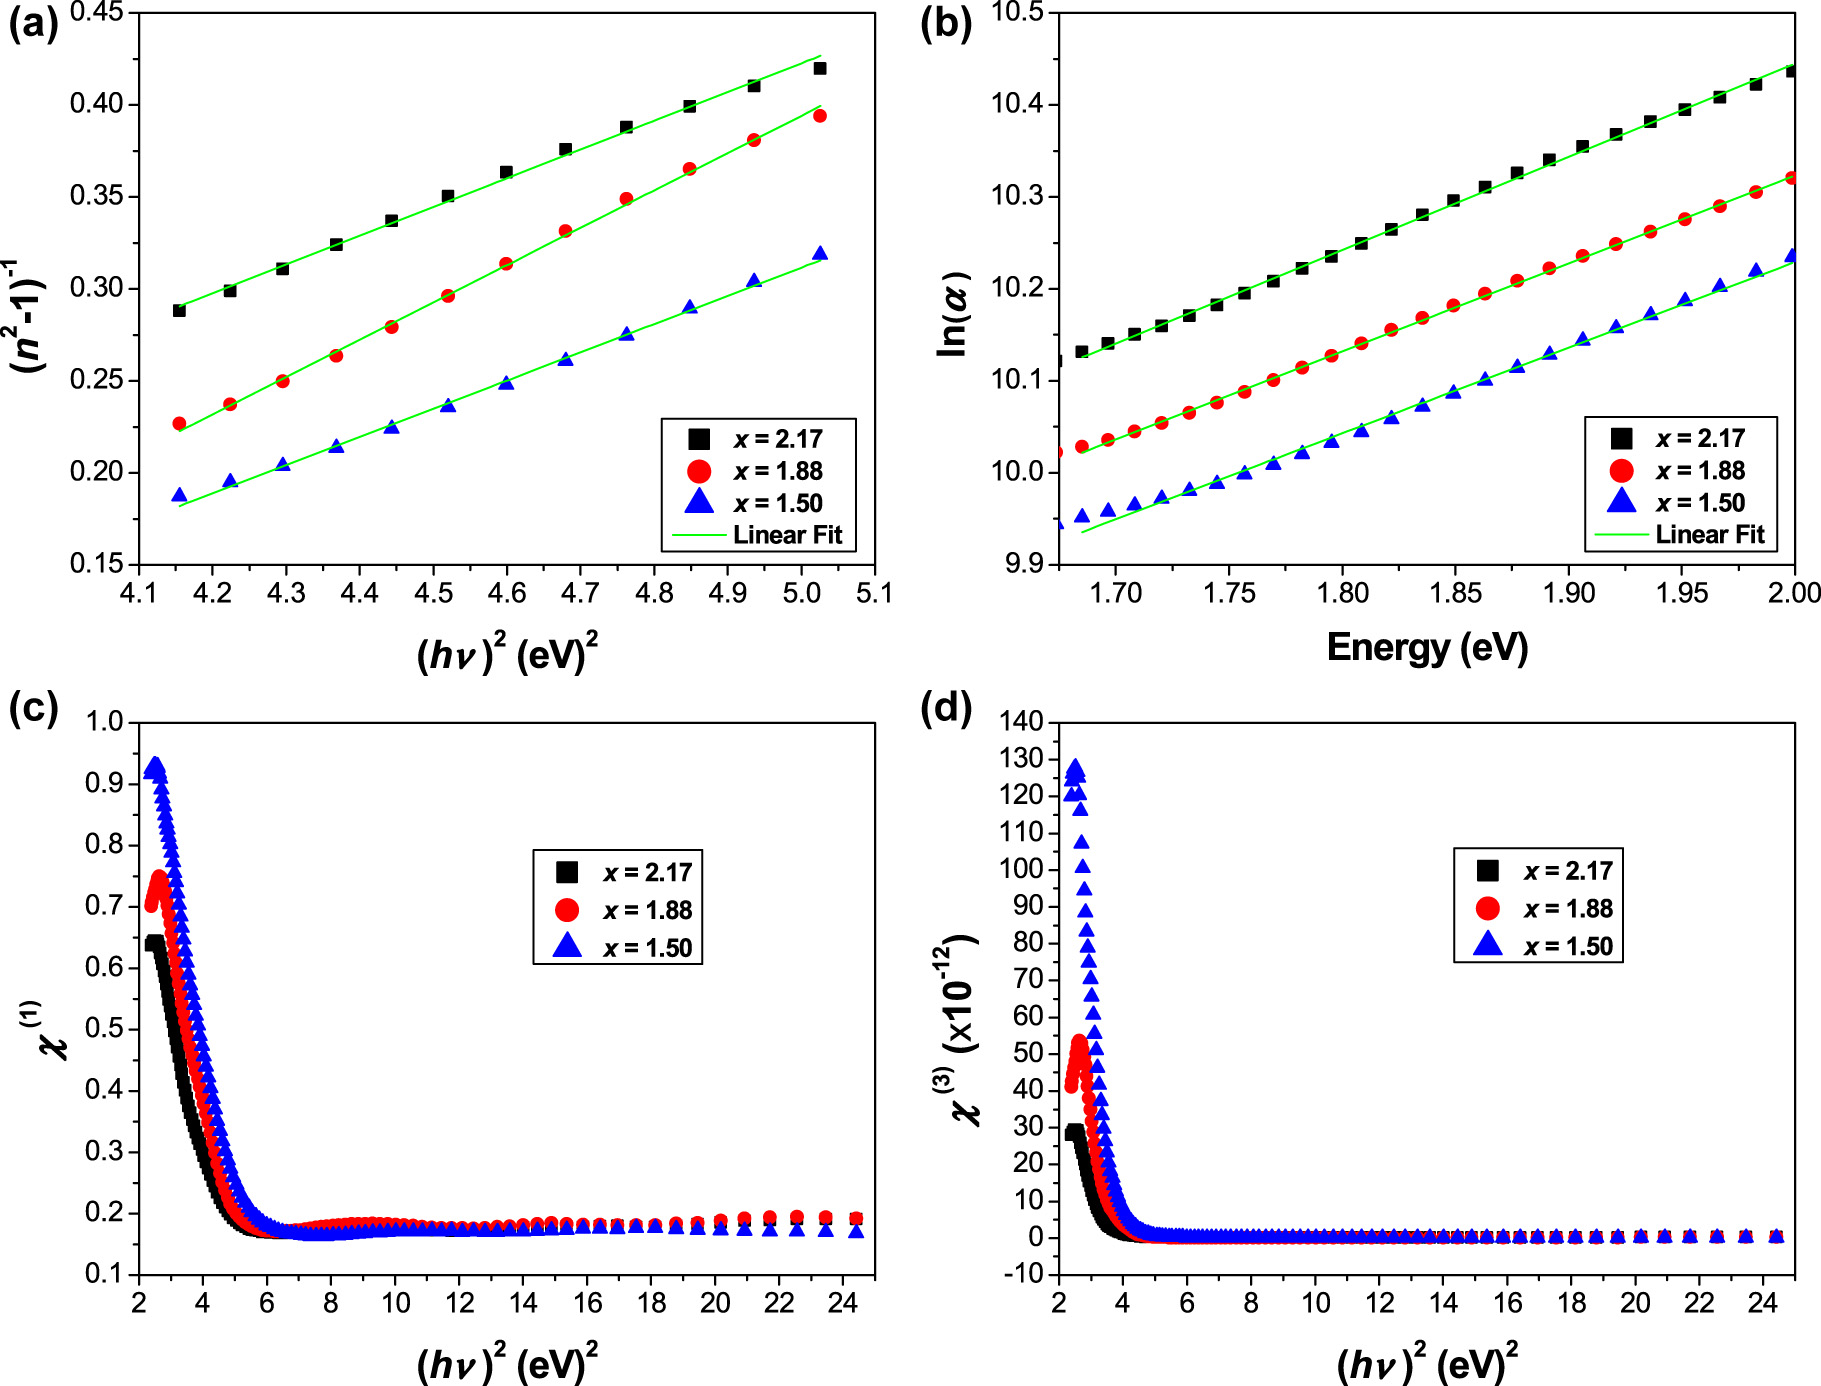
(a) Linear fitting curves of (n 2 − 1)−1 versus (hυ)2, (b) linear fitting curves of ln(α) against hυ, (c) linear, and (d) nonlinear optical susceptibilities as a function of (hυ)2.
Linear and nonlinear optical parameters of Sr3−x Pb x Fe2TeO9 (x = 1.50, 1.88 and 2.17).
| E g (eV) | E d (eV) | E 0 (eV) | E U (eV) | n 0 | χ (3) (× 10−12 esu) | n 2 (× 10−12 esu) | M –1 | M –3 (eV)−2 | ||
|---|---|---|---|---|---|---|---|---|---|---|
| x = 1.50 | 1.89 | 3.79 | 1.72 | 1.07 | 1.79 | 0.1592 | 3.357 | 2.20 | 0.74 | This work |
| x = 1.88 | 1.87 | 2.82 | 1.75 | 1.05 | 1.62 | 0.0461 | 1.075 | 1.61 | 0.53 | This work |
| x = 2.17 | 1.74 | 4.23 | 1.52 | 0.99 | 1.95 | 0.4136 | 8.008 | 2.79 | 1.22 | This work |
| Sr3Fe2TeO9 | 2.04 | – | – | – | – | – | – | – | – | [12] |
| Ca3Ti1.92Fe0.08O7−δ | 2.23 | 34.98 | 4.51 | 1.031 | 2.96 | 24.66 | 314.2 | – | – | [20] |
| BaTi0.5(Fe0.33W0.17)O3 | 4.36 | 23.18 | 15.40 | 1.42 | 1.58 | – | – | 1.22 | 0.07 | [30] |
| SrFe0.867Mo0.133O3−δ | 1.90 | 16.63 | 5.99 | 15.59 | 1.94 | – | – | – | – | [31] |
The results indicate that the values of E 0 follow the same variation of E g and we can observe that E 0 ≈ E g, while the values of E d change in the opposite direction with increasing x. The dispersion energy E d may depend on the charge distribution within a unit cell, which is closely related to chemical bonding.
The values of the static refractive index (n 0) are calculated by extrapolating the Wemple–DiDomenico dispersion equation to (hυ → 0), which is given by:
The values of n 0 are calculated to be ∼1.79 for (x = 1.50), ∼1.62 for (x = 1.88) and ∼1.95 for (x = 2.17). The high frequency dielectric constant ε ∞ = (n 0)2 is 3.204 for (x = 1.50), 2.624 for (x = 1.88) and 3.803 for (x = 2.17). According to the model mentioned above, the single oscillator parameters E 0 and E d are correlated to the imaginary part (ε 2) of the complex dielectric function and the −1 and −3 moments of the ε 2 optical spectrum can be derived from the following expressions [25]:
The values of the M −1 and M −3 moments are summarized in Table 2, where M −1 is dimensionless and M −3 is in (eV)−2.
The Urbach energy is generally defined as the width of the tail of localized defect states in the bandgap. In fact, the disorder is associated with structural defects in a material, leading to an elongation of the density of states in the band tails. The impurities can cause band defects, which increase the intermediate levels within the bandgap region.
The Urbach energy is taken into account as the width of the exponential absorption edge and can be determined by the following relationship [26]:
where α 0 is a constant and E U is the Urbach energy. Figure 5b shows the plots of ln(α) as a function of photon energy hυ for ceramics Sr3−x Pb x Fe2TeO9 with x = 1.50, 1.88 and 2.17. The E U values were derived from the slope (1/E U) of the linear fit of the ln(α) versus hυ plots, as shown in Figure 5b. Hence, the E U values are estimated to be ∼1.07 eV for (x = 1.50), ∼1.05 eV for (x = 1.88) and ∼0.99 eV for (x = 2.17).
Nonlinear optics deals with the interaction between light and matter. In general, the optical response of a solid varies linearly with the magnitude of the electric field. Otherwise, at high powers, the properties of the solid can change more rapidly, resulting in nonlinear effects. The linear and nonlinear susceptibilities are correlated to the induced polarization as a power series of the electric field strength of light, which can be described by the following expression [27]:
where χ (1) is the linear optical susceptibility, χ (2) and χ (3) are second- and third-order nonlinear optical susceptibilities, respectively. However, Lines et al. [28] found that χ (2) equals zero for optically isotropic glasses and for centro-symmetric crystals.
The linear optical susceptibility χ (1) in an isotropic medium can be expressed from the linear refractive index by:
Figure 5c displays the linear optical susceptibility, χ (1), as a function of the square of the photon energy. It was found that χ (1) strictly decreases with increasing the squared photon energy in the low region and becomes saturated above 6 (eV)2.
The nonlinear optical susceptibility χ (3) and the linear optical susceptibility χ (1) are directly correlated according to Miller’s rule [20, 29]:
where A ≈ 1.7 × 10⁻¹⁰ is a constant (for χ (3) in esu with 1 esu equal to 1.4 × 10⁻⁸ m2 V−2). Figure 5d shows the plots of χ (3) versus (hυ)2 for the studied compositions x = 1.50, 1.88 and 2.17. It can be seen that χ (3) shows the same behavior as χ (1). Moreover, with a tendency towards the long-wavelength edge (hυ → 0), Equation (21) becomes:
The nonlinear refractive index (n 2) can be determined from the nonlinear susceptibility χ (3) using the following relation:
The calculated values of χ (3) and n 2 are given in Table 2. For comparison, we have also provided the values of the optical parameters of some perovskite compounds (see: Table 2) [30, 31].
The complex electric modulus is a very important and convenient parameter to analyze the electric transport phenomenon and the relaxation mechanism in the materials [32], it has been defined as being proportional to the reciprocal of the dielectric permittivity of the materials (M* = 1/ε*). The complex electrical modulus (M*) and complex impedance (Z*) are related to the real (ε 1) and imaginary (ε 2) parts of the complex dielectric constant by the following expressions [30, 33]:
where M 1 and M 2 are the real and imaginary parts of the complex electrical modulus, respectively, Z 1 and Z 2 are the real and imaginary parts of the complex impedance, ω (= 2πν) is the angular frequency, C 0 = (A/e)ε 0 denotes the vacuum capacitance of the cell (where ε 0 is the permittivity of free space, A = area and e = thickness of the material).
For example, the diameter of the pellets is 1.30 cm (= 1.30 × 10⁻² m) and their thickness (e) = 250 × 10−7 cm (= 250 × 10−9 m). The area (A) of the samples = 1.32732 × 10⁻⁴ m2, and therefore, the C 0 = (1.32732 × 10⁻⁴ m2/250 × 10−9 m) × (8.854 × 10⁻¹² F m−1) = 4.70084 × 10⁻⁹ F which is equal to 4.70084 nF. Figure 6a and b illustrates the variation of the real (M 1) and imaginary (M 2) parts of the complex electric modulus as a function of the photon energy hυ.
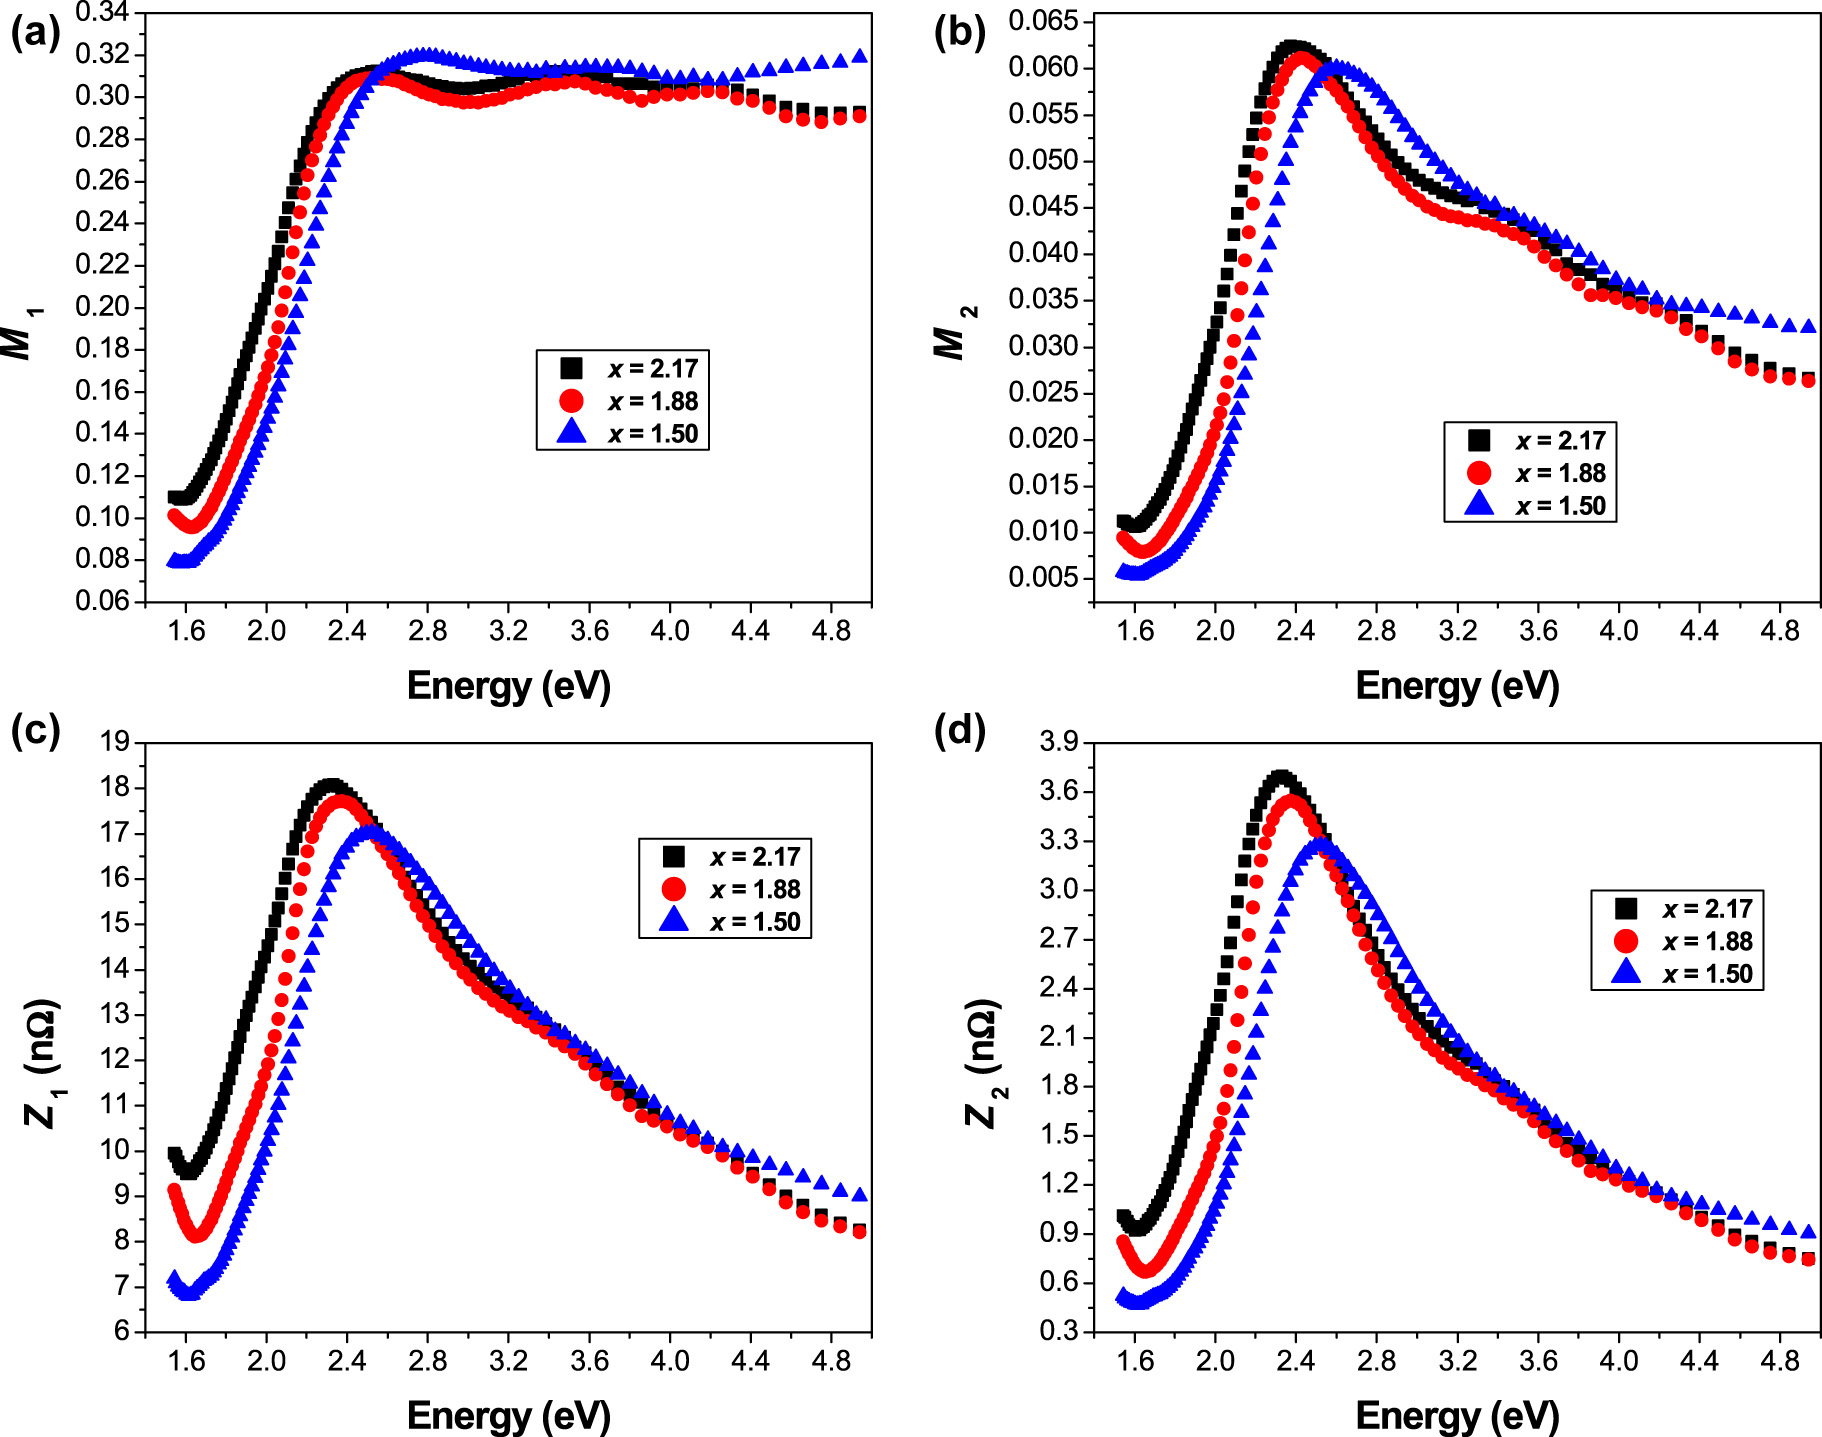
Variation of (a) real, and (b) imaginary parts of the complex electric modulus, (c) real, and (d) imaginary parts of the complex impedance as a function of photon energy.
The M 1 curves show the dispersion in the high photon energy region, which may have arisen due to the conductivity relaxation. A continuous sigmoidal increase was observed for the real part M 1 with increasing photon energy hυ, which may be due to the short-range mobility of charge carriers. In addition, M 1 exhibits a saturation tendency at maximum asymptotic values in the high energy region, which is likely related to a lack of restoring force governing the mobility of charge carriers under the influence of an induced electric field. This behavior originates from the long-range mobility of charge carriers that cause electrode polarization.
On the other hand, the variation of the imaginary part M 2 as a function of photon energy gives important information about charge transport processes such as the electrical transport mechanism, conductivity relaxation and ion dynamics. The region in which the peaks occur indicates the transition from long-range to short-range mobility of the charge carriers with increasing photon energy hυ. The low-energy region of the M 2 peaks represents the range in which the charge carriers (ions) are mobile over long distances, i.e., ions can perform successful hopping from one site to the neighboring site. Whereas the high-energy region represents the range in which the charge carriers are confined to the potential wells, i.e., they are mobile over short distances and the ions can perform localized motion within the well.
Figure 6c and d presents the variation of the real (Z 1) and imaginary (Z 2) parts of the complex impedance versus photon energy hυ. It can be noted that the plots of Z 1 and Z 2 as a function of hυ for the present compositions (x = 1.50, 1.88 and 2.17) show the same behavior with broad peaks. This behavior indicates the occurrence of relaxation processes in the studied samples. All these results indicate that the difference in electronegativity between Sr and Pb plays a fundamental role in the variation of the bandgap and the optical properties.
4 Conclusions
Using powder XRD and UV–visible spectroscopy techniques at room temperature, we report the crystal structure and optical properties of Sr3−x
Pb
x
Fe2TeO9 ceramics with x = 1.50, 1.88 and 2.17. Rietveld refinement analysis of the XRD data reveals that x = 1.50 and 1.88 adopt a tetragonal phase (space group I4/mmm), and it also reveals that x = 2.17 adopts a hexagonal phase (space group R
-
Author contributions: All the authors have accepted responsibility for the entire content of this submitted manuscript and approved submission.
-
Research funding: None declared.
-
Conflict of interest statement: The authors have no conflicts of interest to declare that are relevant to the content of this article.
References
1. El Hachmi, A., Manoun, B., Tamraoui, Y., Mirinioui, F., Abkar, R., Saadoune, I., Sajieddine, M., Lazor, P. J. Mol. Struct. 2017, 1141, 484–494. https://doi.org/10.1016/j.molstruc.2017.03.118.Suche in Google Scholar
2. Riyaz, F., BhaiPushpa, V. L., Sukumaran, V. Int. J. Mater. Res. 2021, 112, 975–979. https://doi.org/10.3139/146.111953.Suche in Google Scholar
3. El Hachmi, A., Manoun, B., Tamraoui, Y., Louihi, S., Bih, L., Sajieddine, M., Lazor, P. J. Struct. Chem. 2020, 61, 861–872. https://doi.org/10.1134/S0022476620060049.Suche in Google Scholar
4. Ivanov, S. A., Eriksson, S. G., Tellgren, R., Rundlöf, H. Mater. Res. Bull. 2004, 39, 2317–2328. https://doi.org/10.1016/j.materresbull.2004.07.025.Suche in Google Scholar
5. Palkar, V. R., Malik, S. K. Solid State Commun. 2005, 134, 783–786. https://doi.org/10.1016/j.ssc.2005.01.032.Suche in Google Scholar
6. Wood, V. E., Austin, A. E. Int. J. Magn. 1974, 5, 303–315. https://doi.org/10.1038/248303a0.Suche in Google Scholar
7. Brixel, W., Rivera, J. P., Steiner, A., Schmid, H. Ferroelectrics 1988, 79, 201–204. https://doi.org/10.1080/00150198808229431.Suche in Google Scholar
8. Martinez, R., Palai, R., Huhtinen, H., Liu, J., Scott, J. F., Katiyar, R. S. Phys. Rev. B 2010, 82, 134104. https://doi.org/10.1103/PhysRevB.82.134104.Suche in Google Scholar
9. Jeong, I. K., Ahn, J. S., Kim, B. G., Yoon, S., Singh, S. P., Pandey, D. Phys. Rev. B 2011, 83, 064108. https://doi.org/10.1103/PhysRevB.83.064108.Suche in Google Scholar
10. Retuerto, M., Skiadopoulou, S., Li, M. R., Abakumov, A. M., Croft, M., Ignatov, A., Sarkar, T., Abbett, B. M., Pokorný, J., Savinov, M., Nuzhnyy, D., Prokleška, J., Abeykoon, M., Stephens, P. W., Hodges, J. P., Vaněk, P., Fennie, C. J., Rabe, K. M., Kamba, S., Greenblatt, M. Inorg. Chem. 2016, 55, 4320–4329. https://doi.org/10.1021/acs.inorgchem.6b00054.Suche in Google Scholar PubMed
11. Ramer, O. G. J. Opt Commun. 1981, 2, 122–127. https://doi.org/10.1515/JOC.1981.2.4.122.Suche in Google Scholar
12. El Hachmi, A., El Bachraoui, F., Louihi, S., Tamraoui, Y., Benmokhtar, S., Bih, L., Sajieddine, M., Lazor, P., Manoun, B. J. Inorg. Organomet. Polym. 2020, 30, 1990–2006. https://doi.org/10.1007/s10904-020-01446-4.Suche in Google Scholar
13. Scherrer, P. Nachr. Ges. Wiss. Göttingen Math.-Phys. Kl. 1918, 26, 98–100.Suche in Google Scholar
14. Williamson, G. K., Hall, W. H. Acta Metall. 1953, 1, 22–31. https://doi.org/10.1016/0001-6160(53)90006-6.Suche in Google Scholar
15. Kim, K. H., Park, K. C., Ma, D. Y. J. Appl. Phys. 1997, 81, 7764. https://doi.org/10.1063/1.365556.Suche in Google Scholar
16. Tauc, J., Ed. The Optical Properties of Solids; Academic Press: New York, 1966.Suche in Google Scholar
17. Kubelka, P., Munk, F. Z. Tech. Phys. 1931, 12, 593–601.Suche in Google Scholar
18. Fox, M. Optical Properties of Solids; Oxford University Press: New York, 2001.Suche in Google Scholar
19. Abeles, F. Optical Properties of Solids; North-Holland Publishing: Amsterdam–London, 1972.Suche in Google Scholar
20. Omari, L. H., Lemziouka, H., Moubah, R., Haddad, M., Lassri, H. Mater. Chem. Phys. 2020, 246, 122810. https://doi.org/10.1016/j.matchemphys.2020.122810.Suche in Google Scholar
21. Hodgson, J. N. Optical Absorption and Dispersion in Solids; Chapman & Hall: London, 1970.10.1007/978-1-4613-3321-0Suche in Google Scholar
22. Davis, E. A., Mott, N. Philos. Mag. A 1970, 22, 0903–0922. https://doi.org/10.1080/14786437008221061.Suche in Google Scholar
23. Chen, L. F., Ong, C. K., Neo, C. P., Varadan, V. V., Varadan, V. K. Microwave Electronics: Measurement and Materials Characterization; Wiley: Chichester, 2004.10.1002/0470020466Suche in Google Scholar
24. Wemple, S. H., DiDomenico, M.Jr Phys. Rev. B 1971, 3, 1338. https://doi.org/10.1103/PhysRevB.3.1338.Suche in Google Scholar
25. Salem, A. M. Appl. Phys. A 2002, 74, 205–211. https://doi.org/10.1007/s003390100877.Suche in Google Scholar
26. Urbach, F. Phys. Rev. 1953, 92, 1324. https://doi.org/10.1103/PhysRev.92.1324.Suche in Google Scholar
27. Bassani, F., Scandolo, S. Phys. Rev. B 1991, 44, 8446. https://doi.org/10.1103/PhysRevB.44.8446.Suche in Google Scholar
28. Lines, M. E. Phys. Rev. B 1990, 41, 3372. https://doi.org/10.1103/PhysRevB.41.3372.Suche in Google Scholar PubMed
29. Wynne, J. J. Phys. Rev. 1969, 178, 1295. https://doi.org/10.1103/PhysRev.178.1295.Suche in Google Scholar
30. Bourguiba, F., Dhahri, A., Tahri, T., Taibi, K., Dhahri, J., Hlil, E. K. Bull. Mater. Sci. 2016, 39, 1765–1774. https://doi.org/10.1007/s12034-016-1305-9.Suche in Google Scholar
31. El Hachmi, A., Manoun, B., Sajieddine, M., Tamraoui, Y., El Ouahbi, S. Polyhedron 2021, 200, 115133. https://doi.org/10.1016/j.poly.2021.115133.Suche in Google Scholar
32. Sharma, S., Shamim, K., Ranjan, A., Rai, R., Kumari, P., Sinha, S. Ceram. Int. 2015, 41, 7713–7722. https://doi.org/10.1016/j.ceramint.2015.02.102.Suche in Google Scholar
33. Hodge, I. M., Ingram, M. D., West, A. R. J. Electroanal. Chem. Interfacial Electrochem. 1976, 74, 125–143. https://doi.org/10.1016/S0022-0728(76)80229-X.Suche in Google Scholar
© 2022 Walter de Gruyter GmbH, Berlin/Boston
Artikel in diesem Heft
- Frontmatter
- Review
- Preparations and applications of organic conducting polymers/graphene composites in heavy metal ion sensing: a review
- Original Papers
- Complex dielectric, electric modulus, impedance, and optical conductivity of Sr3−x Pb x Fe2TeO9 (x = 1.50, 1.88 and 2.17)
- Complex permittivity and predominance of non-overlapping small-polaron tunneling conduction process in copper indium selenide compound
- Effect of Bacillus and Pseudomonas biofilms on the corrosion behavior of AISI 304 stainless steel
- Fabrication of magnesium oxide nanoparticles using Eucalyptus tereticornis seed extract and their characterisation
- Greener route for synthesis of cerium oxide and Fe-doped cerium oxide nanoparticles using acacia concinna fruit extract
- Phase equilibria of Ni–Al–Pd and Ni–Cr–Pd ternary systems and Ni–Al–Cr–Pd quaternary system at 1423 K
- Effect of grain size on oxidation behaviour of Ag-20Cu-30Cr alloys in 0.1 MPa pure O2 at 700 and 800 °C
- News
- DGM – Deutsche Gesellschaft für Materialkunde