Calculation of the Combined Heat Transfer Coefficient of Hot-face on Cast Iron Cooling Stave Based on Thermal Test
-
Feng-guang Li
 ,
Jian-liang Zhang
,
Jian-liang Zhang

Abstract
Cooling effects of the cast iron cooling stave were tested with a specially designed experimental furnace under the conditions of different temperatures of 800 °C, 900 °C, 1,000 °C and 1,100 °C as well as different cooling water velocities of 0.5 m·s–1, 1.0 m·s–1, 1.5 m·s–1 and 2.0 m·s–1. Furthermore, the combined heat transfer coefficient of hot-face on cast iron cooling stave (αh−i) was calculated by heat transfer theory based on the thermal test. The calculated αh−i was then applied in temperature field simulation of cooling stave and the simulation results were compared with the experimental data. The calculation of αh−i indicates that αh−i increases rapidly as the furnace temperature increases while it increases a little as the water velocity increases. The comparison of the simulation results with the experimental data shows that the simulation results fit well with the experiment data under different furnace temperatures.
Introduction
The nodular cast iron cooling stave is the most widely applied cooling stave in blast furnace system and the blast furnace life is determined by the heat transfer performance of the cast iron cooling stave to some extent [1]. The heat transfer performance is usually evaluated by thermal test or industrial experimentation which are complicated in implementation procedure and cost much [2, 3]. The numerical simulation is a good way to acquire the temperature field of different types of cooling stave under different working conditions, and then the heat transfer performance of the cooling staves can be evaluated [4, 5]. In the simulation of the temperature field of the cooling stave, the combined heat transfer coefficient of hot-face on cooling stave (αh) is the most important parameter and a lot work about it have been carried out. Heinrich et al. [6] found that the αh of copper cooling stave is 232 W·m–1·°C–1 when the furnace temperature is 871 °C. Qian et al. [7] indicated that the αh of copper cooling stave is 320 W·m–1·°C –1 when the furnace temperature is 1,200 °C. Zheng et al. [8] calculated the αh of copper cooling stave based on the thermal test results, and their works implied that the αh of copper cooling stave is 336 W·m–1·°C –1 under the furnace temperature of 1,200 °C and it increases with the increase of furnace temperature. However, the above researches were done aimed at copper cooling stave. The temperature distribution of the cast iron cooling stave differs widely from the copper cooling stave when it works in the blast furnace, therefor the αh of cast iron cooling stave is different with that of copper cooling stave [9]. A•C•Пляшкевич et al. [10] calculated the combined heat transfer coefficient of the furnace lining in an actual furnace under different furnace temperatures and their work indicated that the combined heat transfer coefficient of furnace lining increases rapidly with the increase of furnace temperature.
According to the previous works, the combined heat transfer coefficient of hot-surface on cast iron stave (αh−i for short in this paper) is a parameter that changes with the variation of furnace temperature and it has not been measured. In this paper, a thermal test of cast iron cooling stave has been done and the αh−i under different furnace temperatures have been calculated with heat transfer theory based on the experimental results. The gained values of αh−i have been used in numerical simulation of the cast iron cooling stave and the simulation results match well with the experimental data.
Thermal test of the cast iron cooling stave
Experimental equipment and procedure
The experiment was accompanied with a large thermal test system for cooling staves. There are three sub-systems in the thermal test system which includes (Figure 1):
Heating furnace system where the cooling stave was installed and heated. Two high power gasoil burner was used in the furnace and a 200 mm thick checker brick layer was arranged above the burner to homogenize the furnace temperature.
Water-cooling system. There are four water inlet pipe and correspondingly four water outlet pipe. In each of the water pipe, electromagnetic flowmeter, thermocouple and pressure transmitter are installed to gather the information of water flow, water temperature and water pressure.
Information collection system. Two sets of intelligent digital inspection instrument are applied in the information collection system, which can record the information from the sensors by every second.

Thermal test system of cooling stave.
The size of the experimental cast iron cooling stave is 1,680 mm (height)×800 mm (width). On the hot surface of the cooling stave, dovetail grooves of 80 mm (width)×100 mm (depth) are equally arranged and filled with silicon carbide material. The overall thickness of the experimental cooling stave is 240 mm. There are four water pipes in the cooling stave and the outer diameter of each pipe is 60 mm with a pipe thickness of 6 mm. A series of thermocouples are arranged in the cooling stave body to measure its temperature distribution.
The main experimental procedures are as follows:
Keep the water velocity constant and change the furnace temperature. In this part, the water velocity is adjusted to 1.2 m·s–1 and remains unchanged, and then the power of the gasoil burner is regulated to promote the furnace temperature to a certain value and keep for a period of time. When the temperature data of the thermocouples reach steady state, the experimental information is recorded and then the power of the gasoil burners is changed to improve the furnace temperature to next grade. The temperature grades of furnace are shown in Table 1.
Keep the furnace temperature constant and change the water velocity. In this part, the furnace temperature is kept at 1,100 °C, and then the water velocity is regulated to 2.0 m·s–1 and keep for a period of time. When the temperature data of the thermocouples reach steady state, the experimental data is recorded and then the water velocity is reduced to next grade. The water velocity grades are shown in Table 2.
Testing program of constant water velocity and different furnace temperature.
| Water velocity/(m·s–1) | Furnace temperature/°C |
|---|---|
| 1.2 | 800 |
| 900 | |
| 1,000 | |
| 1,100 |
Testing program of constant furnace temperature and different water velocity.
| Furnace temperature/°C | Water velocity/(m·s–1) |
|---|---|
| 1,100 | 2.0 |
| 1.5 | |
| 1.0 | |
| 0.5 |
Experimental results and discussion

Influence of furnace temperature on temperature distribution of cooling stave.
The temperature of the stave body in different depth under the conditions of different furnace temperatures (800 °C, 900 °C, 1,000 °C, 1,100 °C) and constant water velocity (1.2 m·s–1) is shown in Figure 2. In Figure 2, the insertion depth (namely the distance away from the stave cold-face) of the thermocouple A1, A2, A3, A4 is 19 mm, 71 mm, 146 mm and 236 mm respectively. Since the distance away from the stave cold-face of thermocouple A1 is 19 mm and the distance away from the stave hot-face of thermocouple A4 is 4 mm, the temperature of A1 and A4 is regarded as the temperature of the stave cold-face and stave hot-face respectively. Take the curve of 1,100 °C in Figure 2 as an example, at the area near the stave cold-face, from A1 to A3, the temperature increases from 229 °C to 413 °C as the distance away from stave cold-face increases from 19 mm to 146 mm. Relatively, at the hot side of the cooling stave, from A3 to A4, the temperature of stave body increases from 413 °C to 802 °C while the distance away from the stave cold-face changes from 146 mm to 236 mm. Then it can be concluded that the temperature gradient of the stave body near the cold-face is smaller that near the hot-face, and this conclusion can also be drawn according to the regression function of the curve, as shown in eq. (1). In eq. (1), Tc-1,100 is the temperature of thermocouples under the condition of furnace temperature 1,100 °C, d is the thermocouple insertion depths from cold-face.
Meanwhile, the temperature of the both stave cold-face and the stave hot-face increases when the furnace temperature increases, and the increase rate of stave hot-face is obviously higher than that of stave cold-face. When the furnace temperature increases from 800 °C to 1,100 °C, the temperature of stave cold-face (A1) increases from 118 °C to 229 °C (the total growth is 111 °C) while the temperature of stave hot-face (A4) increases from 453 °C to 802 °C (the total growth is 349 °C). The experimental result of this paper is quite different from the reported experimental result of copper cooling staves. The previous researches have pointed out that the temperature of the cold-face of the copper cooling stave will not be higher than 60 °C under the conditions of furnace temperature from 900 °C to 1,200 °C, and the temperature of the hot-face of the copper stave varies from 40 °C to 180 °C [11, 12].
The above analysis indicates that the temperature of the cold-face and hot-face of cast iron cooling stave differs much from that of the copper cooling stave even they work under the same condition. The temperature of the cold-face and hot-face of cast iron cooling stave is much higher than that of the copper cooling staves. That is to say, the temperature distribution characteristics of the two kinds of cooling stave are different.

Influence of water velocities on temperature distribution of cooling stave.
The temperature of the stave body in different depth under the conditions of different water velocities (0.5 m·s–1, 1.0 m·s–1, 1.5 m·s–1, 2.0 m·s–1) and constant furnace temperature (1,000 °C) is shown in Figure 3. When the water velocity is increased from 0.5 m·s–1 to 2.0 m·s–1, the temperature of stave cold-face decreases from 214 °C to 188 °C (the total decline is 26 °C) while the temperature of stave hot-face decreases from 696 °C to 683 °C (the total decline is 13 °C). The above data implies that higher water velocity will contribute to reduce the temperature of stave body, but the reduce rate is very low. That is to say, the influence rule of water velocity on cast iron cooling stave gained in this paper is consistent with the reported result of copper cooling stave.
Calculation of the combined heat transfer coefficient of hot-face on cast iron cooling stave
A heat balance analysis of the cast iron cooling stave has been done (as shown in Figure 4) and it can be described as the following equation:
where Qa is the heat exchanged by convection between the stave cold-face and air per unit time, W; Qw is the heat taken away by cooling water per unit time, W; Qg is the heat exchanged by convection between the stave hot-face and furnace atmosphere per unit time, W; Qr is the heat exchanged by radiation between the stave hot-face and furnace atmosphere per unit time, W.

Schematic diagram of the heat balance of cast iron cooling stave.
The Qa, Qw, Qg and Qr in eq. (2) are calculated by the following equations:
In eqs (3–6), αa is the convection heat transfer coefficient between the cold-face of the cooling stave and air, W·m–2°C–1; A is the area of the cast iron cooling stave, m2; Tc is the temperature of the stave cold-face, °C; Ta is the temperature of air contact with the stave cold-face, °C; c is the specific heat capacity of water, J·kg–1·℃–1; ρ is the density of water, kg·m–3; v is the water velocity, m·s–1; F is the total radial cross-sectional area of the four water pipes, m2; Tin and Tout are the temperatures of the inflow water and outflow water respectively, °C; αg is the convection heat transfer coefficient between the stave hot-face and furnace atmosphere, W·m–2·°C–1; Tg is the temperature of furnace gas contacting with the stave hot-face, °C; Th is the temperature of the stave hot-face, °C; C0 is the blackbody radiation coefficient, 5.67 W·m–2·°C–2; εg and εs are the blackness of furnace gas and the cast iron material, dimensionless.
Since the calculation of Qr in association with some immeasurable parameter like the blackness of furnace gas and stave body, the actual value of Qr could not be calculated. However, the sum of Qr and Qg is equal to the total input heat of the cooling stave, and the input heat Qin is equivalent to heat convection which can be calculated by eq. (7).
where Qin is the total input heat of cooling stave per unit time, W; αh−i is the combined heat transfer coefficient of hot-face on cast iron cooling stave. According to eqs (2–7), eq. (2) is equivalent to the following equation:
Then the combined heat transfer coefficient of hot-face on cast iron cooling stave (αh–i) can be calculated, as shown in eq. (9).
In eq. (9), c, ρ, F, A and Ta are constant for a certain cooling stave, while Tout, Tin, Tg, Th and Tc have been measured by thermal test of the cooling stave. αa is always generally calculated by empirical equation
The combined heat transfer coefficient of hot-face on cast iron cooling stave (αh−i) under different working condition could be calculated then by substituting the experimental data into eq. (9), and the calculated results are shown in Figures 5 and 6.

The combined heat transfer coefficient of hot-face on cast iron cooling stave under different furnace temperature conditions.
As shown in Figure 5, αh−i increases rapidly with the increase of furnace temperature, and the higher the furnace temperature is, the bigger αh−i is. The growth tendency of αh−i approximately follows a power function. The reason is, as the furnace temperature increases, the proportion of heat brought in by radiation become bigger. Equation (6) reveals that radiant heat is proportional to the fourth power of furnace temperature. When the furnace temperature reaches a certain high value, the radiant heat will accounted for most of the proportion of total input heat, which leads αh−i rising along a power function trend. The change rule of αh−i described in Figure 5 is in accordance with that of the practically measured combined heat transfer coefficient of furnace lining described in Figure 7 [10].

The combined heat transfer coefficient of hot-face on cast iron cooling stave under different water velocity conditions.

The practically measured data of the combined heat transfer coefficient in blast furnace under different furnace temperature conditions.
Figure 6 reveals that αh−i has a puny downward trend as the water velocity increases. When water velocity is 0.5 m·s–1, the value of αh−i is 228 W·m–2·°C–1. Since the water velocity rises to 2.0 m·s–1, the value of αh−i reduce to 207 W·m–2·°C–1, and the reduce rate is 9.2 %. Zheng et al. [11] indicated that the combined heat transfer coefficient of hot-face on copper cooling stave reduced from 337 W·m–2·°C–1 to 308 W·m–2·°C–1 when the water velocity increases from 1.0 m·s–1 to 2.3 m·s–1, and the reduce rate is 8.6 %. The influence rule of water velocity on αh−i is in accordance with the influence rule on copper cooling stave revealed by Zheng et al. The influence rule of water velocity on αh−i can be explained as follows: the increase of water velocity reduced the temperature of stave hot-face tinily which lead the value of (Tg–Th) increased by a small range, since the previous research works had showed that the heat flux of the cast iron cooling stave would not change with the water velocity [14], the total input heat Qin would be constant if the furnace temperature stayed stable, then the value of αh−i would decrease a little according to eq. (7).
The above analysis indicates that the furnace temperature has a great influence on αh−i while water velocity influences αh−i a little. To verify the accuracy of the calculation of αh−i, a temperature distribution simulation model of cast iron cooling stave has been founded in this paper, and the value of αh−i calculated in this paper and the previous value of αh−i (232 W·m–2·°C–1) are applied respectively in the model, and the simulation results of each are compared with the experimental data.
Comparison of the simulation results and experimental data
Temperature distribution model of cooling stave and the boundary conditions
In this paper, the heat transfer of cast iron cooling stave was treated as a steady-state process, therefore eq. (9) was used to describe this process:
In eq. (9), T is the temperature of cast iron cooling stave, °C; λ(t) is the heat conductivity of material, W·m–1·°C–1; x, y and z are the coordinates in rectangular coordinate system.
Consider of the symmetry of the cooling stave and in order to achieve high-precision grid, a 1/4 model of the cooling stave was founded, as shown in Figure 8. In this model, the boundary conditions are as follows:
The symmetry plane, up-down surface and side face of the cast iron cooling stave are regarded as adiabatic boundary.
The cold-face of the cooling stave is regarded as a convection heat transfer boundary;
The heat exchange between the inner surface of the water pipe and the cooling water is considered as convection heat transfer, and the convection coefficient has been given out by a previous research [15], which is 237 W·m–2·°C–1.
The heat exchange between the stave hot-face and the furnace gas is equivalent to convection heat transfer, where the values of αh−i calculated in this paper and the previous value of αh−i are used as the convection coefficient respectively.

The temperature distribution model of cast iron cooling stave.
Comparison of the results
The temperature distribution of the stave body using different values of αh−i has been given by the model, then the simulation results of the stave cold-face temperature and stave hot-face temperature were picked out and compared with the experimental data, as shown in Figures 9 and 10.
It can be concluded from Figures 9 and 10 that when applying the previous αh−i in simulation, the simulation result can only match the experimental result at the specific point of furnace temperature 1,100 °C; In other condition of different furnace temperature, there is a great difference between the simulation result and the experimental result, and the difference become bigger along with the decrease of furnace temperature. However, when using the value of αh−i calculated in this paper, the simulation result is in good agreement with the experimental result under different furnace temperature conditions.
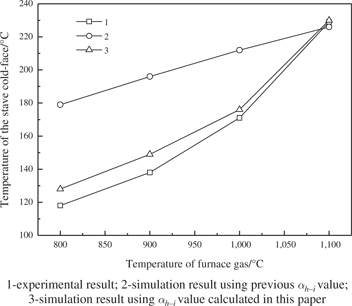
Comparison of the simulation results and experimental data of the hot-face temperature.

Comparison of the simulation results and experimental data of the cool-face temperature.
However, there is still deviation between the experimental results and the simulation results using αh−i calculated in this paper. To be specific, the simulation temperature is a little higher than the practically measured temperature on the stave cold-face while a little lower than the practically measured temperature on the stave hot-face. The deviation rate between the simulation temperature and the practically measured temperature on the stave cold-face is 7.8 %, 7.4 %, 2.8 % and 0.43 % respectively under the conditions of furnace temperature 800 °C, 900 °C, 1,000 °C, 1,100 °C, and correspondingly –2.9 %, –4.9 %, –3.6 %, 0.2 % (“–” means that the simulation result is lower than the experimental result) on the stave hot-face. The simulation error is caused by some unavoidable assumptions of the model. The up-down surface and side face of the cast iron cooling stave were regarded as adiabatic boundary in the model. However, the temperature of the furnace lining was higher than that of the stave body under the experimental condition on the hot side of the cooling stave, and a portion of heat were transferred into the cooling stave through its up-down surface and side face which promoted the temperature of the stave hot-face. Therefore, the simulation temperature was a little lower than the practically measured temperature on the stave hot-face. While on the cold side of the cooling stave, the temperature of stave body was in close proximity to that of the furnace lining, and the input heat through the up-down surface and side face of the cooling stave could be ignored. Nevertheless, the heat conductivity of the cast iron was thought to be constant under different temperature conditions in the model while it would practically decrease along with the growth of the temperature (the heat conductivity of the cast iron ranges from 25 to 42 W·m–1·°C–1 at 25 °C, and it decreases 1.0–1.5 W·m–1·°C–1 per 100 °C [16]). That is to say, the actual average heat conductivity of the stave body is slightly lower than that in the model. According to Fourier’s Law (
Conclusion
The heat transfer performance of cast iron cooling stave was measured under different conditions of various furnace temperatures and water velocities by thermal test. The result shows that the temperature of the stave body increases rapidly as the furnace temperature rises; the promotion of water velocity reduces the temperature of stave body, while the reduce rate is very low; the temperature distribution of cast iron cooling stave is quite different from that of the copper cooling stave.
The combined heat transfer coefficient of cast iron cooling stave (αh−i) was calculated based on experimental data. The result shows that αh−i increases along a power function trend with the increase of furnace temperature; αh−i decreases with the promotion of water velocity, but the reduction tendency is not that significant.
The calculated αh−i was used in temperature distribution model of the cast iron cooling stave and the simulation result is more accurate than that using the previous value of αh−i. Meanwhile, the simulation result using the calculated αh−i is highly in accordance with the experimental result.
References
[1] [1] Z.P. Zou, Z.Y. Xiang, Y.B. Ou, et al., Res. Iron Steel, 39 (2011) 38–42.Search in Google Scholar
[2] [2] D.Q. Cang, Y.B. Zong, Y.X. Mao, et al., J. Univ. Sci. Technol. Beijing (International), 10 (2003) 13–15.Search in Google Scholar
[3] [3] H.W. Pan, S.S. Cheng, D.F. Wu, et al., J. Univ. Sci. Technol. Beijing, 30 (2008) 419–423.Search in Google Scholar
[4] [4] L. Qian, S.S. Cheng, H.B. Zhao, J. Univ. Sci. Technol. Beijing (International), 15 (2008) 10–16.10.1016/S1005-8850(08)60003-1Search in Google Scholar
[5] [5] Z. Qian, Z.H. Du, L.J. Wu, Steel Res. Int., 78 (2007) 19–23.10.1002/srin.200705854Search in Google Scholar
[6] [6] P. Heinrich, H. Hille, H. Bachhofen, et al., Iron Steel Eng. (USA), 69 (1992) 49–55.Search in Google Scholar
[7] [7] Z. Qian, L.J. Wu, H.E. Cheng, et al., Iron Steel, 40 (2005) 21–23.Search in Google Scholar
[8] [8] J.C. Zheng, Y.B. Zong, D.Q. Cang, J. Univ. Sci. Technol. Beijing, 30 (2008) 938–941.Search in Google Scholar
[9] [9] W.G. Zhou, X. Xu, L.J. Wu, et al., J. Tongji Univ. (Nature Science), 36 (2008) 246–249.10.1016/j.heares.2008.09.006Search in Google Scholar PubMed PubMed Central
[10] [10] A.C. Пляшкевич, К.К. Стpелoв, A.C. фpeйденбepr. Стaлb,46 (1976) 209–214.Search in Google Scholar
[11] [11] J.C. Zheng, Y.B. Zong, D.Q. Cang, J. Iron Steel Res., 20 (2008) 9–11.Search in Google Scholar
[12] [12] H. Bai, D.Q. Cang, Y.B. Zong, et al., J. Univ. Sci. Technol. Beijing, 09 (2002) 258–261.Search in Google Scholar
[13] [13] N.Q. Xie, S.S. Cheng, J. Iron Steel Res. Int., 17 (2010) 1–6.10.1016/S1006-706X(10)60035-0Search in Google Scholar
[14] [14] T. Wu, S.S. Cheng, Ironmaking, 30 (2011) 451–457.Search in Google Scholar
[15] [15] F.G. Li, J.L. Zhang, H.B. Zuo, Foundry, 63 (2014) 391–395.Search in Google Scholar
[16] [16] H.Y. Fan, Z.H. Tang, W. Li, et al., Mater. Rev., 10 (1996) 23–25.Search in Google Scholar
©2017 by De Gruyter
This work is licensed under the Creative Commons Attribution 4.0 International License.
Articles in the same Issue
- Frontmatter
- Research Articles
- Kinetics and Tribological Characterization of Pack-Borided AISI 1025 Steel
- A Comparative Study of Hot Deformation Behaviors for Sand Casting and Centrifugal Casting Q235B Flange Blanks
- Effects of Annealing Temperature on the Microstructure and Mechanical Properties of Electrodeposited Ni-Fe Alloy Foils
- Thermochemical Approach for Screening of Alternative Metal Oxides as a Flame Retardant of Modacrylic Fiber
- Hot Corrosion Behavior of Stainless Steel with Al-Si/Al-Si-Cr Coating
- Calculation of the Combined Heat Transfer Coefficient of Hot-face on Cast Iron Cooling Stave Based on Thermal Test
- The Corrosion Behavior of Stainless Steel 316L in Novel Quaternary Eutectic Molten Salt System
- Corrosion of Nickel-Based Alloys in Ultra-High Temperature Heat Transfer Fluid
- Superplastic Behaviour of AZ61-F Magnesium Composite Materials
- Effects of Laser Shock Processing on Fatigue Performance of Ti-17 Titanium Alloy
- Effect of the Platinum Electroplated Layer Thickness on the Coatings’ Microstructure
- Structural and Microstructural Study on the Arc-Plasma Synthesized (APS) FeAl2O4–MgAl2O4 Transitional Refractory Compound
- Retraction
- Retraction of: Mechanical and Electrochemical Characterization of Super-Solidus Sintered Austenitic Stainless Steel (316L)