The Corrosion Behavior of Stainless Steel 316L in Novel Quaternary Eutectic Molten Salt System
-
Tao Wang


Abstract
In this article, the corrosion behavior of stainless steel 316L in a low melting point novel LiNO3-NaNO3-KNO3-NaNO2 eutectic salt mixture was investigated at 695 K which is considered as thermally stable temperature using electrochemical and isothermal dipping methods. The passive region in the anodic polarization curve indicates the formation of protective oxides layer on the sample surface. After isothermal dipping corrosion experiments, samples were analyzed using SEM and XRD to determine the topography, corrosion products, and scale growth mechanisms. It was found that after long-term immersion in the LiNO3-NaNO3-KNO3-NaNO2 molten salt, LiFeO2, LiFe5O8, Fe3O4, (Fe, Cr)3O4 and (Fe, Ni)3O4 oxides were formed. Among these corrosion products, LiFeO2 formed a dense and protective layer which prevents the SS 316L from severe corrosion.
Introduction
Molten salt has been considered as a potential candidate for thermal energy transfer fluid and metal heat treatment based on its large working temperature range, high heat capacity, excellent thermal stability, and low vapor pressure. In the actual thermal energy storage system, the molten salt heat transfer fluid (HTF) is transferred between hot tank and cold tank through the standard pipes made of stainless steel. As a result of that, the pipes encounter continuous flow of hot and cold molten salt every day, which makes the corrosion behavior evaluation of stainless steel in molten salt mixtures extremely essential. The corrosion of passivity materials when in contact with high temperature molten salt systems have been studied, which gives fundamental understanding of basic mechanism about the corrosion process [1–8].
The corrosion behavior of 800, 304, 316 stainless steels, Fe-Cr-Ni alloys and Ni free alloy steels in the most commonly used NaNO3-KNO3 eutectic molten salt mixture was determined at different temperatures [9–11]. The low corrosion rates found in the austenitic stainless steel is due to the production of protective oxide layer which cover the surface of sample and prevent any further corrosion. The main mechanism involved in the corrosion process is formation of oxides and dissolution of chromium. Based on the phases and elemental analyses, the corrosion products were found to be mainly Fe3O4, FeCr2O4 and NaFeO2. The presence of NaFeO2 in the corrosion product is due to the reaction between trace amounts of Na2O with Fe2O3. Other alloys used in the heat storage such as SS41, 0.25Cr–1Mo steel, SUS 304 and Inconel were also studied for their corrosion behavior in molten NaNO3-KNO3 mixture at 723 K and 823 K [12]. The multiple layer corrosion products of SS41 and 0.25Cr–1Mo steel consisted of FeO, Fe3O4, KFeO2 and Na2O-Fe2O3 whereas the corrosion products for SUS304 and Inconel contained well-adherent oxide layer consisting of iron, chromium and nickel. Besides the binary mixtures, the corrosion behavior of Fe-Ni-Cr alloys in an equi-molar LiNO3-NaNO3-KNO3 mixture was studied [13]. According to the XRD analyses, LiFeO2, Fe3O4 and Cr2O3 were present in the oxide scales as the major phases. The corrosion behavior of stainless steel when immersed in another ternary salt mixture HITEC® (NaNO3-NaNO2-KNO3) system was also evaluated [14] and the corrosion rate was found to be affected by the protective oxide layer. In most cases, the alloys having more than 10 wt% chromium exhibit relatively high resistance to corrosion in molten salts.
To increase the energy storage density and performance of heat transfer fluid in the energy storage application, several novel salt mixtures such as LiNO3-NaNO3-KNO3-KNO2 [15], LiNO3-NaNO3-KNO3-MgKN system [16] and LiNO3-NaNO3-KNO3-NaNO2 [17] were proposed which have much lower melting points compared to the existing NaNO3-KNO3 solar salt and NaNO3-NaNO2-KNO3 HITEC® salt. Before actual utilization of these novel molten salt systems in the energy storage system, compatibility between stainless steel which is considered as the pipe constructing material and the molten salts should be examined. Therefore, in the present work, the corrosion behavior of SS316L stainless steel when in contact with novel LiNO3-NaNO3-KNO3-NaNO2 quaternary system was investigated at high temperature, using the electrochemical method and isothermal dipping method. After corrosion experiments, the test samples were analyzed using scanning electron microscopy (SEM) equipped with energy dispersive spectrometer (EDS) and x-ray diffraction (XRD) techniques to determine the topography and corrosion products.
Experimental
Materials and salt preparation
Eutectic salt mixture in the LiNO3-NaNO3-KNO3-NaNO2 system is used as the electrolyte in the present study and its properties are given in Table 1. The novel quaternary system was synthesized by mixing corresponding amounts of as-received (99 % pure) salt components purchased from Alpha Aesar® Company without further purification. The eutectic salt mixture was mechanically mixed inside the Pyrex beaker for approximately 10 min. Then, the mixture was heated to 473 K and kept at that temperature for 1 h before being heating it to the desired temperature.
Composition of LiNO3-NaNO3-KNO3-NaNO2 quaternary eutectic melt.
| Component | Composition (wt%) |
|---|---|
| LiNO3 | 17.5 |
| NaNO3 | 14.2 |
| KNO3 | 50.5 |
| NaNO2 | 17.8 |
| Melting point | 372 K |
| Heat capacity | 1.66 J/g.K |
| Density | 1.72 g/cm3 |
| Heat transfer capability | 1,143 MJ/m3 |
Both SS316L rods and coupons were used as test samples in the corrosion experiments. The SS316L rod was machined to the dimension of 12 mm diameter with 30 mm length and only its bottom surface was exposed to the novel quaternary molten salt in the electrochemical corrosion test. In the isothermal dipping corrosion test, SS316L coupons with dimensions of 13 mm×10 mm×1 mm were completely immersed in the molten salt under controlled condition to investigate the corrosion behavior and products after certain time of exposure.
Electrochemical tests
In the electrochemical test, the 3-port spherical flask was used as corrosion cell and covered with thermal insulator to homogenize the temperature inside. The working electrode is the stainless steel sample, which goes through the central port of the cell. Two platinum wires of 0.5-mm diameter were used as the counter electrode and reference electrode. The platinum reference electrode was inserted into working LiNO3-NaNO3-KNO3-NaNO2 molten salt and contained in Pyrex glass tube with one small hole on the end. Before the experiment, the flask corrosion cell was cleaned by acetone and dried.
All electrochemical experiments were monitored by EG&G Princeton Applied Research 273A Potentiostat/Galvanostat instrument which is connected and controlled by a dedicated computer. The potential in the experimental process is detected and collected continuously once the test sample was immersed. The data is analyzed by potentiostat software. The temperature inside the molten salt was measured by thermocouple and read from the data acquisition software Chartview® in personal computer. The potential scanning range is set from –1.8 V to 0.1 V with respect to the Ecorr and the scanning rate is fixed to 10 mV/min.
Isothermal dipping test
The isothermal corrosion tests of stainless steel 316L were conducted in the eutectic LiNO3-NaNO3-KNO3-NaNO2 quaternary molten salt at 695 K which is considered as the thermally stable temperature for the molten salt [17]. The salt mixture was contained and melted in Pyrex crucible. To achieve uniform temperature distribution inside the molten salt, the entire set-up was hung in the middle of the box furnace and covered by insulation materials as illustrated in Figure 1. The temperature of the molten salt was measured at 695 K using K-type thermocouples from 3 to 4 spots of the bottom of crucible and the deviation was maintained within ±1.0 % using the data acquisition software Chartview®. After certain immersion time, the samples were taken out of the crucible and the corrosion products covering the surface of the sample extracted from the molten salt were analyzed by using X-ray diffraction (XRD) and Scanning Electron Microscope (SEM) techniques. Also, the corroded samples were cast into conductive chlorine-free epoxy and the cross sections were ground with 180-, 320-, 600- and 1200- grit SiC – grinding paper and polished to mirror-finished surface before study the corrosion attack from the scale thickness.

Experimental set-up for isothermal dipping corrosion test.
Results and discussion
Study of polished SS316L sample
Before the corrosion test, the morphology of SS316L sample surface was examined using SEM and the results have been shown elsewhere [18]. The polished sample surface presents smooth and uniform colored appearance without any obvious defects. The elemental composition of the alloy sample before the corrosion experiment was detected using the EDS and listed in Table 2. By comparing with the standard SS316L, the identical elemental composition of the test coupon indicates the accurate initial composition.
Elemental composition of the as-received SS316L stainless steel coupon surface.
| Element | Min (wt%) | Max (wt%) | Measured (wt%) |
|---|---|---|---|
| C | – | 0.03 | 0 |
| Mn | – | 2 | 0.22 |
| Si | – | 0.75 | 0 |
| P | – | 0.05 | 0 |
| S | – | 0.03 | 0 |
| Cr | 16 | 18 | 16.55 |
| Mo | 2 | 3 | 2.17 |
| Ni | 10 | 14 | 10.26 |
| N | – | 0.1 | 0 |
Study of potentiodynamic polarization
The potentiodynamic polarization curve of SS316L in the molten eutectic salt mixture at 695 K is shown in Figure 2. The potential was scanned with respect to the platinum reference electrode with a scanning rate of 10 mV/min. In the cathodic region, the smooth polarization curve implies the simple transformation inside the molten salt, which can be expressed as the anodic and cathodic reactions given below:
Cathodic polarization region:

The potentiodynamic polarization curve of SS316L in the molten eutectic salt mixture at 695 K.
The above reactions were demonstrated by accumulation of gas bubbles on the counter electrode in the cathodic polarization process.
In the anodic region, the passivation of alloy occurs with typical active-passive corrosion behavior. The passive region in the anodic polarization curve indicates the formation of protective oxides layer on the sample surface. The electrode reactions that occurred in this period are shown as follows:
Anodic polarization region:
On the basis of the electrode reactions described above, Fe2O3 was formed in the anodic region and the passivation can be mainly attributed to the LiFeO2 layer which is found protective and insoluble in molten salts [19–21]. After the passive region, the alloy was fully passivated. No corrosion was observed at the platinum electrode after the electrochemical corrosion test.
As illustrated in Figure 2, the tafel extrapolation cannot be applied to determine the anodic and cathodic tafel slopes and corrosion current density due to the lack of clear linear Tafel regime. As a result of that, the accurate current density calculation is not possible. To determine the corrosion mechanism and behavior, long-term dipping test was conducted at 695 K for the SS316L coupon.
Scanning electron microscope/energy dispersive spectrometer analysis
The samples extracted from the molten salt at each time interval were investigated using scanning electron microscope (SEM) and energy dispersive spectrometer (EDS). Figure 3(a) shows the morphology of the corroded sample at 695 K after 748 h immersion in molten salt. It is evident that the oxide layer formed directly onto the surface of SS316L and the surface was roughened. High magnification micrograph of corroded sample is shown in Figure 3(b) which illustrates that the oxide crystals pack together and form oxide film. The elemental composition distribution was determined using the EDX spot analysis on the corroded sample surface. The atomic percentage of each element was listed in Table 3 which reveals that the sample surface was corroded uniformly according to the very similar elemental compositions between any two arbitrarily selected testing spots. By comparing the cation distributions before and after the 748 h immersion with the average element ratio of Fe:Cr:Ni=7.25:1.82:1.00 and Fe:Cr:Ni=11.25:2.64:1.00, respectively, it is indicated that more Fe and Cr elements diffuse outward and form oxides covering the surface. Moreover, the higher Fe/Cr ratio after the immersion is possibly attributed to the formation of lithium iron oxides and iron oxides which contain no chromium element at the outermost oxide layer. The presence of lithium iron oxide is consistent with the description in Section “Study of potentiodynamic polarization”. The morphologies of the corroded sample surfaces with longer immersion time are shown in Figure 4.
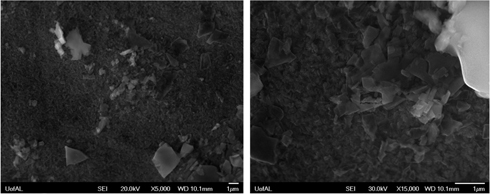
Scanning electron micrograph of products adherent on the surface of SS316L after immersion in LiNO3-NaNO3-KNO3-NaNO2 molten salt after 748 h (a) 5000× magnification (b) 15000× magnification.
Elemental composition of the SS316L stainless steel coupon surface after 748 h immersion in LiNO3-NaNO3-KNO3-NaNO2 molten salt.
| Element | Atomic% | |
|---|---|---|
| Before | After | |
| O | 0 | 62.69 |
| Si | 0 | 0.54 |
| Cr | 17.85 | 6.37 |
| Mn | 0.22 | 0.64 |
| Fe | 71.91 | 27.11 |
| Ni | 9.75 | 2.41 |
| Mo | 1.27 | 0.25 |
| Fe/Cr | 3.98 | 4.26 |
| Fe:Cr:Ni | 7.25:1.82:1.00 | 11.25:2.64:1.00 |
It is observed that after 5,088 h, the sample surface was completely covered by thick oxide layer with some white color humps. As revealed in Figure 4(b), those humps are resulted from the coalescence and enrichment of densely stacked octahedral oxide crystals. The elemental composition distribution over the sample surface is given in Table 4. It is found that at 20 kV accelerating voltage, O and Fe are the major elements detected at each selected spot. However, only trace amounts of Cr and Ni were measured. The drastic decrease in amount of Cr and Ni compared to that shown in Table 4 reveals the thickening of the lithium iron oxide and iron oxide layers which were formed on the sample surface. When the accelerating voltage was increased to 30 kV, the detected amount of Ni and Cr also increased as shown in Table 4, which further verifies that the lithium iron oxide and iron oxide layers were formed at the outermost oxide layer followed by Ni/Cr containing scales.

Scanning electron micrograph of products adherent on the surface of SS316L after immersion in LiNO3-NaNO3-KNO3-NaNO2 molten salt after 5,088 h (a) 1000×magnification (b) 10000×magnification.
Elemental composition of the SS316L stainless steel coupon surface after 5,088 h immersion in LiNO3-NaNO3-KNO3-NaNO2 molten salt detected under 20 kV and 30 kV accelerating voltage.
| Element | Composition (atomic %) | |
|---|---|---|
| at 20 kV | at 30 kV | |
| O K | 69.54 | 68.02 |
| Si K | 0.14 | 0.27 |
| Cr K | 1.03 | 3.43 |
| Fe K | 28.56 | 26.38 |
| Ni K | 0.72 | 1.9 |
| Total | 100 | 100 |

XRD patterns for the SS 316L coupons extracted from LiNO3-NaNO3-KNO3-NaNO2 molten salt after (a) 48 h (b) 748 h (c) 5,088 h.
X-ray diffraction analysis
X-ray diffraction was used to identify the particular phases in the oxides layer for each sample with different immersion time. Figure 5(a) shows the XRD pattern for the SS 316L coupon immersed at 695 K in the molten salt for 48 h. Three major phases identified from the pattern are base alloy, Cr2O3 and Fe2O3. In the corrosion process, the active elements Fe and Cr were oxidized at high temperature. No obvious lithium iron oxides were detected in the sample after 48 h immersion, which implies that the formation reaction of lithium iron oxides cannot be activated within in a short period and the initial corrosion for the alloy sample is not passive.
According to the XRD pattern for the SS316L sample with 748 h exposure time in molten salt, as shown in Figure 5(b), it can be concluded that LiFeO2 and LiFe5O8 phases are synthesized simultaneously after certain time of immersion. The LiFeO2 detected is formed by the solid state reaction as shown below:
The most intense peak located at 43.4° in Figure 5(a) shrunk significantly in Figure 5(b) due to the growth of LiFeO2 which has surmount over the SS 316L base metal peak. Further consumption of Fe2O3 leads to the formation of LiFe5O8 on the basis of LiFeO2, and the reaction is expressed as follows:
Since the LiFeO2 is not soluble in the molten salt mixture, it can form dense and protective layer. Consequently, the continuous layer composed of octahedral oxide crystals that observed in the Section “Scanning electron microscope/energy dispersive spectrometer analysis” can be experimentally identified as the LiFeO2 protective layer. The peaks of Fe3O4 phase were also detected in the XRD pattern as shown in Figure 5(b). In Figure 5(b), the absence of Fe2O3 peaks can be explained by the reactions mentioned above which convert all the Fe2O3 in the forms of lithium iron oxides and spinel iron oxide.
The composition of oxide layers of sample with 5,088 h immersion time is presented in Figure 5(c), which exhibits LiFeO2, LiFe5O8, Fe3O4 and base alloy phases in the XRD pattern which were also observed in Figure 5(b). However, Cr2O3 phase vanishes along with the presence of FeCr2O4 observed in the pattern. It is indicated that the Cr2O3 was transferred to FeCr2O4 completely in the period between 748 h to 5,088 h. Also, the relative intensities of oxide phases increase with respect to that of base alloy, which implies that the oxide scales were thickened in the period. After 5,088 h, the SS 316L sample exhibits very similar XRD pattern as observed in Figure 5(c). It is revealed that after 5,088 h, the oxide scale development was almost stable due to the complete formation of dense and protective LiFeO2 oxide layer.
Study of cross-sectional SS316L sample
To quantitatively evaluate the development of each layer and the structure of the oxide scale, the cross-section of the sample was investigated. The cross sectional analysis of SS316L sample after 48 h exposure was performed. Since the formed oxide layer is too thin to be detected using neither SEM nor the cross sectional EDX, the result is not discussed in this section. The cross section of the sample after 748 h immersion was illustrated in Figure 6(a). The mean oxide scale thickness is 2.5 µm whereas the maximum thickness is 3.0 µm. The oxide scale exhibits non-uniform color distribution suggesting the presence of different phases in the scale. The shape of interface between the oxides on the surface and SS316L coupon indicates the penetration of molten salt into the base metal.

Cross section of SS316L sample after 748 h immersion in LiNO3-NaNO3-KNO3-NaNO2.
For the samples immersed in molten salt for 5,088 h, the cross section exhibits the structure as shown in Figure 7(a). The oxide scale adherent to the sample with 5,088 h exposure time demonstrates very dense and uniform appearance. It is most likely resulted from the well-developed the oxide layers after long time exposure in the molten salt. The mean thickness and maximum thickness of oxide scale in this case is measured to be 5.0 µm and 7.0 µm, respectively. Compared to the sample with 748 h immersion, the oxide scales were significantly thicken, which is consistent with the observation of XRD analysis as discussed in Section “X-ray diffraction analysis”.

Cross section of SS316L sample after 5,088 h immersion in LiNO3-NaNO3-KNO3-NaNO2.
To determine the structure of oxide scales, the line scan along the cross section of the sample was conducted. It is found that after 2,160 h immersion, different layers started to be separated within the oxide scale and the intensity distribution of each element along an arbitrarily selected line is shown in Figure 8. Intensity distribution of elements along the cross section varies significantly. Conversely, in the bulk alloy intensity of each element showed little variation as function of distance. Up on close observation of the elemental distribution, it can be seen that the intensities of O and Fe are predominant up to 1.7 µm oxide thickness with small intensity of Cr element. On the basis of that, it is reasonable to conclude the 1.7 µm layer located in the outermost scale can be composed of lithium iron oxides and Fe3O4. Moreover, the intensities of Fe and O increase as function of thickness initially with the same fashion from the surface to 0.7 µm thickness and gradually reach stable condition up to 1.0 µm. This relation suggests possible consistent ratio between Fe and O throughout the initial 1.0 µm. Below the 1.0 µm, the intensity of O drops, whereas that of Fe remains on almost the same level, which implies the decrease of ratio of O to Fe. It is known that the LiFeO2 is not soluble in molten salt and has high ratio of O to Fe, thus the outermost 1.0 µm is assumed to be dominated by LiFeO2, which is consistent with findings of other literatures [22]. On the basis of the stoichiometric ratios of Fe and O elements in LiFeO2, LiFe5O8, and Fe3O4, it is indicated that the oxide scale within the range from 1.0 µm to 1.7 µm is mainly composed of LiFe5O8 and Fe3O4. The intensity peak of Cr element was observed thereafter and some Ni element was detected at the end of the oxide scale. Hence, (Fe, Cr)3O4 and (Fe, Ni)3O4 phases were determined to have formed in this region from 1.7 µm to 4.0 µm. Since all the samples with longer exposure times in the molten salt follow the identical stacking sequence, the schematic of the oxide layer structure is illustrated in Figure 9.

Line scan of the cross section of SS316L sample after 2,160 h immersion in LiNO3-NaNO3-KNO3-NaNO2 with element distribution along the selected line.

Schematic of oxide scale structure of samples with 2,160 h or longer exposure times.
On the basis of the XRD and cross section analysis, the dense and protective LiFeO2 layer was formed which suggests the possible diffusion-controlled oxide formation mechanism. The elemental mapping method was used to determine the diffusion mechanism in the corrosion process and diffusion paths of elements. The elemental maps for the cross sections of samples after 48 h and 748 h exposure in molten salt are not discussed here because the oxide scales are too thin to be analyzed for the elemental distribution. Figure 10 is the elemental map for the sample with 2,160 h immersion. The oxygen enriched zone is found to be throughout the entire oxide scale. The Cr is enriched with some Ni at the lower portion of the oxide scale. Moreover, the Cr depleted zone is present underneath the oxide scale and the Ni enriched zone is demonstrated exactly in the same region. On the basis of the observation, it can be concluded that the Ni containing oxide, namely, (Fe,Ni)3O4 was formed by diffusion of Ni element from the metal substrate. The enrichment of the Cr towards to the outer layer suggests the selective diffusion mechanism in the corrosion process. The further diffusion towards to the outermost surface of the scale is inhibited by the protective LiFeO2 layer. Different from the Cr and Ni elements, Fe is depleted in the oxide scale. The depletion indicates the Fe element is partially dissolved to the molten salt. The elemental maps for the corroded sample with longer exposure time exhibit similar results.

Elemental mapping of the cross section of SS316L sample after 2,160 h immersion in LiNO3-NaNO3-KNO3-NaNO2.
Combining the results from XRD, cross-sectional line scan and elemental mapping, the major reaction in each time interval can be extrapolated in the following sequence:
Step #1(0–48 h):
Step #2 (48–748 h):
Step #3 (748–5,088 h):
Conclusions
The corrosion of stainless steel SS316L in a low melting point novel eutectic LiNO3-NaNO3-KNO3-NaNO2 salt mixture was investigated at 695 K using electrochemical method and isothermal dipping method. Long-term immersion of SS316L coupons in the LiNO3-NaNO3-KNO3-NaNO2 salt mixture resulted in the formation of LiFeO2, LiFe5O8, Fe3O4, (Fe, Cr)3O4 and (Fe, Ni)3O4 oxide scales on the surface. LiFeO2 formed a dense and protective layer which prevents the SS 316L from severe corrosion. Hence, the SS316L is considered to be compatible to work with the novel quaternary eutectic molten salt mixture.
Funding statement: U.S. Department of Energy (Grant/Award Number: ‘DE-FG36-08GO18153’).
Acknowledgment
The authors are pleased to acknowledge the financial support from Department of Energy (DOE) Grant No. DE-FG36-08GO18153 for this research project. We also thank the University of Alabama for providing the experimental facilities.
References
[1] A. Nishikata, H. Numata and T. Tsuru, Mater. Sci. Eng., A146 (1991) 15–31.10.1016/0921-5093(91)90265-OSearch in Google Scholar
[2] B.P. Mohanty and D.A. Shores, Corr. Sci., 46 (2004) 2893–2907.10.1016/j.corsci.2004.04.013Search in Google Scholar
[3] L.C. Olson, J.W. Ambrosek, K. Sridharan, M.H. Anderson and T.R. Allen, J. Fluorine Chem., 130 (2009) 67–73.10.1016/j.jfluchem.2008.05.008Search in Google Scholar
[4] T.-H. Lim, E.R. Hwang, H.Y. Ha, S.W. Nam, I.-H. Oh and S.-A. Hong, J. Power Sources, 89 (2000) 1–6.Search in Google Scholar
[5] C.S. Ni, L.Y. Lu, C.L. Zeng and Y. Niu, Corr. Sci., 53 (2011) 1018–1024.10.1016/j.corsci.2010.11.036Search in Google Scholar
[6] A. Hendry and D.J. Lees, Corr. Sci., 20 (1980) 383–404.10.1016/0010-938X(80)90007-4Search in Google Scholar
[7] J. Kolchakov, T. Tzvetkoff and M. Bojinov, Appl. Surf. Sci., 249 (2005) 162–175.10.1016/j.apsusc.2004.11.071Search in Google Scholar
[8] S.H. Goods, R.W. Bradshaw, M.R. Prairie and J.M. Chavez, SAND–94–8211, Sandia National Labs., Livermore, CA, Mar 1994.Search in Google Scholar
[9] S.H. Goods, J. Mater. Energy Sys., 5 (1983) 28–35.10.1007/BF02833504Search in Google Scholar
[10] R.W. Bradshaw, SAND80-8856, Sandia National Laboratories, Livermore, CA, 1980.Search in Google Scholar
[11] S.H. Goods, High Temperature Corrosion in Energy Systems, The Metallurgical Society of AIME (1985) 643–658.Search in Google Scholar
[12] A.A. Attia, A.H. Ali, A.N.A. Masri and A.M. Baraka, Mat.-Wiss. U. Werkstofftech., 30 (1999) 559–565.10.1002/(SICI)1521-4052(199909)30:9<559::AID-MAWE559>3.3.CO;2-TSearch in Google Scholar
[13] D.R. Boehme and R.W. Bradshaw, High Temp. Sci., 18 (1984) 39–51.Search in Google Scholar
[14] J.R. Keiser, J.H. Devan and E.J. Lawrence, J. Nucl. Mater., 85&86 (1979) 295–298.10.1016/0022-3115(79)90505-1Search in Google Scholar
[15] T. Wang, D. Mantha and R.G. Reddy, Energy Technology 2012: Carbon Dioxide Management and Other Technologies, TMS, March 11–15, 2012, Orlando, USA, (2012), pp. 73–84.10.1002/9781118365038.ch10Search in Google Scholar
[16] T. Wang, D. Mantha and R.G. Reddy, Thermochim. Acta, 551 (2013) 92–98.10.1016/j.tca.2012.09.035Search in Google Scholar
[17] T. Wang, D. Mantha and R.G. Reddy, Appl. Energ., 102 (2013) 1422–1429.10.1016/j.apenergy.2012.09.001Search in Google Scholar
[18] T. Wang and R.G. Reddy, Energy Technology 2014: Carbon Dioxide Management and Other Technologies, TMS, February 16–20, San Diego, USA, (2014), pp. 141–148.10.1002/9781118888735.ch18Search in Google Scholar
[19] P. Biedenkopf, M. Spiegel and H.J. Grabke, Electrochim. Acta, 44 (1998) 683–692.10.1016/S0013-4686(97)10191-8Search in Google Scholar
[20] T. Lim, E. Hwang, H. Ha, S. Nam, I. Oh and S. Hong, J. Power Sources, 89 (2000) 1–6.10.1016/S0378-7753(00)00376-1Search in Google Scholar
[21] S. Frangini and S. Loreti, J. Power Sources, 160 (2006) 800–804.10.1016/j.jpowsour.2006.04.068Search in Google Scholar
[22] D.R. Boehme and R.W. Bradshaw, High Temp. Sci., 18 (1984) 39–51.Search in Google Scholar
©2017 by De Gruyter
This work is licensed under the Creative Commons Attribution 4.0 International License.
Articles in the same Issue
- Frontmatter
- Research Articles
- Kinetics and Tribological Characterization of Pack-Borided AISI 1025 Steel
- A Comparative Study of Hot Deformation Behaviors for Sand Casting and Centrifugal Casting Q235B Flange Blanks
- Effects of Annealing Temperature on the Microstructure and Mechanical Properties of Electrodeposited Ni-Fe Alloy Foils
- Thermochemical Approach for Screening of Alternative Metal Oxides as a Flame Retardant of Modacrylic Fiber
- Hot Corrosion Behavior of Stainless Steel with Al-Si/Al-Si-Cr Coating
- Calculation of the Combined Heat Transfer Coefficient of Hot-face on Cast Iron Cooling Stave Based on Thermal Test
- The Corrosion Behavior of Stainless Steel 316L in Novel Quaternary Eutectic Molten Salt System
- Corrosion of Nickel-Based Alloys in Ultra-High Temperature Heat Transfer Fluid
- Superplastic Behaviour of AZ61-F Magnesium Composite Materials
- Effects of Laser Shock Processing on Fatigue Performance of Ti-17 Titanium Alloy
- Effect of the Platinum Electroplated Layer Thickness on the Coatings’ Microstructure
- Structural and Microstructural Study on the Arc-Plasma Synthesized (APS) FeAl2O4–MgAl2O4 Transitional Refractory Compound
- Retraction
- Retraction of: Mechanical and Electrochemical Characterization of Super-Solidus Sintered Austenitic Stainless Steel (316L)