Morphological Evolution of Low-Grade Silica Fume at Elevated Temperature
-
Junhong Chen


Abstract
To solve the environmental pollution problem caused by low-grade silica fume (SiO2, < 86 mass%) and further expand its application field, the morphological development of low-grade silica fume from room temperature to 900 °C in air was investigated using TG-DTA, SEM and TEM techniques. The structural development of silica fume was further analyzed using FT-IR and Raman spectrum. The results show that silica fume contains many defects of broken bands such as Si-O or ≡Si at room temperature. When exposed to the moister or water, the broken bonds tend to react with water and result in the formation of Si-OH and adjacent hydroxyl groups of Si-OH•OH-Si. At elevated temperature up to 900 °C, the structure of silica fume becomes compact due to the reconstruction of the broken bonds caused by the dehydration reaction.
Introduction
Silica fume is a powder by-product extracted from gases evaporated during the production process of silicon or ferrosilicon alloy. It is a very fine, non-crystalline and spherical powder with the particle size normally ranging from 0.1 to a few micrometers. The surface area measured by Brunauer–Emmett–Teller (BET) is reported to be around 20,000 m2/kg [1]. According to the content of SiO2, silica fume can be divided into high-grade with larger than 88 mass% SiO2 content and low-grade with no more than 85 mass% SiO2 content. Usually high-grade silica fume possesses good pozzolonicity and can be applied as an additive of concrete to improve the early and late strength [2, 3]. Moreover, high-grade silica fume can be applied to prepare high additional value products such as Si3N4 powders using carbothermal reduction nitridation method [4]. It can also be applied to prepare a novel form-stable composite phase change material (PCM), which is used as the latent heat thermal energy storage (LHTES) material in buildings [5]. However the application of the low-grade silica fume is greatly restricted due to the low SiO2 content. Especially in China, silicon and ferrosilicon alloy enterprises are usually located at remote areas. While the bulk density of silica fume is relatively low to be about 250–300 kg/m3, which bring difficulties for transportation. Therefore the low-grade silica fume is always abandoned as wastes. However the particle size of silica fume is in nano range, i. e. about 150 nm, which will aggravate the ambient particulate matter (PM) [6, 7] if released directly into the atmosphere. Statistically the low-grade silica fume accounts for a larger proportion. Therefore it is one of the hottest issues to make full use of the low-grade silica fume.
Aiming at solving the above problems, researchers try to purify it using hydrochloric acid or alkali solution treatment [8, 9]. However these methods are very complicate and thus are difficult to be adopted widely in industry. In addition, the usage of acid and alkali solution contaminates the environment. Some researchers try to add silica fume into concrete and refractory castables [10, 11, 12]. They focus on discussing the effect of silica fume on the microstructure and properties of the material. With the problem of resource and environment more and more serious, a new method to treat with the low-grade silica fume efficiently is a key issue for silicon and ferrosilicon alloy enterprises.
In this work, low-grade silica fume was treated using thermal method. The phase and microstructure development were characterized by the thermal gravimetric analysis (TG-DTA), X-ray diffraction analysis (XRD), scanning electron microscopy (SEM) and transmission electron microscopy (TEM). Fourier transform infrared spectroscopy (FT-IR) and Raman spectrum were also adopted to characterize the structural development during thermal treatment. By adopting these techniques, it provides a fundamental basis for the development of potential applications of low-grade silica fume.
Experimental
Silica fume containing about 83 mass% SiO2 is adopted in this work. The element compositions of silica fume are listed in Table 1. Such impurities as CaO, Fe2O3, MgO and Al2O3 etc. in the raw material are caused by the manufacturing process.
Chemical compositions of low-grade silica fume, mass%.
| SiO2 | MgO | Fe2O3 | CaO | Na2O | Al2O3 | Loss on ignition |
|---|---|---|---|---|---|---|
| 82.6 | 4.47 | 2.57 | 1.37 | 1.24 | 1.04 | 7.95 |
The reaction process was investigated using TG-DTA (Netzsch STA 499C, Netzsch, Germany) at the heating rate of 10 °C/min from room temperature to 1,200 °C in air. Silica fume of about 5 g was put into the combustion boat and then treated at different temperatures for 180 min at air atmosphere in a furnace. The phase of the calcined silica fume was characterized by XRD (Scintag, Sunnyvale, CA) with a TTRⅢ diffractometer equipped with CuKα radiation over a 2θ range from 10 to 90°. The morphology of the silica fume was observed by FE-SEM with the accelerating voltage of 20 kV. TEM is also adopted by a TECNAI-T 30 model instrument operated at an accelerating voltage of 300 kV. The structure development was characterized by FT-IR (Nicolet 5700) and Raman spectra (Horyba LabRAM HR Evolution).
Results and discussion
TG-DTA analysis
Figure 1 shows TG-DTA curves of low-grade silica fume from room temperature to 1,200 °C in air at the heating rate of 10 °C/min. The reaction process can be divided into three stages depending on temperature, i. e. 0–300 °C, 300–600 °C and 600–1,200 °C. In the first stage, the weight loss is up to 13 % and a big endothermic peak appears in the corresponding DTA curve, indicating the dehydration reaction of free water and adsorbed molecular water in the sample occurs. When temperature is increased to 300–600 °C, a continuous weight loss of 7 % is shown in TG curves. This can be ascribed to the reaction of carbon oxidation and other reactions. With temperature further increasing, TG curve becomes stable while the corresponding DTA curve appears a big exothermic peak at about 750 °C, indicating the reaction relating to the change of material structure takes place.

TG-DTA of low-grade silica fume from room temperature to 1,200 °C at the heating rate of 10 °C/min in air.
Phase and microstructure development
The photos of silica fume before and after heat treatment at different temperature are shown in Figure 2. It can be seen the appearance of the sample does not change obviously until 700 °C (as shown in figure b, c and d). When treated at 800 °C, the sample begins to shrink as shown in Figure 2(e). When the thermal treatment temperature is reached to 900 °C, the sample shrinks a lot to be compact as shown in Figure 2(f).

Photographs of low-grade silica fume before and after heat treated at different temperature for 180 min (a) untreated; (b) 300 °C; (c) 600 °C; (d) 700 °C; (e) 800 °C; (f) 900 °C.
The phase evolution of sample at different temperature is characterized by the XRD patterns as shown in Figure 3. It can be seen that amorphous silica is the main phase before thermal treatment, which is in agreement with the reported result [13]. When treated at 300 °C, 600 °C and 700 °C for 180 min respectively, no obvious change is observed compared with the sample before thermal treatment, indicating that there is no effect on the phase of silica fume at the temperature below 700 °C. When treated at 800 °C, the crystalline phase appears. With temperature further increasing to 900 °C, crystalline phase, i. e. cristobalite dominates. Therefore it can be concluded that the formation of crystal phase is the main reason of the appearance of the big exothermic peak at about 750 °C in DTA curve. In view of the effect of the impurities in the raw material, carbon and hydroxyl substance tends to be oxidized during the thermal treatment. Other impurities, i. e. CaO, Fe2O3, MgO and Al2O3 etc. do not affect the microstructure of silica fume until 1,100 °C [13]. Therefore the effect of impurities on the thermal treatment is not taken into consideration in this work.

XRD patterns of low-grade silica fume heat treated at different temperatures for 180 min.
The microstructure evolution of sample at different temperature is further investigated using SEM and TEM techniques. Figure 4 is the microstructure of silica fume before thermal treatment. It can be seen that silica fume is agglomerated spherical particles with the particle size of 300 nm or so. When silica fume is treated at 300 °C for 180 min, the microstructure does not change much and is similar to that before thermal treatment (Figure 5(a)). TEM analysis also indicates that the spherical shape remains while the edges of some tiny particles are merged to each other (Figure 5(b) and (c)). With temperature increasing to 600 °C, more tiny particles are adhered to each other while the sample remains the spherical shape with the size of about 300 nm (Figures 5(d)–(f)). The selected area electron diffraction (SAED) result inserted in Figure 5(f) indicates the sample is still an amorphous structure [14]. With temperature further increasing to 700 °C, the microstructure is similar to that treated at 300 °C and 600 °C (Figure 5(g)–(i)), demonstrating that there is no effect on the phase of silica fume below 700 °C. This is in agreement with the XRD results. Figure 5(j) is the SEM image of silica fume heated at 800 °C. More silica fume particles merge together and exhibit a more compacter structure. TEM analysis indicates that spherical particles begin to change into irregular forms (Figure 5(k)). At the same time, the appearance of disordered diffraction spots and the concentric circle of SAED inserted in Figure 5(l) indicate that the sample contains both crystalline and amorphous structures [15]. When the temperature increases to 900 °C, TEM images show that the spherical microstructure of sample disappears completely and is replaced by irregular forms. SAED image inserted in Figure 5(o) indicates the crystalline phase is formed. Combing with the XRD results, it can be concluded that amorphous SiO2 is transformed into the crystalline phase from 800 °C.

SEM image of low-grade silica fume before heat treated.

Microstructure of low-grade silica fume before and after heat treated at deferent temperature (a–c) 300 °C; (d–f) 600 °C; (g–i) 700 °C; (j–l) 800 °C; (m–o) 900 °C.
Structure development
FTIR analysis is applied to reveal the structural transformation of silicon fume before and after heat treatment as shown in Figure 6. For silica fume before thermal treatment, peaks at 469 cm−1, 802 cm−1 and 1,106 cm−1 show the strongest absorbance bands, which are the characteristic of nano SiO2 powder. The band at 469 cm−1 is the bending frequency of O-Si-O (δ(O-Si-O)). The band centered at 802 cm−1 is due to symmetric stretching of Si-O-Si (υs(Si-O-Si)) and the broad band at 1,106 cm−1 is attributed to asymmetric stretching frequency of Si-O-Si (υas(Si-O-Si)) [16]. Besides these, the small band at around 1,617 cm−1 also appears which is connected with O-H bending vibration of adsorbed water molecules. The broad peak at 3,435 cm−1 is attributed to the asymmetric stretching frequency of -OH groups and water on the surface which is hydrogened-boned to each other and silanols [17]. Magnification of band at 3,600–3,800 cm−1 exhibits some small while significant peaks (Figure 6(a)), which is corresponding to asymmetric stretching frequency of -OH groups (3,630 cm−1), mutually bonded Si-OH species (3,660 cm−1) and isolated SiO-H vibrations (3,730 cm−1) respectively [18]. The possibly reason is that the silica fume reacts with the water during storage or the heat-treatment conditions [19].

FT-IR spectra of low-grade silica fume before and after heat treated at deferent temperature (a); (b) magnification of bands around 3,600 cm−1 to 3,800 cm−1 for untreated silica fume.
When temperature is increased to 300 °C, the intensity of the absorption peaks at 3,435 cm−1 and 1,617 cm−1 decreases, indicating the dehydration reaction occurs. Thus the two neighboring silanols condensed into a siloxane bridge [20]. Because of the dehydration, the sample loses weight as shown in TG-DTA curves at around 300 °C. Further heated to 800 °C, the broad peak at 1,106 cm−1 attributing to the asymmetric stretching frequency of Si-O-Si is shifted to 1,116 cm−1. Thorpe [21], Galeener [22] and Almeida [23] have pointed out that the shift of Si-O-Si mode can be explained by following equation:
where ω is related to the Si-O-Si asymmetric stretching frequency, θ stands for the intertetrahedral bond angle, and k represents the Si-O stretching force constant. mO and mSi are the mass of the oxygen and silicon atoms respectively. From Eq. (1), it can be seen that the influence factors of transformation of frequency are bond angle θ and stretching force constant k. When θ increases, vibrational frequency will be larger. On the other hand, an increase in the Si-O bond length leads to a decrease of k which ultimately results in a decrease of asymmetric stretching frequency ω [24]. In the experiment, silica fume is in the form of amorphous structure, which is generally considered to be disordered tetrahedron of [SiO4]. Mozzlt and Warren [25] roughly estimated θ of the Si-O-Si bond following the distribution curve V(θ), and it varies in the range of 120° to 180° with a maximum of about 144°. In our experiment, the bond angle θ of the cristobalite crystal formed is about 146.8° [26]. The increase of θ may cause an increase of the asymmetric stretching frequency ω.
Raman spectra of silica fume before and after treated at different temperature are further conducted and the results are shown in Figure 7. In view of the sample before treated, the sharp band at 292 cm−1 can be assigned to the modes of [SiO4] and oxygen vibrations [27]. The sharp bands at 505 cm−1 and 603 cm−1, known as defect modes, have been associated to breathing vibrations of oxygen atoms in four- and three-membered rings, respectively [19]. Especially in view of the band at 505 cm−1, the strong intensity indicates a fairly more defects in the silica fume. The defects may be caused by broken bands, metallic impurities and vacancies. Bates [28] pointed out that the defects modes of 505 cm−1 and 603 cm−1 belong to a kind of defect with one broken Si-O bond which can be represented by -Si-O…Si-. The small band at 987 cm−1 indicates the formation of Si-OH, which may be caused by connecting with water resulting in the formation of Si-OH and even adjacent hydroxyl groups Si-OH•OH-Si. The small signals obtained at 797 cm−1 are attributed to the network Si-O-Si symmetric stretching vibrating mode [29].
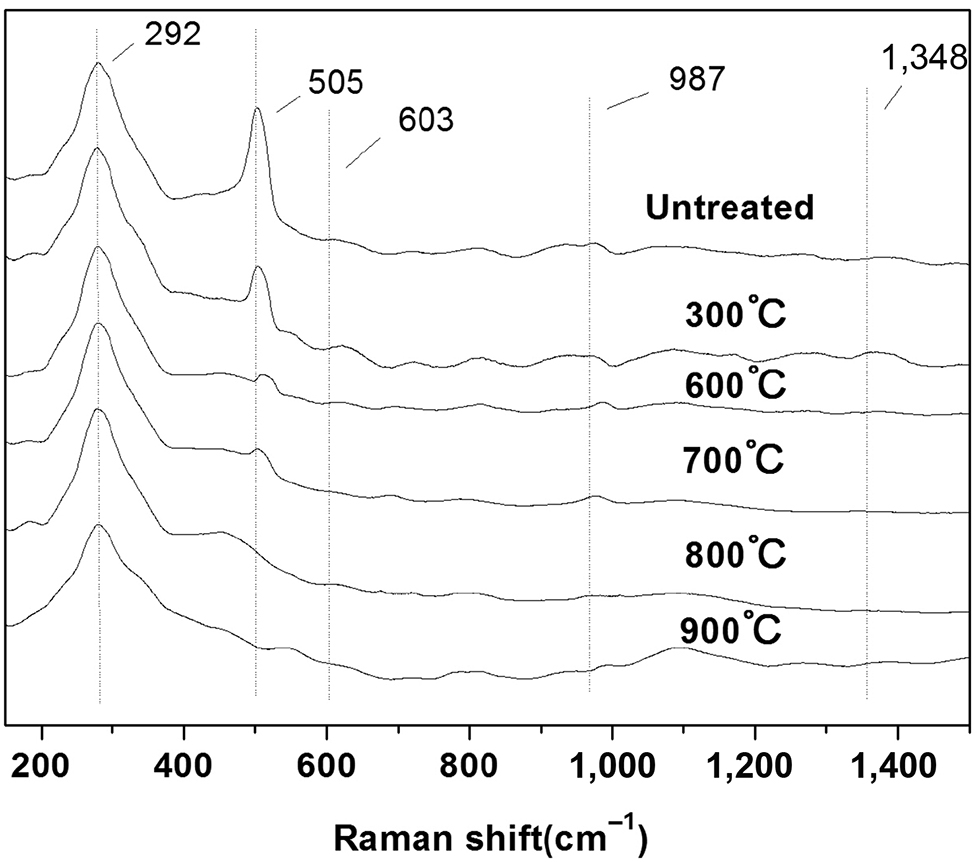
Raman spectra of silica fume before and after heat treated at different temperature.
For a better comparison, spectra have been arbitrarily normalized to the 292 cm−1 intensity peak. When the sample is treated at different temperature, the band of 603 cm−1 disappears. The intensity of the sharp band at 505 cm−1 decreases and red-shifts to a higher band of 515 cm−1 as the treatment temperature increases. It has been pointed out that the two bands are associated with the defects. Therefore the decrease and red-shift of the two bands indicated a densification of the defects, i. e. the three-membered ring (SiO)3 reconstructed into a larger and stable structure with the increasing treatment temperature [30, 31].
From above experiments, a hypothetical planar model is proposed for the reaction process of low-grade silica fume at elevated temperature (Figure 8). Silica fume formed randomly with disordered [SiO4] tetrahedron and the central atom was silicon. The Si-O rings may consist of three-, four-, five-, six- or more fold silicon as the amorphous structure. Six- to eight-fold Si-O rings are verified to be the most stable because of the lower energy [32]. In our work, some defects such as Si-O and Si≡ exist in the raw material (Figure 8(a)). When exposed to moist air, some broken bonds tend to absorb water to form the bands of Si-OH or Si-OH•OH-Si (Figure 8(b)). At the same time, free water enters into the inner part of silica fume as the loose structure. When temperature is increased to 600 °C, the dehydration reaction occurs accompanying with the reconstruction of several broken bonds (Figure 8(c)). From 800 °C, the reaction of reconstruction of the residual broken bonds begins (Figure 8(d)). The defects of Si-O and Si≡ rebuild and the three- or four-fold Si-O rings connects to form a larger and stable ring. Therefore the disordered structure changes to be ordered and the loose structure of silica fume became compact accompanying with a huge shrinkage in volume.

Schematic diagram of structure evolution of low-grade silica fume at elevated temperature. (a) Before contacting with the moist air; (b) after contacting with the moist air at room temperature; (c) treated at low temperature (≤700 °C); (d) treated at high temperature (≥800 °C).
Conclusion
A systematic investigation of the microstructure of low-grade silica fume treated at different temperature is carried out using TG-DTA, SEM, TEM, FT-IR and Raman spectrum. The results show that the low-grade silica fume contains more defects and impurities. These defects tend to form Si-OH and even adjacent hydroxyl groups Si-OH•OH-Si when exposed to the moist air or water. When temperature is elevated to 600 °C, the dehydration reaction occurs accompanying with the reconstruction of several broken bonds. Reconstruction of the residual broken bonds begins from around 800 °C. The defects of Si-O and Si≡ rebuild and the three- or four-fold Si-O rings connect to form a larger and stable ring, which leads the disordered structure to be ordered and the loose structure of silica fume becomes compact accompanying with a huge shrinkage in volume.
Funding statement: National Nature Science Foundation of China of No. 51172021 and 51572019, the National Science-technology Support Plan Projects (Grant 2013BAF09B01) and the National Science Fund for Excellent Young Scholars of China (No. 51522402).
Acknowledgements
The authors express their appreciation to National Nature Science Foundation of China of No. 51172021 and 51572019, the National Science-technology Support Plan Projects (Grant 2013BAF09B01) and the National Science Fund for Excellecnt Young Scholars of China (No. 51522402).
References
[1] S. Diamond and S. Sahu, Mater. Struct., 39 (2006) 849–859.10.1617/s11527-006-9087-ySearch in Google Scholar
[2] M.I. Sánchez de Rojas, J. Rivera and M. Frías, Cem. Concr. Res., 29 (1999) 945–949.10.1016/S0008-8846(99)00085-XSearch in Google Scholar
[3] Y. Zhong, L.L. Shaw, M. Manjarres and M.F. Zawrah, J. Am. Ceram. Soc., 93 (2010) 3159–3167.10.1111/j.1551-2916.2010.03867.xSearch in Google Scholar
[4] H.P. Ji, Z.H. Huang, K. Chen, W.J. Li, Y.F. Gao, M.H. Fang, Y.G. Liu and X.W. Wu, Powder Technol., 252 (2014) 51–55.10.1016/j.powtec.2013.10.030Search in Google Scholar
[5] Y. Wang, T.D. Xia, H. Zheng and H.X. Feng, Energy Build., 43 (2011) 2365–2370.10.1016/j.enbuild.2011.05.019Search in Google Scholar
[6] E. Chalvatzaki, V. Aleksandropoulou, T. Glytsos and M. Lazaridis, Waste Manage., 32 (2012) 2456–2468.10.1016/j.wasman.2012.06.005Search in Google Scholar PubMed
[7] M. Dan, G.H. Zhuang, X.X. Li, H.R. Tao and Y.H. Hui, Atmos. Environ., 38 (2004) 3443–3452.10.1016/j.atmosenv.2004.02.052Search in Google Scholar
[8] D.Y. Zhang and H.X. Feng, China Non-Metallic Min. Ind. Herald, 6 (2009) 47–49.Search in Google Scholar
[9] J.L. Zhang, Z.C. Guo, Q. Zhi and H.Q. Tang, Chinese J. Process Eng., 12 (2012) 212–217.Search in Google Scholar
[10] S. Diamond, S. Sahu and N. Thaulow, Cem. Concr. Res., 34 (2004) 1625–1632.10.1016/j.cemconres.2004.01.031Search in Google Scholar
[11] E.Y. Sako, M.A.L. Braulio and V.C. Pandolfelli, Ceram. Int., 38 (2012) 6027–6033.10.1016/j.ceramint.2012.03.070Search in Google Scholar
[12] T.T. Zhang, C.R. Cheeseman and L.J. Vandeperre, Cem. Concr. Res., 41 (2011) 439–442.10.1016/j.cemconres.2011.01.016Search in Google Scholar
[13] E. Prud’homme, P. Michaud, E. Joussein, C. Peyratout, A. Smith, S. Arrii-Clacens, J.M. Clacens and S. Rossignol, J. Eur. Ceram. Soc., 30 (2010) 1641–1648.10.1016/j.jeurceramsoc.2010.01.014Search in Google Scholar
[14] D.R. Clarke, M.C. Kroll, P.D. Kirchner and R.F. Cook, Phys. Rev. Lett., 60 (1998) 2156–2159.10.1103/PhysRevLett.60.2156Search in Google Scholar
[15] M.H. Huang, A. Choudrey and P. Yang, Chem. Commun., 36 (2000) 1063–1064.10.1039/b002549fSearch in Google Scholar
[16] S. Bruni, F. Cariati, M. Casu, A. Lai, A. Musinu, G. Piccaluga and S. Solinas, Nano Struct. Mater., 11 (1999) 573–586.10.1016/S0965-9773(99)00335-9Search in Google Scholar
[17] I. Chuang and E.M. Gary, J. Phys. Chem. B, 101 (1997) 3052–3064.10.1021/jp9629046Search in Google Scholar
[18] A. Anedda, C.M. Carbonaro, F. Clemente, R. Corpino and P.C. Ricci, J. Phys. Chem. B, 107 (2003) 13661–13664.10.1021/jp036691dSearch in Google Scholar
[19] A.G. Kalampounias, Bull. Mater. Sci., 34 (2001) 299–303.10.1007/s12034-011-0064-xSearch in Google Scholar
[20] S. Park, S. Jin and S. Kaang, Mater. Sci. Eng. A, 398 (2005) 137–141.10.1016/j.msea.2005.03.012Search in Google Scholar
[21] P.N. Sen and M.F. Thorpe, Phys. Rev. B, 15 (1977) 4030–4038.10.1103/PhysRevB.15.4030Search in Google Scholar
[22] L.G. Frank, Phys. Rev. B, 19 (1979) 4292–4297.10.1103/PhysRevB.19.4292Search in Google Scholar
[23] M.A. Almeida, H.C. Vasconcelos and M.I. Laura, SPIE’s 1994 International Symposium on Optics, Imaging, and Instrumentation, SPIE, July 24, 1994, San Diego, CA, International Society for Optics and Photonics, (1994), pp. 678–687.Search in Google Scholar
[24] P. Innocenzi, P. Falcaro, D. Grosso and F. Babonneau, J. Phys. Chem. B, 107 (2003) 4711–4717.10.1021/jp026609zSearch in Google Scholar
[25] R.L. Mozzlt and B.E. Warren, J. Appl. Cryst., 2 (1969) 164–171.10.1107/S0021889869006868Search in Google Scholar
[26] A.R. Ruffa, J. Non-Cryst. Solids, 13 (1973) 37–54.10.1016/0022-3093(73)90034-3Search in Google Scholar
[27] B. Humbert, J. Non-Cryst. Solids, 191 (1995) 29–37.10.1016/0022-3093(95)00311-8Search in Google Scholar
[28] J.B. Bates, R.W. Hendricks and L.B. Shaffer, J. Chem. Phys., 61 (1974) 23–27.10.1063/1.1681714Search in Google Scholar
[29] I.K. Battisha and H.H. Afify, J. Sol-Gel Sci. Technol., 25 (2002) 5–15.10.1023/A:1016044325061Search in Google Scholar
[30] P. Yuan, H.P. He, D.Q. Wu, D.Q. Wang and L.J. Chen, Spectrochim. Acta A, 60 (2004) 2941–2945.10.1016/j.saa.2004.02.005Search in Google Scholar
[31] E.I. Kamitsos and A.P. Patsis, Phys. Rev. B, 48 (1993) 45–50.10.1103/PhysRevB.48.12499Search in Google Scholar
[32] A.G. Revesz, J. Non-Cryst. Solids, 7 (1972) 77–85.10.1016/0022-3093(72)90018-XSearch in Google Scholar
© 2017 Walter de Gruyter GmbH, Berlin/Boston
This article is distributed under the terms of the Creative Commons Attribution Non-Commercial License, which permits unrestricted non-commercial use, distribution, and reproduction in any medium, provided the original work is properly cited.
Articles in the same Issue
- Frontmatter
- Research Articles
- Estimation for Iron Redox Equilibria in Multicomponent Slags
- The Effect of Multi-inclined Holes on the Creep Properties of Nickel-Based Superalloy
- Estimation of Various Properties of CaO–“FeO”–SiO2 System at 1,673 K by Mass Triangle Model
- The Enhancing Effect of Microwave Irradiation and Ultrasonic Wave on the Recovery of Zinc Sulfide Ores
- The Self-assembled Deposition on the Surface of Mono-crystalline Silicon Induced by High-Current Pulsed Electron Beam
- Numerical Model of Dephosphorization Reaction Kinetics in Top Blown Converter Coupled with Flow Field
- Morphological Evolution of Low-Grade Silica Fume at Elevated Temperature
- Discussion of Carbon Emissions for Charging Hot Metal in EAF Steelmaking Process
- Predictive Models for Modulus of Rupture and Modulus of Elasticity of Particleboard Manufactured in Different Pressing Conditions
- Photoluminescence Properties of Eu3+-activated Silicate Phosphors
- Synthesis, Acidity and Catalytic of the Rare Earth Ce Loaded on the Composite Pore Zeolite Catalyst for Hydrogenation Cracking