Synthesis of a novel water-soluble pyridine dicarboxylate and its application in fluorescence cell imaging
-
Zhengyou Wei


Abstract
A novel water-soluble substituted pyridine dicarboxylate containing a quaternary ammonium ion with potential applications in fluorescence cell imaging was synthesized and characterized. Remarkably, this compound exhibited water solubility in the absence of additional solubilizers, enabling direct dissolution in phosphate-buffered saline for cell studies. No obvious cytotoxicity was observed in 4T1 cells (mouse breast cancer cells) within the concentration range of 0.2–25 μmol L−1, with a cell survival rate above 89%. Furthermore, the compound exhibited a maximum two-photon absorption cross-section of 86 GM at an excitation wavelength of 780 nm, demonstrating high cell permeability, effective distribution in the cytoplasm, and preferential targeting of organelles. Single- and two-photon fluorescence imaging of cells revealed a distinctive blue emission and strong bright green emission, respectively. The newly synthesized substituted pyridine dicarboxylate exhibited low cytotoxicity and strong fluorescence imaging properties, demonstrating its potential in cell imaging applications.
1 Introduction
Pyridine dicarboxylic acid units are components of numerous fluorescent compounds used in information storage, encryption, and fluorescence imaging applications [1–4]. Upon excitation, a fluorescent molecule absorbs a single photon and emits another fluorescent photon via radiative transition, resulting in single-photon fluorescence. The excitation wavelength of single-photon fluorescence is typically shorter than the emission wavelength. During fluorescence excitation using a laser light source, a fluorescent molecule can absorb two or more photons simultaneously, resulting in two-photon or multiphoton absorption.
In contrast to single-photon fluorescence, the excitation wavelength of two-photon-excited fluorescence (TPEF) is generally longer than the emission wavelength, and is shifted to the near-infrared region to avoid the influence of ultraviolet lasers. This characteristic significantly reduces both damage to living systems from ultraviolet light and background interference from Rayleigh and Raman scattering. Similarly, a TPEF probe can overcome the reduced out-of-plane photobleaching and scattering commonly associated with single-photon excitation [5], and exhibit strong penetration (>500 μm) in scattering media, low tissue autofluorescence self-absorption, and high resolution. Two-photon microscopy (TPM) uses a two-photon excitation light source, with longer photon wavelengths and lower energy. When combined with appropriate TPEF probe, TPM enables prolonged imaging of intact tissue without creating tissue artifacts, and thus facilitates the functional imaging of biological tissues at the subcellular level. This technology has numerous applications in biology and medicine, including the detection of living tissues and cells, direct observation of cellular metabolism, and cancer diagnosis, among others. However, most fluorescence imaging probes suffer from poor water solubility and low two-photon absorption (TPA) cross-section values (δ) (<50 GM; 1 GM = 10−50 cm4 S photon−1), which limit their use in TPM and their broader application and development [6–8].
Some compounds with a push-pull electron structure (donor-π-acceptor, D-π-A) undergo TPA to produce TPEF [9–11]. Although the synthesis of some compounds containing pyridine dicarboxylic acid units with TPA has been achieved, such compounds are generally hydrophobic and therefore exhibit weak binding to cells, which inhibits their effectiveness in imaging applications [2,12]. The application of two-photon technology in biofluorescence imaging and medicine is limited by the lack of water-soluble TPEF probes with high δ. To address this limitation, we synthesized a novel water-soluble pyridine dicarboxylate compound for use in cell-imaging studies.
2 Results and discussion
2.1 Synthesis of compound [8]
A novel pyridine dicarboxylate TPEF probe, potassium 4-(4-(2-(6-((6-(trimethylammonio)hexyl)oxy)naphthalen-2-yl)vinyl)phenyl)pyridine-2,6-dicarboxylate bromide) (8), was synthesized as shown in Scheme 1.
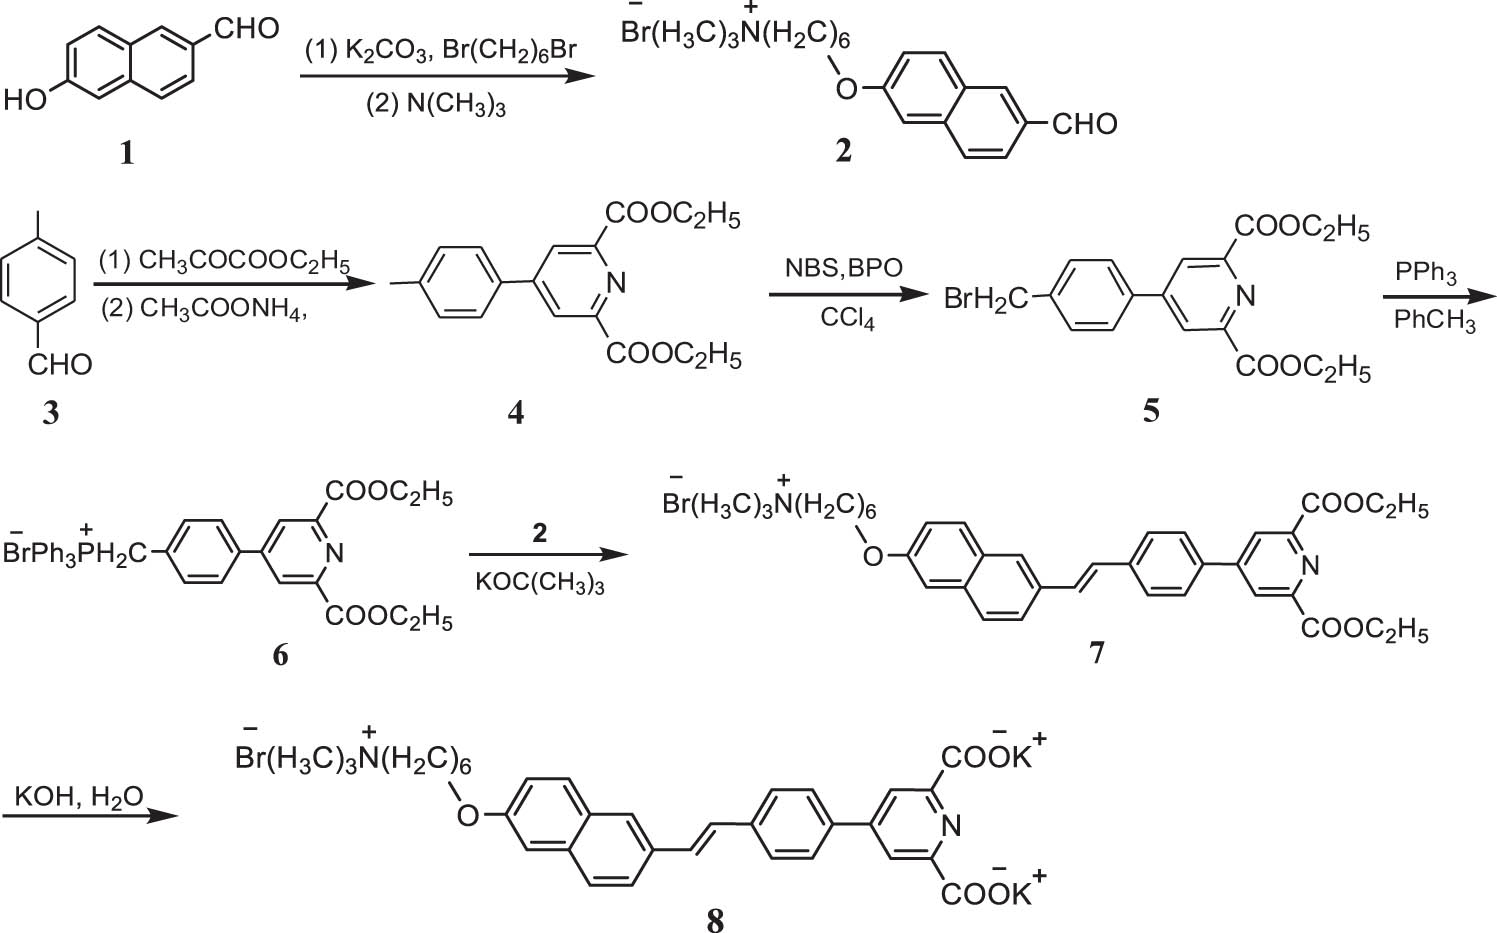
Synthesis of compound (8).
Compound (4) was synthesized from p-methylbenzaldehyde and ethyl pyruvate in accordance with an established procedure [13]. The phosphonium salt precursor, compound (5), was obtained by the reaction of compound (4) with a excess of N-bromosuccinimide (NBS) (added in four separate batches) to obtain a monobrominated target in high yield, while minimizing the byproducts [14,15]. The reaction of compound (5) with triphenylphosphine produced the phosphonium salt compound (6) [16].
Compound (7) was prepared via the Wittig reaction of phosphonium salt (6) and aldehyde (2) in the presence of the strong base potassium tert-butoxide [17,18]. Subsequent hydrolysis of compound (7) afforded the target product (8). Characterization of the synthesized compounds by high-resolution mass spectrometry (HRMS), nuclear magnetic resonance (NMR) spectroscopy, and infrared (IR) spectroscopy yielded consistent results and confirmed the synthesis of the desired product.
Compound (8) is a novel, water-soluble pyridine dicarboxylate incorporating benzene and naphthalene rings. The naphthalene ring features an electron-donating alkoxy group, whereas the pyridine ring acts as an electron-withdrawing group. The benzene and naphthalene rings are bridged through a π bond, forming a D-π-A structure. This arrangement enhances intramolecular electron transfer, extends the conjugated system, and increases the rigidity of the planar structure, thereby improving the TPA cross-section and fluorescence intensity. Compound (8) is water-soluble owing to its two hydrophilic carboxyl anions and strongly hydrophilic quaternary ammonium cation. The addition of benzene and naphthalene rings to the pyridine dicarboxylic acid improved the TPA cross-section and TPEF intensity of compound (8). The resulting TPEF probe exhibited high water solubility, large absorption cross-section (up to 86 GM), high fluorescence intensity, and provided excellent microscopic imaging results.
2.2 TPEF of compound (8)
These compounds were measured air below 20°C, using a femtosecond laser pulse and a Ti:sapphire system as the light source (80 MHz, 140 fs, Chameleon Ultra II), with excitation wavelengths ranging from 700 to 900 nm, laser power of 0.5 W, and integration time of 300 ms. The TPA cross-section was determined using a two-photon-induced fluorescence measurement technique. The TPA cross-section was calculated from the obtained spectral data using the following equation:
where δ is the TPA cross-section value, and C, n, Φ, and F are the concentration, refractive index, fluorescence quantum yield of the solution, and the area of the integral cross section of the TPEF signal at a given excitation wavelength, respectively. The subscripts “s” and “r” denote the sample to be measured and reference sample, respectively.
The TPA cross section of the TPEF probe was measured using fluorescein as a reference [19]. The δ r and Φ r values of fluorescein were obtained from the literature, and the relative error in the measured δ r values was approximately 15%.
The linear absorption spectrum of the prepared TPEF solution of compound (8) was measured to determine its single-photon absorption. A solution of compound (8) (concentration 2.0 × 10⁻⁵ mol L−1) was placed in a quartz colorimeter of 1 cm. The UV-VIS absorption spectra of the samples were recorded using an EVOLUTION 220 UV-VIS spectrophotometer in the scanning wavelength range of 190–1,100 nm. Compound (8) exhibits minimal linear absorption at wavelengths above 450 nm, indicating the absence of single-photon absorption (Figure 1).
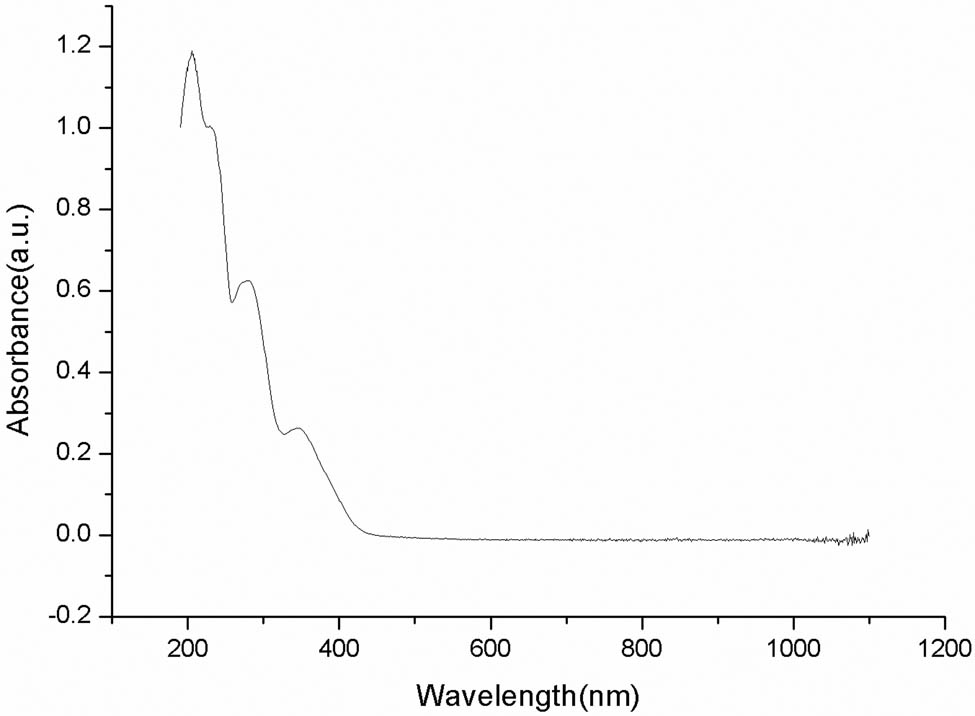
Linear absorption spectra of aqueous solution of compound (8).
Two-photon excitation fluorescence spectra were recorded using a femtosecond laser pulse and Ti:sapphire system (Figure 2). The fluorescence intensity initially increased with the excitation wavelength; however, at excitation wavelengths >780 nm, the intensity began to weaken. Thus, the maximum fluorescence intensity was observed at 780 nm, indicating maximum absorption at this wavelength. In combination with the linear absorption spectrum (Figure 1), which shows that no single-photon absorption occurs above 450 nm, these results indicate that maximum TPA occurs at 780 nm.
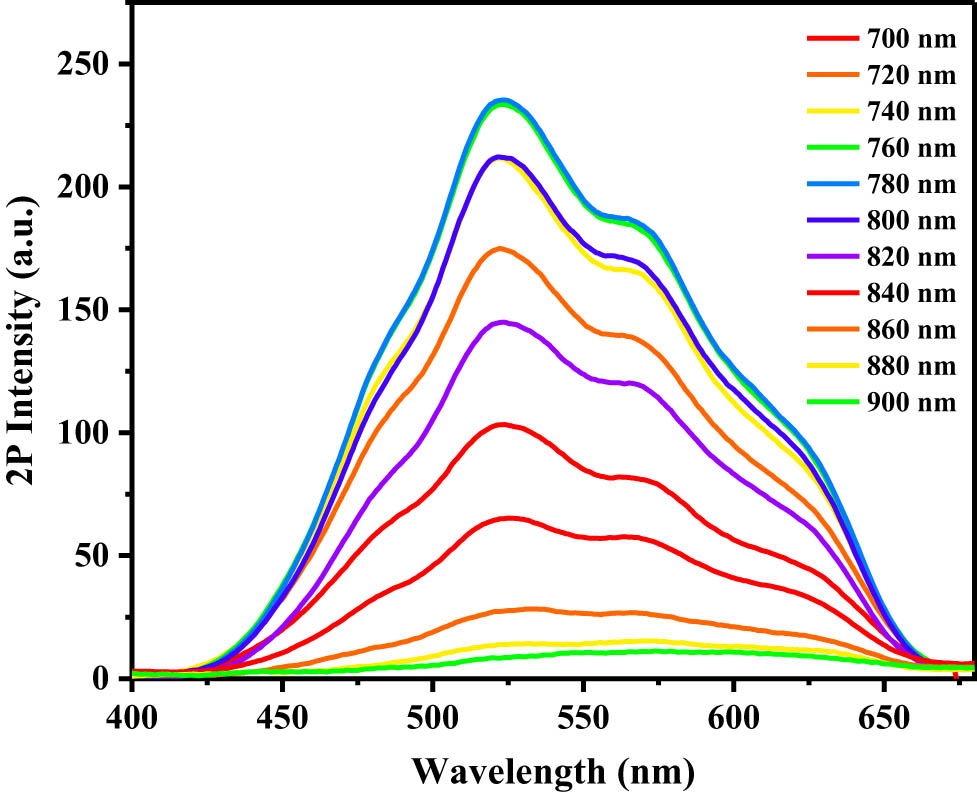
Two-photon excitation fluorescence spectra of aqueous solution of compound (8) at various wavelengths.
The synthesized TPEF probe (8) exhibited high water solubility, enabling its direct use in phosphate-buffered saline (PBS) without the use of a solubilizer. The TPA cross-section of compound (8) was assessed using two-photon fluorescence measurement technology. The calculated TPA cross-sections at various excitation wavelengths are shown in Figure 3. Notably, large absorption cross sections were observed in the range of 700–860 nm, with the maximum TPA cross-section occurring at 780 nm excitation. Furthermore, Figure 3 illustrates the linear relationship between the logarithms of the output fluorescence intensity, I out (a.u.), and the input laser power, I in (mW), at an excitation wavelength of 780 nm. The output/input intensity power logarithm ratio of the sample, determined from the gradient of the straight line, is 1.96, which closely approximates 2. This suggests a quadratic relationship between the output fluorescence intensity and the incident laser power. The laser excitation intensity is proportional to the laser power, and thus, the output fluorescence intensity and the laser excitation intensity are quadratic relations, which demonstrate that the fluorescence signal originates from TPA. The quadratic relationship between the output fluorescence intensity and laser excitation power therefore confirms the TPA mechanism, demonstrating that compound (8) exhibits two-photon activity.
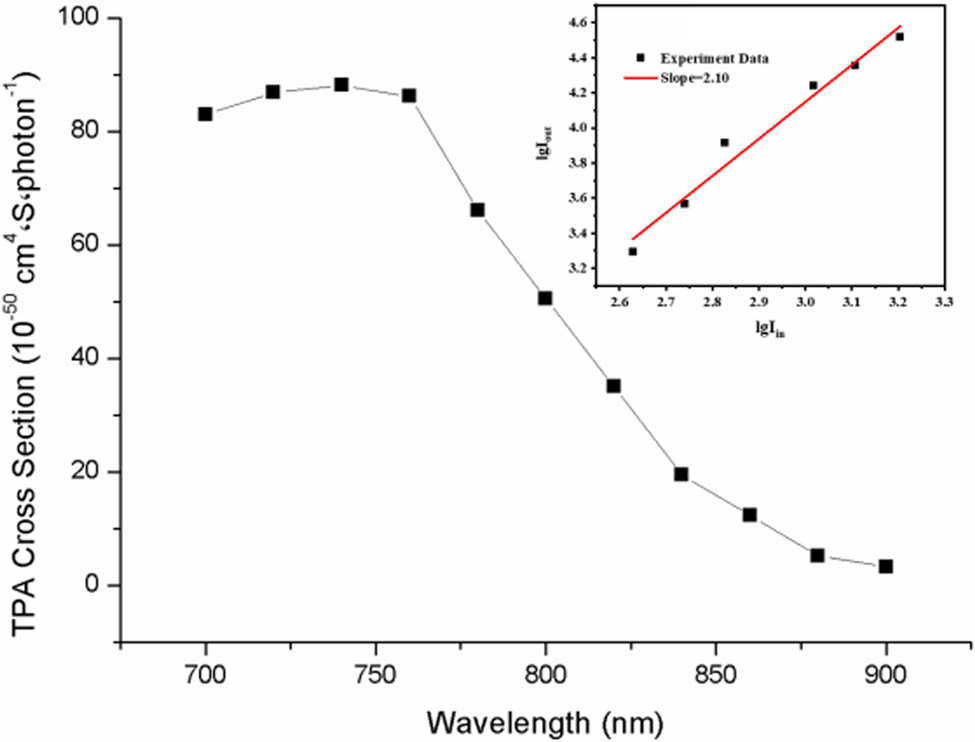
Wavelength dependence of TPA cross-section of aqueous solution of compound (8).
2.3 Toxicity assessment of compound (8)
Prior to fluorescent cell imaging, the effect of TPEF probe on 4T1 cell activity was evaluated by measuring the cell survival rate using the Cell Counting Kit-8 cell-counting reagent (CCK-8). 4T1 cells with density of 5 × 10⁴ cells mL−1 and stable logarithmic growth were inoculated in a 96-well culture plate in an incubator at 37°C and 5% CO2. After cell attachment to the wall, the culture medium was replaced, and various concentrations of the TPEF probe were added to the culture medium. The cells were then incubated for a further 24 h. Subsequently, CCK-8 solution was added to each well and incubated in an incubator for 4 h at 37°C in the dark. Absorbance was then measured at 450 nm using an enzyme analyzer. The cell survival rate (S) was calculated using the following equation:
where A t is the absorbance of the experimental group (solution containing the TPEF probe, cells, medium, and CCK-8), A b is the absorbance of the blank group (solution containing medium and CCK-8, without the TPEF probe or cells), and A c is the absorbance of the control group (solution containing cells, culture medium, and CCK-8, without the TPEF probe).
The cytotoxicity of the TPEF probe (8) was assessed using 4T1 cells as test subjects. Solutions containing different concentrations of compound (8) (0.0, 0.2, 1.0, 5.0, and 25 μmol L−1) were added to the cells. A control group containing only the culture medium and CCK-8 reagent was used to determine the cell survival rate using the CCK-8 assay. Compound (8) exhibits minimal toxicity to 4T1 cells within the tested concentration range of 0.2–25 μmol L−1, and the cell survival rate was above 89% (Figure 4). These findings suggest that compound (8) can be safely used for cell detection and targeting within this concentration range.
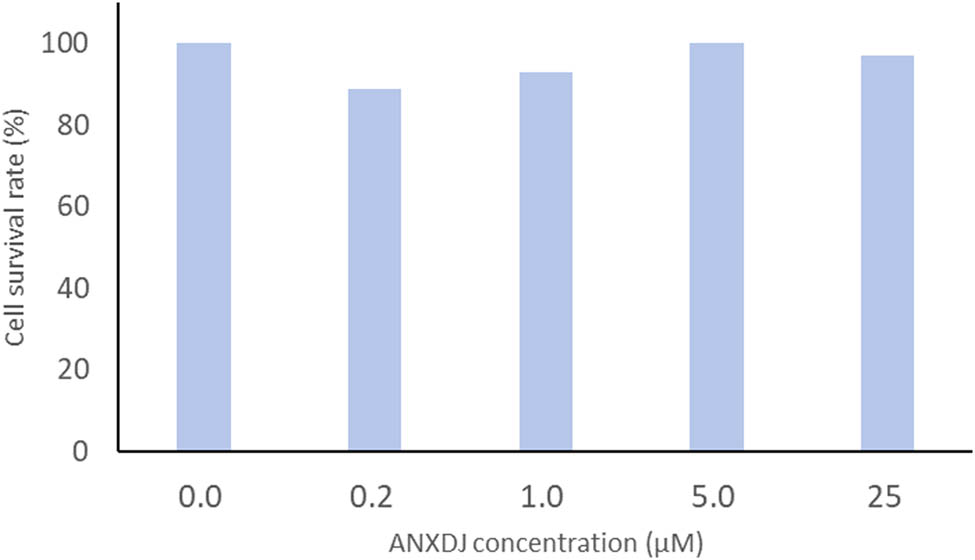
Survival rate of 4T1 cells in solution with various concentrations of compound (8).
2.4 Fluorescent cell imaging of compound (8)
Prior to fluorescence microscopy, 4T1 cells were fixed with formaldehyde and labeled with the TPEF probe in PBS. The 4T1 cells were inoculated in a cell culture dish with a diameter of 35 mm and incubated at 37°C for 24 h in an atmosphere of 5% CO2 and 95% oxygen. Following incubation, the 4T1 cells were washed three times with PBS to remove any residual medium and further incubated with a PBS solution of the TPEF probe (10 µmol L−1) for 4 h. Excess TPEF probe was removed by washing with PBS three times before the cells were fixed with a solution of 4% formaldehyde in PBS (1 mL) for 10 min. Finally, the labeled 4T1 cells were analyzed by fluorescent cell imaging.
Single-photon fluorescence cell microscopy was performed using a FV1200/FV1200MPE laser confocal microscope equipped with CY3, AF488, and DAPI dye channels. The maximum excitation wavelengths of CY3, AF488, and DAP were 550, 488, and 405 nm, respectively, while the emission wavelengths were 570, 519, and 488 nm, respectively. Two-photon fluorescence microscopy was performed using an FV1200/FV1200MPE confocal laser microscope at excitation wavelengths ranging from 700 to 950 nm.
Single- and two-photon fluorescence cell microscopic imaging was conducted using laser confocal microscopy (Figures 5 and 6, respectively). The excitation wavelength used in two-photon fluorescence imaging ranged from 700 to 950 nm, with 800 nm being the optimal wavelength. Therefore, the fluorescence signals at 426–460 and 495–540 nm in the two channels were collected using an excitation wavelength of 800 nm. Single-photon fluorescence exhibited blue emission, whereas two-photon fluorescence displayed strong, bright green emission, resulting in significantly higher clarity and layering. The single-photon fluorescence imaging mode shows only the outer contour of the cell (Figure 5); however, the two-photon fluorescence imaging mode provided significantly higher resolution, exhibiting high permeability and enabling the clear visualization of dye distribution within the cytoplasm (Figure 6). In addition, two-photon imaging reveals several bright spots in the cytoplasm, indicating the preferential targeting of organelles. This result indicates that compound (8) can serve as a two-photon fluorescence reactivity probe in the detection of amines. It can easily react with carboxyl groups and N-hydroxysuccinimide in the presence of carbon diimines such as dicyclohexylcarbodiimide, 1-(3-dimethylaminopropyl)-3-ethylcarbodiimide hydrochloride, or other dehydrating agents to produce active succinimide esters that can label free amino groups (–NH2) on antibodies, proteins, peptides, amine-modified oligonucleotides, and other biomolecules [20–22].
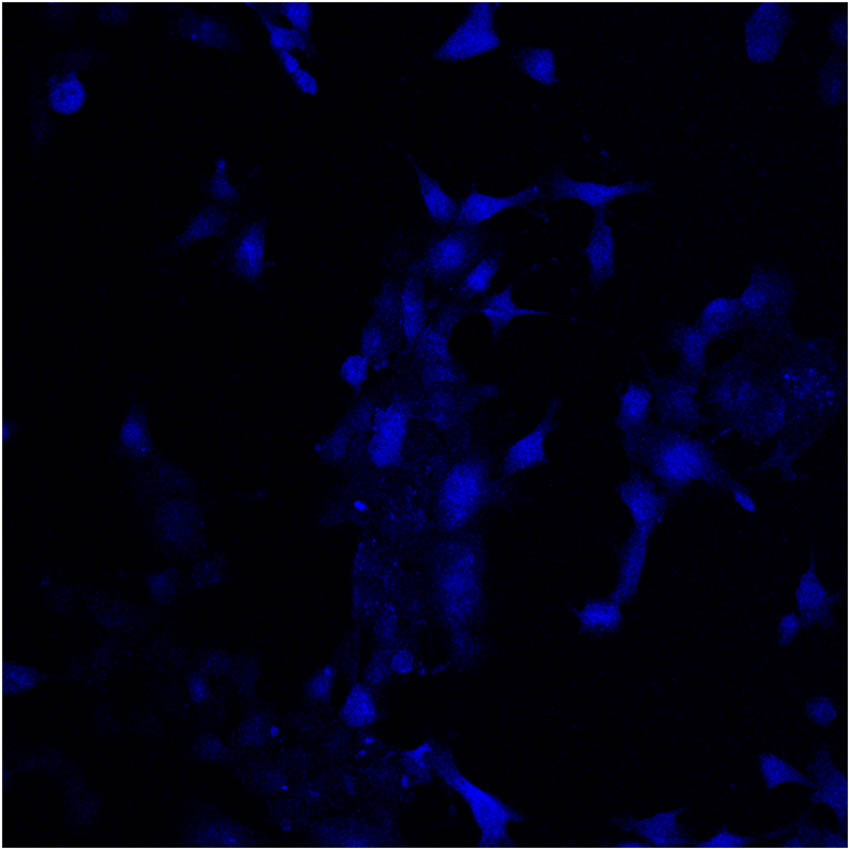
Single-photon fluorescence cell microscopic imaging of 4T1 cells.
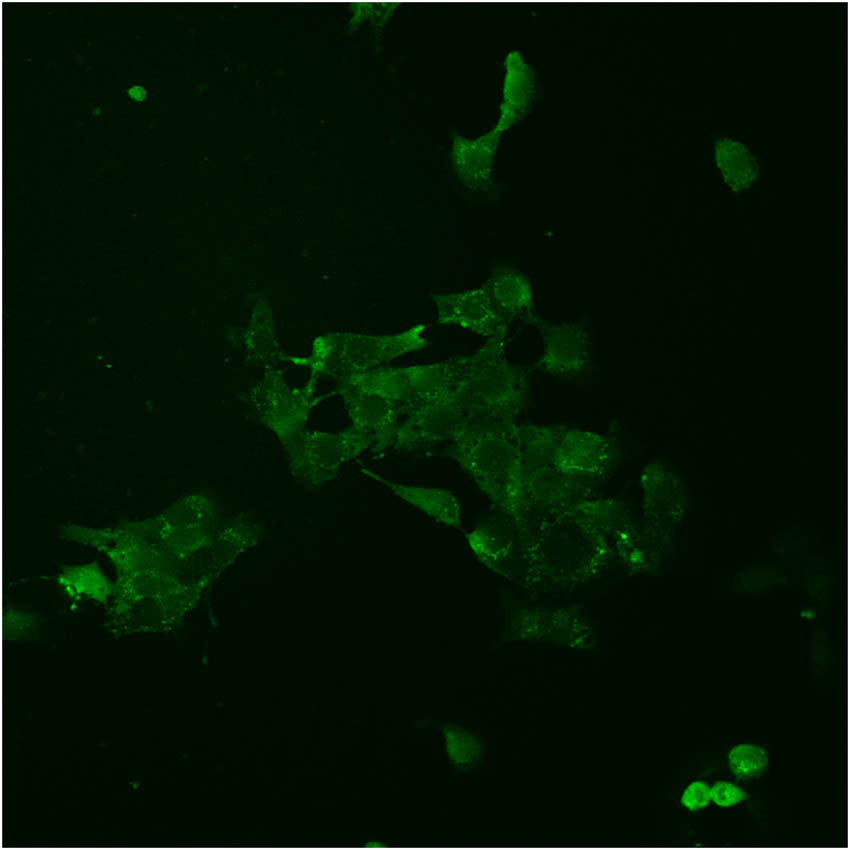
Two-photon fluorescence cell microscopic imaging of 4T1 cells.
3 Conclusion
Compound (8), a novel water-soluble pyridine dicarboxylate with low cytotoxicity and fluorescence imaging properties, was synthesized. Compound (8) incorporates a quaternary ammonium cation and two carboxyl anions, rendering it highly hydrophilic and thus water-soluble. Notably, compound (8) can also be directly dissolved in PBS, facilitating its application in cell studies. Single- and two-photon fluorescence microscopy techniques were used for imaging using a laser confocal microscope. The cell survival rate, determined using the CCK-8 method, showed that compound (8) is suitable for the detection of cellular and biological targets, demonstrating minimal toxicity to 4T1 cells within the concentration range of 0.2–25 μmol L−1, with a cell survival rate above 89%. Single-photon fluorescence microscopic imaging revealed blue emission from cells treated with compound (8). Furthermore, a large TPA cross-section was observed in the range of 700–860 nm, whereas single-photon absorption was absent above 450 nm. Notably, at an excitation wavelength of 780 nm, the TPA cross-section reached a maximum 86 GM, indicating a strong TPA potential. Two-photon cell imaging of compound (8) revealed strong and bright green light emission along with high cell permeability, dispersion within the cytoplasm, and preferential targeting of organelles. These characteristics highlight the potential of compound (8) in two-photon cell imaging technology. Further studies on the biocompatibility, activity, toxicology, and pharmacokinetics of compound (8) in animal models will facilitate its clinical application.
4 Experimental
4.1 Instruments and reagents
Ultraviolet–visible (UV–vis) absorption spectra were obtained using an EVOLUTION 220 UV-vis spectrophotometer (Thermo Fisher Scientific Co., Ltd, Shanghai, China). Infrared spectra were obtained using a NICOLETiS50 Fourier Transform Infrared spectrometer (Thermo Fisher Scientific Co., Ltd, Shanghai, China). High-resolution mass spectrometry was performed using a Bruker Auto flexmaX MALDI-TOF(TOF) mass spectrometer (Bruker Daltonics Co., Billerica, MA, USA). 1H and 13C NMR spectra were obtained using AVANCE NEO 400M and AVANCE NEO 600M spectrometers, respectively (Bruker AG, Germany). Chemical shifts were reported in ppm relative to the Me4Si standard. The melting point was determined using an X-6 micro-melting point tester (Beijing Tech Instrument Co., Ltd, Beijing, China), without modifications. TPEF spectra were acquired using femtosecond laser pulses and a Ti:sapphire system (Thorlabs Co., New Jersey, USA). TPEF imaging was performed using an FV1200/FV1200MPE confocal laser microscope (Olympus, Tokyo, Japan). Cell survival was measured using a Synergy HT (BioTek Instruments Co., Ltd, Vermont, USA).
All reagents and chemicals were purchased from Labgle Information Technology Development Co., Ltd, Nanjing, China, and used in accordance with the original reagent grades. Standard protocols were followed for any additional processing when necessary. Silica gel (200–300 mesh) was used in column chromatography.
4.2 Experimental procedures
4.2.1 Synthesis of compound (2) [23,24]
6-Hydroxynaphthalene-2-formaldehyde (7.11 g, 41.29 mmol), 1,6-dibromohexane (19 mL), and anhydrous potassium carbonate (9.69 g, 70.11 mmol) were added to acetonitrile (100 mL) under a nitrogen atmosphere and stirred under reflux for 24 h. The residue was cooled, filtered, and washed thrice with acetonitrile. The filtrate was decompressed to remove the solvent and the crude products were eluted with column chromatography using a mixture of ethyl acetate and petroleum ether (1:9, v/v) to obtain a light-yellow solid (6.71 g, 20.02 mmol) in 48% yield. The light-yellow solid (0.63 g, 1.88 mmol), acetonitrile (45 mL), and 30% trimethylamine aqueous solution (18 mL) were added to five polytetrafluoroethylene pressure autoclaves (90 mL), and heated at 90°C for 30 h to ensure that the reaction proceeded to completion. Upon cooling, the reaction mixtures were combined, and the solvent was removed under reduced pressure. Subsequently, compound (2) (2.01 g, 5.10 mmol) was obtained as an off-white solid in 54% yield via recrystallization from acetonitrile. m.p. 195–197℃. FT-IR (KBr), ν/cm−1: 3,027, 3,003, 2,945, 2,867, 1,682, 1,618, 1,471, 1,375, 1,269, 1,160, 1,006, 893, 820, 776. 1H NMR (600 MHz, D2O, δ ppm): 9.58 (s, 1H, –CHO), 6.68–7.80 (6H, Naph–H), 3.62 (t, J = 12.0 Hz, 2H, –OCH2–), 2.99–3.16 (11H, –CH2N+ (CH3)3), 1.21–1.59 (8H, –CH2CH2CH2CH2–). 13C NMR (600 MHz, D2O, δ ppm): 195.50, 159.07, 138.13, 135.60, 131.45, 131.34, 127.73, 127.42, 119.46, 107.32, 68.28, 66.61, 57.49, 52.84, 28.05, 25.31, 24.83, 22.26, 16.86. HRMS (ESI, m/z): Calcd. for C20H28
4.2.2 Synthesis of compound (5)
To a mixture of compound (4) (3.89 g, 12.41 mmol) and NBS (2.31 g, 12.98 mmol) in anhydrous carbon tetrachloride (800 mL) was added dibenzoyl peroxide (O, 0.71 g, 2.93 mmol) under a nitrogen atmosphere and the reaction was allowed to proceed for 18 h. Subsequently, NBS (0.77 g, 4.33 mmol) was added in three separate batches, and the mixture was heated under reflux for 24 h. After cooling and filtering, the solvent was removed from the filtrate under vacuum, and the resulting residue (∼200 mL) was washed five times with distilled water (150 mL) and dried over anhydrous magnesium sulfate. After filtration, the solvent was removed by vacuum drying at 50°C for 8 h. Compound (5) (4.25 g, 10.84 mmol) was obtained in 87% yield as a yellow solid following elution with ethyl acetate and petroleum ether (1:11, v/v). m.p. 121–123°C. FT-IR (KBr), ν/cm−1: 3,064, 2,979, 2,937, 2,898, 1,708, 1,602, 1,547, 1,518, 1,472, 1,403, 1,376, 1,347, 1,263, 1,242, 1,162, 1,138, 1,070, 1,017, 845, 783, 754, 731, 705, 644, 614, 588, 574. 1H NMR (400 MHz, CDCl3, δ ppm): 8.51 (s, 2H, Py–H), 7.56–7.76 (4H, Ph–H), 4.50–4.56 (6H, MeCH2– and PhCH2–), 1.49 (t, J = 12.0 Hz, 6H, CH3–). 13C NMR (400 MHz, CDCl3, δ ppm): 164.73, 150.17, 149.31, 139.85, 136.34, 130.07, 127.63, 125.42, 62.50, 32.42, 14.26. HRMS (ESI, m/z): Calcd. for C18H19BrNO4 + [M + H]+ 392.0492; found 392.0475.
4.2.3 Synthesis of compound (6)
Compound (5) (3.93 g, 10.02 mmol) and triphenylphosphine (6.59 g, 25.13 mmol) were added to toluene (50 mL) with stirring under a nitrogen atmosphere, and the mixture was heated under reflux for 7 h. After cooling, the filter residue was washed thrice with toluene, and the obtained crude product was dried under vacuum at 60°C for over 6 h and then recrystallized from acetonitrile and ethyl acetate (1:1 v/v) to obtain compound (6) (3.70 g, 5.65 mmol) as a yellow solid in 56% yield. m.p. 233–235°C. FT-IR (KBr), ν/cm−1: 3,054, 3,040, 3,000, 2,982, 2,961, 2,873, 2,836, 2,770, 1,745, 1,722, 1,597, 1,437, 1,343, 1,245, 1,165, 1,110, 1,024, 850. 1H NMR (400 MHz, CD3OD, δ ppm): 8.42 (s, 2H, Py–H), 7.27–7.94 (19H, Ph–H), 5.18 (d, J = 16.0 Hz, 2H, Ph–CH2–), 4.42–4.47 (m, 4H, –CH2Me), 1.43 (t, J = 7.2 Hz, 6H, –CH3). 13C NMR (400 MHz, CD3OD, δ ppm): 164.35, 149.15, 149.82, 136.40, 135.21, 134.12, 132.07, 130.12, 127.47, 124.89, 118.07, 117.21, 61.97, 29.42, 13.22. HRMS (ESI, m/z): Calcd. for C36H33NO4P+ [M–Br]+ 574.2142; found 574.2120.
4.2.4 Synthesis of compound (8)
Under stirring, a solution of potassium tert-butoxide (0.71 g, 6.33 mmol) in anhydrous methanol (45 mL) was slowly added to a solution of compounds (2) (0.61 g, 1.55 mmol) and (6) (1.05 g, 1.60 mmol) in anhydrous methanol (30 mL) at −10°C under a nitrogen atmosphere. The reaction mixture was stirred at −5°C for approximately 8 h, and thereafter stirred at approximately 25℃ for a further 24 h. After completion of the reaction, the solvent was removed under pressure to obtain a yellow solid, which was added to tetrahydrofuran (70 mL), stirred for 8 h, and filtered. The filtered residue was washed three times with tetrahydrofuran. The dispersion, filtration, and washing procedures were performed in triplicate, and the filter slag was dried under vacuum at 30°C for 8 h to obtain compound (7) (1.01 g, 1.46 mmol) as a yellow solid in 94% yield. Compound (7) was added to an aqueous solution (12 mL) of KOH (0.27 g, 4.81 mmol) at approximately 25℃ and stirred for 48 h, thereafter acetonitrile (200 mL) was added and stirred continuously for a further 6 h. The mixture was filtered, and the filter residue was washed with acetonitrile three times and vacuum-dried at 30°C for 8 h. The dried product was recrystallized from distilled water and isopropyl alcohol (1:6 v/v), and vacuum-dried at 30°C for 48 h. Compound (8) (0.63 g, 0.89 mmol) was obtained as a light-yellow solid in 61% yield. FT-IR (KBr), ν/cm−1: 3,026, 2,933, 2,851, 1,647, 1,622, 1,578, 1,480, 1,394, 1,339, 1,266, 1,211, 1,177, 1,061, 1,007, 965, 831, 807, 723, 702. 1H NMR (600 MHz, CD3OD, δ ppm): 8.43 (s, 1H, Py–H), 8.35 (s, 1H, Py–H), 7.05–7.86 (10H, Naph–H and Ph–H), 6.83 (d, J = 12.0 Hz, 1H, ═C═CH–Ph), 6.71 (d, J = 12.0 Hz, 1H, Naph–HC═C═), 4.08 (t, J = 15.9 Hz, 2H, –OCH2–), 3.10–3.11 (11H,–CH2N+ (CH3)3), 1.44–1.85 (8H, –CH2CH2CH2CH2–). 13C NMR (D2O, δ ppm): 171.43, 160.06, 154.76, 129.54, 129.06, 126.95, 126.90, 126.50, 126.45, 126.22, 121.87, 121.79, 66.38, 52.20, 52.10, 52.00, 28.68, 25.71, 25.41, 22.49. HRMS (ESI, m/z), (1) for C34H35N2O5 − [M–Br–2K]− 551.2551, found 551.2556; (2) Calcd. for C34H35K2N2O5 + [M−Br]+ 629.1815, found 629.1793.
Acknowledgements
The authors thank Qiong Zhang and Qiqi Wang of the School of Chemistry and Chemical Engineering of Anhui University for acquiring the two-photon excited fluorescence spectrum. They are also grateful to Jianrong Chang of the Research Center of Bengbu Medical University for conducting fluorescence cell imaging, and would like to thank Editage (www.editage.cn) for English language editing.
-
Funding information: This work was funded by the Scientific Research Project of Higher Education Institutions of Anhui Province (Grant numbers 2022AH051443 and 2023AH052934) and Key Project of Natural Science of Bengbu Medical College (2021byzd021) for funding.
-
Author contributions: All authors have accepted responsibility for the entire content of this manuscript and consented to its submission to the journal, reviewed all the results and approved the final version of the manuscript. Z.W. and X.Y. designed the experiments, while Y.Q., Q.J., L.S., and Z.W. carried them out. X.Y. prepared the manuscript with all co-authors.
-
Conflict of interest: Authors state no conflict of interest.
-
Data availability statement: The datasets generated during and/or analyzed during the current study are available from the corresponding author on reasonable request.
References
[1] Dai A, Lou K, Wang X, Huang H, Zhou Q. A multicolor-tunable fluorescent hydrogel for information encryption. Dye Pigm. 2024;223:111986.10.1016/j.dyepig.2024.111986Search in Google Scholar
[2] Xiao H, Chen M, Mei C, Yin H, Zhang X, Cao X. Eu(III), Tb(III) complexes with novel ligands containing pyridine-2,6-dicarboxylic acid unit: synthesis, characterization, fluorescence properties and application in biological imaging. Spectrochim Acta, Part A. 2011;84(1):238–42.10.1016/j.saa.2011.09.036Search in Google Scholar PubMed
[3] Fawzy NM. A new synthesis of 1,4-dihydropyridine derevatives from formyl furochromone. Heterocycl Commun. 2008;14(3):169–82.10.1515/HC.2008.14.3.169Search in Google Scholar
[4] Koutsandrea EG, Fousteris MA, Nikolaropoulos SS. Synthesis of new tetracyclic paullone derivatives as potential CDK inhibitors. Heterocycl Commun. 2012;18(4):169–79.10.1515/hc-2012-0121Search in Google Scholar
[5] Shaya J, Corridon PR, Al-Omari B, Aoudi A, Shunnar A, Mohideen MIH, et al. Design, photophysical properties, and applications of fluorene-based fluorophores in two-photon fluorescence bioimaging: a review. J Photochem Photobiol, C. 2022;52:100529.10.1016/j.jphotochemrev.2022.100529Search in Google Scholar
[6] Kim HM, Cho BR. Two-photon fluorescent probes for metal ions. Chem – Asian J. 2011;6(1):58–69.10.1002/asia.201000542Search in Google Scholar PubMed
[7] Ma X-X, Geng M-H, Cheng X-Y, Zhang T-S, Li Z-L, Zhao K. Excellent ratiometric two-photon fluorescent probes for hydrogen sulfide detection based on the fluorescence resonance energy transfer mechanism. Phys Chem Chem Phys. 2024;26(7):6008–21.10.1039/D3CP05329FSearch in Google Scholar
[8] Kaushik V, Dąbrowski M, Gessa L, Kumar N, Fernandes H. Two-photon excitation fluorescence in ophthalmology: safety and improved imaging for functional diagnostics. Front Med. 2024. 10.3389/fmed.2023.1293640.Search in Google Scholar PubMed PubMed Central
[9] Huang C, Wang Q, Yan X. Dicyanostilbene-derived highly sensitive two-photon fluorescence temperature probe for live cell imaging. ChemistrySelect. 2024;9(1):e202303433.10.1002/slct.202303433Search in Google Scholar
[10] Starnovskaya ES, Valieva MI, Aluru R, Kopchuk DS, Khasanov AF, Taniya OS, et al. Carbazole/fluorene-substituted 5-phenyl-2,2′-bipyridine D–π–A fluorophores: photophysical data, hyperpolarizability and CT-indices. New J Chem. 2023;47(26):12393–402.10.1039/D3NJ00394ASearch in Google Scholar
[11] Guo Q, Zhou C, Ma Z, Ren Z, Fan H, Yang X. Elementary photocatalytic chemistry on TiO2 surfaces. Chem Soc Rev. 2016;45(13):3701–30.10.1039/C5CS00448ASearch in Google Scholar PubMed
[12] Xiao H, Li H, Chen M, Wang L. A water-soluble D–π–A chromophore based on dipicolinic acid: synthesis, pH-dependent spectral properties and two-photon fluorescence cell imaging. Dye Pig. 2009;83(3):334–8.10.1016/j.dyepig.2009.05.012Search in Google Scholar
[13] Chouthaiwale PV, Tanaka F. Reactions of pyruvates: organocatalytic synthesis of functionalized dihydropyrans in one pot and further transformations to functionalized carbocycles and heterocycles. Chem Commun. 2014;50(94):14881–4.10.1039/C4CC06035KSearch in Google Scholar
[14] Ezhilarasu T, Sathiyaseelan A, Kalaichelvan PT, Balasubramanian S. Synthesis of 4′-substituted-2,2′;6′,2″-terpyridine Ru(II) complexes electrochemical, fluorescence quenching and antibacterial studies. J Mol Struct. 2017;1134:265–77.10.1016/j.molstruc.2016.12.102Search in Google Scholar
[15] Hu Z-J, Yang J-X, Tian Y-P, Zhou H-P, Tao X-T, Xu G-B, et al. Synthesis and optical properties of two 2,2′: 6′,2″-terpyridyl-based two-photon initiators. J Mol Struct. 2007;839(1):50–7.10.1016/j.molstruc.2006.10.044Search in Google Scholar
[16] Yang Y, Jia H-M, Liu B-L. (E)-5-Styryl-1H-indole and (E)-6-styrylquinoline derivatives serve as probes for β-amyloid plaques. Molecules. 2012;17(4):4252–65.10.3390/molecules17044252Search in Google Scholar PubMed PubMed Central
[17] Babudri F, Cardone A, Cassano T, Farinola GM, Naso F, Tommasi R. Synthesis and optical properties of a poly(2′,5′-dioctyloxy-4,4′,4″- terphenylenevinylene) with high content of (Z) vinylene units. J Organomet Chem. 2008;693(15):2631–6.10.1016/j.jorganchem.2008.05.014Search in Google Scholar
[18] Pearson MSM, Carbery DR. Studies toward the photochemical synthesis of functionalized [5]- and [6] carbohelicenes. J Org Chem. 2009;74(15):5320–5.10.1021/jo900785kSearch in Google Scholar PubMed
[19] Melnikov AS, Serdobintsev PY, Vedyaykin AD, Khodorkovskii MA. Two-photon absorption cross section for Coumarins 102, 153 and 307. J Phys: Conf Ser. 2017;917(6):062029.10.1088/1742-6596/917/6/062029Search in Google Scholar
[20] Yao S, Schafer-Hales KJ, Belfield KD. A new water-soluble near-neutral ratiometric fluorescent pH indicator. Org Lett. 2007;9(26):5645–8.10.1021/ol7026366Search in Google Scholar PubMed
[21] Zhou L, Mao H, Wu C, Tang L, Wu Z, Sun H, et al. Label-free graphene biosensor targeting cancer molecules based on non-covalent modification. Biosens Bioelectron. 2017;87:701–7.10.1016/j.bios.2016.09.025Search in Google Scholar PubMed
[22] Ito S, Muguruma N, Hayashi S, Taoka S, Bando T, Kusaka Y, et al. Visualization of human gastric ancer with a novel indrared furescent labeling marker of anti-carcinoembryonic antigen in vitro. Dig Endosc. 2000;12(1):33–6.10.1046/j.1443-1661.2000.00007.xSearch in Google Scholar
[23] Tang C, Zhang Q, Li D, Zhang J, Shi P, Li S, et al. Synthesis, crystal structures, two-photon absorption and biological imaging application of two novel bent-shaped pyrimidine derivatives. Dye Pig. 2013;99(1):20–8.10.1016/j.dyepig.2013.04.016Search in Google Scholar
[24] Wang T-W, Huang P-R, Chow JL, Kaminsky W, Golder MR. A cyclic ruthenium benzylidene initiator platform enhances reactivity for ring-expansion metathesis polymerization. J Am Chem Soc. 2021;143(19):7314–9.10.1021/jacs.1c03491Search in Google Scholar PubMed
© 2024 the author(s), published by De Gruyter
This work is licensed under the Creative Commons Attribution 4.0 International License.
Articles in the same Issue
- Research Articles
- Structural simplification of the 3‐nitroimidazo[1,2‐a]pyridine antileishmanial pharmacophore: Design, synthesis, and antileishmanial activity of novel 2,4-disubstituted 5-nitroimidazoles
- Synthesis of a novel water-soluble pyridine dicarboxylate and its application in fluorescence cell imaging
- Synthesis of novel meta-diamide compounds containing pyrazole moiety and their insecticidal evaluation
- Review Articles
- Inorganic nanoparticles promoted synthesis of oxygen-containing heterocycles
- Gold-catalyzed synthesis of small-sized carbo- and heterocyclic compounds: A review
- Synthesis of imidazole derivatives in the last 5 years: An update
- Current progress in the synthesis of imidazoles and their derivatives via the use of green tools
- Synthetic and therapeutic review of triazoles and hybrids