Application of environmental and economic metrics to guide the development of biocatalytic processes
-
Joana Lima-Ramos
Joana Lima-Ramos obtained her Master’s degree in Biochemical Engineering from the Technical University of Lisbon, Portugal, in 2007. After a period as a research assistant at the Université Catholique de Louvain, Belgium, she started her PhD studies at the Technical University of Denmark (DTU), which she concluded in 2013. She is currently a postdoctoral researcher at DTU, where her research focus is on biocatalytic processes.
Pär Tufvesson obtained his PhD from Lund University, Sweden. He has recently returned to an industrial position after five years at DTU. During his PhD and postdoctoral work at DTU, his research focus was on biocatalysis.
John M. Woodley is a Professor at the Department of Chemical and Biochemical Engineering at the Technical University of Denmark (DTU), where he has been working since 2007. His research interests include bioprocess and biocatalytic process technology. He is a Fellow of the Royal Academy of Engineering, London, UK.


Abstract
The increasing industrial interest in biocatalytic processes is predominantly driven by the need for selective chemistry, with high reaction yield (Yreaction) and few side reactions, as well as the need for optically pure chiral molecules (in particularly in the pharmaceutical industry). Interestingly, it is often argued that the mild conditions frequently used in biocatalytic reactions (ambient temperature and pressure, neutral pH and aqueous-based media) automatically lead to environmentally-friendly and cost-effective production processes. However, such a conclusion is not justified without the use of adequate tools to evaluate the performance of a process, in particular during process development. Nevertheless, at the early development stage, evaluation of biocatalytic processes is not a trivial task, not only due to the lack of data, but also because at this stage many of the biocatalytic processes are not yet fully optimized. Hence, in this paper we propose the use of a range of tools which can be used to guide process development, research tasks and support decision-making. Three sets of metrics are identified, each for use at different stages of process development (route selection, early development and late development), each with different objectives.
- Abbreviations and nomenclature
- AP
acidification potential (gSO2-eq·kg Product-1)
- AE
atom efficiency (MWProduct·MWSubstrate-1)
- AVI
added value index (€Product·€Reagents-1)
- BWP
bulk waste potential (g waste·kgP-1)
- C-Factor
carbon factor (gCO2 (cradle to gate)·kgProduct-1)
- CME
carbon mass efficiency (g C Product·g C reagents-1)
- CoG
cost of goods
- E-Factor
environmental factor (g waste generated·gProduct-1)
- EMY
effective mass yield (gProduct·g non-benign reagents-1)
- eq
equivalents
- ETP
eco toxicity potential (PAF.m3.day·kgProduct-1)
- GWP
global warming potential (gCO2-eq·kgProduct-1)
- HTP
human toxicity potential (Cases·kgProduct-1)
- HWP
hazardous waste potential (g waste·kgProduct-1)
- NCE
new chemical entity
- NEP
nutrient enrichment potential (gPO43—-eq·kgProduct-1)
- [P]
product concentration (gProduct·Lreactot-1)
- PAF
potentially affected fraction (-)
- PMI
process mass intensity (g all reactants and products·gProduct-1)
- POCP
photochemical ozone creation potential (gC2 H4-eq·kgProduct-1)
- RME
reaction mass efficiency (gProduct·g all reactants-1)
- SI
solvent intensity (gsolvent·gProduct-1)
- STY
space-time- yield (gProduct·(Lreactor h)-1)
- WI
water intensity (gwater·gProduct-1)
- Ybiocatalyst
Biocatalyst yield·(gProduct·gbiocatalyst-1)
- Yreaction
Reaction yield (molProduct·molSubstrate-1)
1 Introduction
In recent decades, biocatalytic processes have emerged as an excellent complement to (and in some cases replacement for) conventional chemical synthesis (using homogeneous and heterogeneous catalysis), driven by the need to produce chemicals from inexpensive renewable raw materials, adopt greener and cheaper synthetic routes, generate less toxic side-products and waste, while ensuring product quality [1]. The use of biocatalysis is particularly attractive when: (1) the current process exposes considerable safety concerns (such as oxidation reactions carried out in organic solvents operating at high temperature and pressure [2]), (2) stereoselective and regioselective synthesis is required [3] and/or (3) there is a need to replace metal catalysts (such as Rh, Ru, Pd and Pt), which are scarce and non-renewable resources (and therefore, expensive). Repeatedly, biocatalysis has been promoted as a potentially cheaper, cleaner and more environmentally-friendly technology, due to its unrivalled selectivity [allowing production of single stereoisomers, as well as reactions with higher reaction yields (Yreaction), fewer side reactions, by-products and easier separation of products], the renewable and biodegradable character of the biocatalyst, and the fact that biocatalytic reactions run under mild conditions (ambient temperature and pressure) and in neutral aqueous solution. The often cited attractive environmental and economic features of biocatalytic processes have led to an increasing number of processes running on a commercial scale [4–6] and a rapid growth in the number of scientific publications claiming the green benefits of this technology. Such claims are frequently based on the sole fact that the given process fulfils at least one of the so-called “12 Principles of Green Chemistry” [7].
For some higher value market niches, biocatalytic processes provide a unique synthetic route to the desired product [8]. However, more common is that there are other competing routes to the same product. Thus, final successful implementation of the biocatalytic process is determined by its performance when compared with the competing technologies.
Despite the many potential advantages of biocatalytic processes and the increasing number of processes running on a commercial scale [5], when compared with conventional chemical industrial catalysis, biocatalysis is still a relatively young technology [9] and, as with any emerging technology, many start-up difficulties are encountered [10]. Thus, being “bio” does not necessarily mean that a process is sustainable or more environmentally friendly than a conventional synthetic route.
In nature, enzymes operate at the conditions optimal for their host organism, which are typically mismatched with the conditions required for an industrial chemical processes (such as high substrate and product concentration [P]). Hence, as expected, the vast majority of biocatalytic processes when first identified as potentially useful, do not meet the required process metrics that are key for a green and economically feasible process at an industrial scale [high Yreaction, high biocatalyst yield (Ybiocatalyst), high [P] and high space-time yield (STY)] [11, 12]. Indeed, many of the potentially most interesting biocatalytic reactions, and their corresponding biocatalysts, are still under development and, as a result, many of the reactions are neither well developed nor optimized. There are a number of previously published studies reporting the benefits of biocatalytic processes in terms of their score on the environmental assessment [13–15], economic evaluation [16, 17] and both economic and environmental assessments [18, 19]. However, these studies refer to optimized processes and/or biocatalysts and thus, the use of more complete and complex tools for early development of the next generation of biocatalytic processes is not relevant.
A particularly attractive feature of biocatalysis is the ability to engineer an enzyme (via recombinant DNA technology) to have defined properties, different from those of the wild type. This means there is always significant potential for improvement of the biocatalyst and hence the process, following initial laboratory exploration. Through advances in recombinant DNA (rDNA) technology, combined with high throughput screening techniques, knowledge-base and statistical tools have been shown to be suitable for enzyme improvement. It is expected in the near future that enzymes will be engineered at reasonable cost to fit the process specifications, making the task of the process engineer easier [20]. For this reason, it is rather important that environmental and economic assessments should not only be based on the initial process performance and design, but also on a projection of the improved process. In this way, the tools for environmental and economic assessments can provide valuable insights for development of biocatalytic processes. A systematic methodology for process evaluation adapted to each phase of the process development would support and drive the scale-up implementation, identify the potential process pitfalls and thus, guide research tasks, therefore shortening the time for development. In fact, over the development life cycle of a new process, the tools can serve three very distinct roles: (1) route selection, where the tools are a key to decision-making eliminating of synthetic routes where the reaction chemistry prevents the environmental and economic competitiveness of the process, (2) early development, where the tools are used for benchmarking (i.e., to set the targets required to achieve a competitive process) thus assisting in the selection between different process alternatives and (3) late development (following process selection, but prior to scale-up), where the tools can be used for go/no-go decision-making by assessing process profitability and the environmental profile (Figure 1). It is crucial to differentiate the goals and the tools for each process development stage, since the more design-variables are fixed (e.g., reaction chemistry, final [P], biocatalyst dosed in the reactor, downstream equipment), the smaller the weight of the other design-variables (e.g., heat integration) becomes on the environmental and economic performance [21]. Hence, the presented environmental and economic tools vary in detail and we suggest that it is necessary to use different tools to deal with the different objectives at different stages of the process development. In this paper, we propose the adoption of three different sets of evaluation tools according to the process development stage (route selection, early development and late development). Here, different tools for environmental and economic assessment are presented, exemplified with examples and their limitations discussed with respect to their applicability at the different stages in the development of a biocatalytic process.
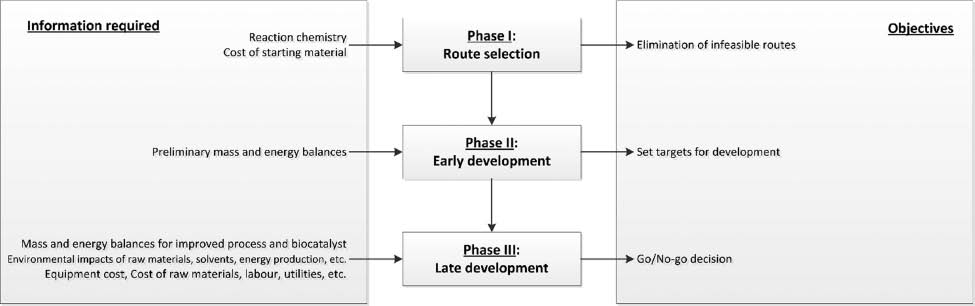
Use of environmental and economic evaluation in the development of biocatalytic tools.
2 Phase I: route selection
At the very preliminary stages of chemical process development, the choice of the synthetic route is a key design decision. Route selection can affect the selection of the reagents, solvents, reaction conditions (pressure and temperature) and (bio)catalysts. Clearly, an attractive synthetic route has a greater potential to become a greener and profitable production process [22]. Hence, the objective of adopting environmental and economic evaluation criteria at this stage of process development is to quickly eliminate infeasible reaction chemistries and synthetic routes. In route selection, only reaction stoichiometry is available and thus, the evaluation of the different routes is based on ideal reaction performance (i.e., 100% Yreaction). Furthermore, technical, safety or health issues can also contribute to eliminate synthetic routes if this involves banned or restricted substances.
2.1 Tools for environmental assessment: reaction related green chemistry metrics
Many environmental factors must be considered when selecting a synthetic route. One very useful tool at this stage of development is application of the so-called ‘Green Chemistry Metrics’. The metrics can be used during route selection, to compare between options [23–25] according to the Green Principles. These are used to evaluate the potential of the reaction chemistry and therefore it is the reaction-related green chemistry metrics that are of primary interest. They quantify exclusively the greenness of the reaction chemistry, using two metrics, namely: atom efficiency (AE) and carbon mass efficiency (CME). Additionally, beyond these two metrics, other relevant environmental, health and safety issues must also be considered at this stage (such as the use of hazardous reagents and solvents) [26]. Hence, it is also necessary to eliminate routes that involve hazardous or toxic reagents, by-products or side-products or reagents with a poor environmental footprint.
2.1.1 AE
AE, also known as atom economy, measures how much of the starting material ends in the desired product [27] [Eq. (1)]. Hence, this metric assesses the reaction stoichiometry as it does not consider the Yreaction. The driver behind this metric is the selection of a synthetic route or step targeted at product synthesis with a high mass yield and low waste [27, 28]. This principle ensures that process chemists design a reaction where as many as possible of the atoms of the substrate are included in the structure of the final product. Hence, reactions with lower AE are usually labelled as less environmentally friendly reactions [26]. AE is an easy to use metric, based on the reaction stoichiometry and mechanism [29]. However, it does not consider the by-products produced, or co-substrates used and it is based only on the reaction chemistry, not taking into account the overall process:
2.1.2 CME
CME, also known as carbon efficiency, is a green chemistry metric developed by GlaxoSmithKline (GSK) to measure the sustainability of their processes within the framework of the 12 Principles of Green Chemistry [23]. CME is defined as the percentage of carbon in the reagents that remains in the final product [Eq. (2)] and thus, the preferred reaction systems corresponds to CME=100% and a reaction with a lower CME lead to a less desired system, as there is a greater amount of carbon that will eventually end in a waste stream or as emissions. CME takes into account the stoichiometry and the amount of carbon in the reagents that is incorporated into the final product [23].
However, as noted for the previous metric (CME), it does not account for the waste generated during the process:
2.2 Tools for economic assessment: added value index
The cost of the product relative to the raw material(s) is also an important metric to use at Phase I of the development to screen routes to a specific product. The added value index (AVI), Eq. (3), accounts for the difference between the cost of the raw material(s) (or so-called cost of goods, CReagents) and the selling price of the product (CProduct). This difference defines the requirements on Yreaction and thus, the profitability range. If the raw material(s) are expensive, then higher yields must be sought, in particular when developing a new chemical entity (NCE). It is obvious that, even for an NCE, the costs of goods cannot surpass the product cost, i.e., AVI≥1 [Eq. (3)]:
2.3 Example
As an example of the application of these metrics for route selection, Table 1 illustrates different synthetic routes for the synthesis of a chiral alcohol from a ketone. For the calculation of the above described metrics, it was assumed that (bio)catalysts and cofactors were recovered after use and therefore, not included in these metrics. Table 1 highlights the fact that that catalytic reactions often score better than the stoichiometric reactions (entries 2–6). With respect to environmental, safety and health issues, the biocatalytic reactions (entries 4–6) are undoubtedly a suitable alternative to the chemical synthesis (entries 1 and 2), since both synthetic routes use borane products. In particular, biocatalysis can indeed stand as a promising alternative for the synthesis of chiral alcohols when whole-cells are used (i.e., a resting cell with ADH activity, entry 6). However, unlike often reported in the scientific literature, for systems requiring expensive redox cofactors [such as NAD(H), NADP(H) and FAD(H2)] and thus, an effective cofactor regeneration, the biocatalytic systems using isolated enzymes might not always stand as more attractive alternative (entries 4 and 5). Indeed, for all the three metrics calculated, the synthesis of chiral alcohol using isolated enzymes and a glucose as the final electron acceptor is the less interesting system (entry 5).
Environment and economic assessment for redox reactions during route scouting.
| Redox reaction | Catalyst | Environmental assessment | Economic assessment AVI | References | ||
|---|---|---|---|---|---|---|
| AE | CME | |||||
| MWProduct· MWSubstrate-1 | g C Product· <softenter;g C reagents-1 | €Product· €Reagents-1 | ||||
| 1 | 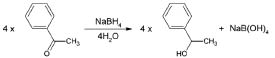 | None (stoichiometric reaction) | 0.83 | 100% | 16.5 | [26] |
| 2 | 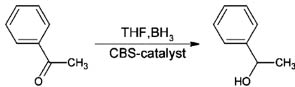 | 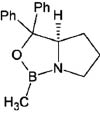 | 0.91 | 67% | 13.9 | [30] |
| 4 | 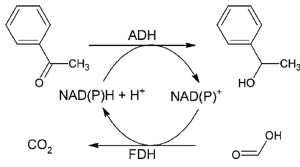 | Isolated enzyme ADH/FDH | 0.74 | 89% | 19.6 | [31] |
| 5 | 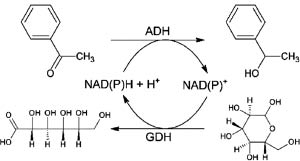 | Isolated enzyme ADH/GDH | 0.41 | 57% | 17.7 | [31] |
| 6 | 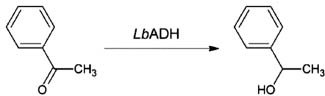 | Whole-cell | 1 | 100% | 20.3 | [32] |
Note: cost of products and raw materials obtained from www.icis.com.
ADH, alcohol dehydrogenase; AE, atom efficiency; AVI, added value index; CME, carbon mass efficiency; FDH, formate dehydrogenase; GDH, glucose dehydrogenase.
3 Phase II: early development
One of the most attractive features of biocatalysis is the ability to modify and tune the biocatalyst properties (e.g., enantioselectivity, substrate acceptance, kinetic or pH profiles under given conditions) and in recent years, enormous progress has been made in the development of new and improved methodologies to achieve this [20, 33]. One consequence is that at the early development stage, target setting is essential. Unlike evaluation during route selection (where the assessment eliminates the less favorable reaction chemistry, rather than the process to achieve that chemistry), in early development, environmental and economic assessment is focused solely on the process performance and thereby in evaluating the benefits of a particular technology to achieve a given chemistry. In particular, in early development, more important than knowing the overall economic and/or environmental score of a given process, is to understand where the major profile contributions lie (e.g., raw material, biocatalyst, solvent use or downstream processing), since these will determine the process viability and score of the different steps of a biocatalytic process (fermentation, biocatalyst formulation, reaction and downstream) and thus, it is necessary to set targets for the process performance that can be translated into the cost of the different parts of the overall process.
Hence, the objective of evaluating the process at the early development stage is to set targets for development and to evaluate the potential strategies of implementing a given biocatalytic process. Figure 2 is a schematic representation of a single step biocatalytic process, indicating the types of data required to assess the process performance. The data can be collected at small scale, provided it is under process relevant conditions.
![Figure 2 Schematic biocatalytic process. Required measure points in the process to determine the environmental and economic performance at the early development stage.Economic process metrics (white circles): 1. Reaction yield (gProduct·gsubstrate-1)a; 2. Biocatalyst yield (gProduct·gbiocatalyst-1)b; 3. Product concentration (gProduct·L-1); 4. Space-time yield [gProduct·(Lreactor·h)-1]. Environmental process metrics (grey circles): 5. Process mass intensity (greagents+product·gProduct-1)a,c; 6. Effective mass yield (gProduct·gnon-benign reagents-1)a,c; 7. E-factor (gwaste·gProduct-1)a,b,c; 8. Solvent/water intensity (gsolvent/water·gProduct-1)caCan be improved by substrate recycle; bCan be improved by biocatalyst recycle; cCan be improved by solvent recycle.](/document/doi/10.1515/gps-2013-0094/asset/graphic/gps-2013-0094_fig2.jpg)
Schematic biocatalytic process. Required measure points in the process to determine the environmental and economic performance at the early development stage.
Economic process metrics (white circles): 1. Reaction yield (gProduct·gsubstrate-1)a; 2. Biocatalyst yield (gProduct·gbiocatalyst-1)b; 3. Product concentration (gProduct·L-1); 4. Space-time yield [gProduct·(Lreactor·h)-1]. Environmental process metrics (grey circles): 5. Process mass intensity (greagents+product·gProduct-1)a,c; 6. Effective mass yield (gProduct·gnon-benign reagents-1)a,c; 7. E-factor (gwaste·gProduct-1)a,b,c; 8. Solvent/water intensity (gsolvent/water·gProduct-1)c
aCan be improved by substrate recycle; bCan be improved by biocatalyst recycle; cCan be improved by solvent recycle.
3.1 Tools for environmental assessment: process related green chemistry metrics
Experts often find it difficult to assess the ‘greenness’ of bioprocesses, by virtue of the limited data available [34]. Indeed, the number of environmental assessments of biocatalytic processes that are published today remains rather limited [34] and such studies invariably require a large amount of information which is not available at an early development stage. However, there are several simpler approaches to quantify the process environmental performance [23–25], by using process-related green chemistry metrics. These metrics quantify the overall process (including the reaction chemistry, covered by the reaction-related green chemistry metrics). There are potentially six metrics to be applied (dependent on the nature of the reagents involved in the process), namely: process mass intensity (PMI), effective mass yield (EMY), environmental factor (E-factor), water intensity (WI), solvent intensity (SI) and carbon factor (C-factor).
3.1.1 Reaction mass efficiency
Reaction mass efficiency (RME) (also known as mass efficiency) is a metric developed by GSK. This metric takes into account the Yreaction and the actual molar quantities of reagents, as well as the atom economy [23]. RME can be calculated by computing the quotient of the mass of the product by the mass of all the reagents in the process [Eqs. (4) and (5)] [23]. However, this metric does not account for the type of waste generated, solvent use, work-up (e.g., quenching) or energy use [26, 35]:
3.1.2 E-factor
The E-factor analyzes the amount of waste formed in the synthesis of chemical compounds [36], quantifying it as the amount of waste created/kg of product produced. Despite the simple definition of E-factor, this metric can be made as complex and thorough as is required. In a simplified viewpoint, this metric can be defined as the inverse of the RME as, at this stage, assumptions on solvent and other factors can be made. By contrast, a more thorough analysis can be performed when including solvent and catalyst recycling. Therefore, this green chemistry metric has been recognized as a valuable measure to provide information about the environmental performance and waste footprint of a given synthetic route or process [37]. In the E-factor, the waste is defined as everything leaving the process boundaries, except the desired product. Therefore, the E-factor takes into account the Yreaction, including solvent and reagent losses and process aids [38]. The E-factor includes not only the reaction chemistry and the process options related with the reaction, but can also include all the steps in a chemical synthesis, upstream or downstream of the reaction step [Eq. (6)]:
Under stoichiometric conditions (i.e., no excess), assuming that solvents and catalysts are recycled, the E-factor and RME are related according to Eq. 7, and in such situations, the use of both metrics is unnecessary:
Water is generally excluded from the E-factor, as this could lead to excessive E-factors for some processes (such as bioprocesses), making a meaningful comparison of the results difficult [37]. Since water is usually benign, the solvent of choice for green chemistry is frequently water, whereas organic solvents are more often used in conventional chemical synthesis [39]. There is a historical perception that water by itself does not have a significant environmental impact. However, one must remember that many chemical processes require highly purified water and there are life cycle impacts related to the water purification step. In addition, in many chemical synthetic routes, a mixed aqueous-organic waste stream is generated and therefore additional recovery units are required to further separate the phases prior to the wastewater treatment plant. Furthermore, nowadays, assessing the water footprint of a given process is also a measure of sustainability, since in many parts of the world competition for water is becoming more of a concern and seems certain to become a greater issue in the future [40]. Therefore, two types of E-factor should be considered: one excluding water [Eq. (6)] and one including water [Eq. (8)]:
However, this green chemistry metric does not consider what type of by-product or waste is generated. The E-factor can also be used for multi-step reactions, although the result only provides a benchmark guide for different sectors and markets of the chemical industry [41].
In the study presented by Henderson et al. [13], where a biocatalytic route was compared with the conventional chemical synthesis, the biocatalytic route led to a higher E-factor, whereas when using a simple life cycle assessment (LCA) model (FLASC tool [42]) this synthetic route shows better results with respect to energy consumption and greenhouse gas emissions [13]. However, in this case, there is a high water contribution to the E-factor of the biocatalytic route, whereas for the E-factor of the conventional chemical route, only the mass of unrecovered solvents are accounted for, leaving the solvent recovery processing steps out of the environmental evaluation. Hence, a drawback of the E-factor as an accurate metric is the need to define system boundaries before calculations. Furthermore, this simplified metric only accounts for one environmental impact (i.e., waste generation), leaving aside other relevant outputs and thus, the exclusive use of this metric can lead to biased results.
3.1.3 PMI
PMI is the metric chosen by the American Chemical Society Green Chemistry Institute’s Pharmaceutical Roundtable as a high-level metric to evaluate the extent to which a given manufacturing process is sustainable [43]. PMI is defined as the total mass of materials used to produce a specified mass of product [43], Eq. (9). When calculating PMI the starting point is the commonly available materials [43]. Hence, the metric accounts for all the steps in the chemical synthesis including the catalyst production and all reagents (including water) that are used directly in the process [44]. Additionally, PMI also includes the downstream process (DSP) steps required for isolation and purification of the final product at the required quality [44]. However, PMI does not include specific concerns regarding the environment, health and safety of the raw materials used or the waste produced. However, such concerns are normally addressed during route selection:
3.1.4 SI and WI
From a careful assessment of many of the synthetic routes to chemical products, solvents have been found to be one of the biggest mass contributors [45], as the use of solvents can lead to higher yields and thus, an improved environmental performance. This is particularly the case in the fine chemicals and pharmaceutical sectors, where the solvents typically contribute 80% to 90% of the mass intensity of a process [46]. For these sectors, it was observed that solvents contribute to about 75% of the total energy usage (used in solvent work-up and recycling), around 70% to volatile organic compounds (VOCs) emissions (and thus, to the photochemical creation potential) and about 50% for the global warming potential (GWP) [18, 19, 47]. Furthermore, the solvent production process also contributes greatly for the solvents total environmental impact [48, 49]. Hence, SI was defined as a metric in order to address the limitations raised when applying the E-factor, by analyzing and quantifying the amount of all solvents used in a given synthetic process [Eq. (10)]:
There are several solvent selection guides available in the scientific literature from GSK [50, 51], Pfizer, AstraZeneca and the American Chemical Society (ACS); these have a great focus on safety, health and environmental issues. A systematic methodology for solvent selection from an operational and environmental perspective (also integrating partially solvent selection guides) has been developed by Gani and co-authors [52, 53]. When choosing a solvent for the development of a process, it is important to take into account the environmental impact of the chosen solvent, and the potential safety and health risks associated with handling and operating with the given solvent [52]. Solvents with issues should therefore be avoided. Furthermore, other issues related with the ease of separation and recovery of the products and enzyme compatibility are often only regarded as a secondary aspect by the abovementioned solvent guidelines. Hence, solvent selection should include a score for options to recycle the solvent. For instance, for water-miscible solvents, where the solvent recovery is commonly done by distillation and evaporation, the solvents should be ranked according with the differences on the vapor pressure, whereas for immiscible solvents, the operation unit mostly used is liquid-liquid extraction and thus, the solubility differences should be the basis for the ranking. Moreover, an adequate solvent for biocatalytic processes should not cause catalyst inactivation or degradation. For water-immiscible systems (two liquid-phase systems), the solvent should be as immiscible as possible in water, in order to reduce biocatalyst contact with the potentially toxic solvent. Nevertheless, for these systems, the liquid-phase interfaces have toxic effects on the biocatalyst, since solvents with high partition coefficients (log P>4) are argued to have less toxic effects on biocatalysts [54, 55]. For water-miscible solvents, the solvent effect on the biocatalyst is dependent on its concentration and thus, the biocatalyst should be developed to tolerate these conditions. Finally, another constraint when selecting the organic solvent is the solvent reactivity, as it should not interact with the substrates nor products by reacting or degrading, or likewise the biocatalyst (e.g., avoid using organic solvents with the same functional group as the substrate).
A particular version of SI is WI, where the focus is on analyzing the amount of water used throughout the whole process [Eq. (11)]. WI is of special interest in biocatalysis and fermentation processes, since one of the most attractive features of bioprocesses in organic synthesis is the possibility of operating with an environmentally compatible solvent (water) [39, 49] often representing more than 50% of the resources mass [19]. However, water has become a scarce and overexploited natural resource. In addition, these processes usually lead to a large amount of wastewater that needs to be properly cleaned and this is usually very energy intensive [56]:
Nevertheless, the type of solvent used (or the quality of the water used) is not specified and a methodology for measuring the relative greenness of a given solvent is still required. Furthermore, the environmental issues related with the solvent recovery are not addressed by this metric.
3.1.5 Other metrics for environmental evaluation
The Green Chemistry community has generally agreed that a suitable metric should be clearly defined, simple, measurable and objective rather than subjective [57]. Despite the weaknesses of the abovementioned metrics, these fulfill (at least, partially) the requisites for suitable metrics. There are other metrics that can be applied at the early development stage (such as environmental quotient, EQ [58], EMY [59] and the C-factor [60]). However, the correct application of these metrics requires more information that is often not readily available at this development stage.
The EQ is an attempt to overcome the flaws of the E-factor, by multiplying the E-factor by a quotient that measures the type of waste [Q, Eq. (12)]. This quotient has an arbitrary value between 1 and 1000 (where 1 is the optimal waste type), depending on whether the type of waste produced is innocuous, waste toxicity and ease of recycling [58]. However, the quotient is set on a rather arbitrary and subjective ground:
The EMY is defined as the percentage of desired product relative to the mass of all non-benign materials used in its synthesis [Eq. (13)] [59]. Unlike the previously described metrics, this metric highlights the ecological effect of the reagent(s) and reaction additive(s). However, the EMY lacks a precise definition of non-benign reagents, currently defined as “those by-products, reagents or solvents that have no environmental risk associated with them” [59]. Nevertheless, this definition cannot specify or quantify the environmental risks in an objective way. Furthermore, the EMY only highlights one potential environmental impact (toxicity), disregarding others, such as the GWP or waste generated. Hence, the use of the EMY is hindered by the availability of information regarding human toxicity and ecotoxicity. For example, when assessing a biofuel production process, this metric would give a favorable score to the process, since typically the reagents are renewable feedstocks and would be considered benign reagents. This is clearly erroneous:
The C-factor quantifies the amount of CO2 produced/kg of product formed [60] [Eq. (14)]. The innovation in this green chemistry metric is the life cycle thinking, since the C-factor includes all the CO2 produced from the raw material production, preparation, conversion and purification of the chemical. Nevertheless, use of this metric has some potential shortcomings and for this reason it was excluded from the suggested metrics listed in Figure 2. Briefly, while the production of chemical products (in particular fine chemicals and pharmaceuticals) involves many environmental issues, such as emission of VOCs, toxicity or nutrient enrichment, the C-factor focuses solely on one environmental concern (GWP) [61]. Thus, the exclusive use of the C-factor for environmental assessment leads to a risk of these other issues being neglected. Furthermore, the C-factor as defined, only accounts for the emission of CO2, as part of the GWP. This may be misleading, especially when using renewable resources where emissions of methane (CH4) and nitrous oxide (N2 O) have an equal (if not greater) potential contribution to global warming [62]. Furthermore, for fine chemicals and pharmaceuticals the calculated C-factor for the reaction performance often leads to biased results, as the large downstream impact of the process is not considered. While for bulk chemicals, the C-factor is often small [61], but it disregards the contribution of the raw materials production phase, which is often more energy intensive and thus with a higher C-factor than the production phase itself [63]. Finally, the inventory of CO2 emissions itself is a time consuming task to ensure it is sufficiently comprehensive.
The energy loss index was introduced on a decision framework for process design developed by Sugiyama and co-workers [21]. This metric is an indicator to estimate the energy-related efforts associated to the process, using only the available reaction information forecasting the energy and utilities that will be required in a large scale. This index has a value of 0 (low) to 1 (high estimated energy demand) according with: reaction medium (aqueous or organic solvent), [P], difference of boiling points, inherent waste and reaction energy [21]. However, this metric only gives a qualitative score of the process energy demand and it was thought to be applied exclusively for a process requiring distillation processes on their recovery and purification processes, whereas the impact of the reaction adjuvants (such as co-solvents and catalysts), operating conditions and other unit of operations are not accounted for in the process energy demand.
3.2 Tools for economic assessment: process metrics
The use of process metrics allows the integration of the objective function for cost optimization at the early development stage. Dependent upon on the industrial sector of interest (i.e., bulk, fine chemical or pharmaceutical) the engineer can estimate the annual production, the expected market value and revenue. The market value and annual production (defining which market segment the product of interest falls into) have a great influence on the scale, mass and energy balances and therefore, the threshold values for the process metrics are also determined by this (see Table 2 and Figure 3).
Typical threshold values for process metrics (adapted from [64]).
| Process metrics | Cost | Annual production | Reaction yield Yreaction | Biocatalyst yield Ybiocatalyst | Product concentration [P] | Space-time yield STY |
|---|---|---|---|---|---|---|
| Units | €·kgProduct-1 | ton·year-1 | % | gProduct·gbiocatalyst-1 | gProduct·Lreactor-1 | gProduct·(Lreactor·h) -1 |
| Bulk chemical | 0.5–10 | 104–106 | >95 | 103–105 | >300 | >10 |
| Fine chemical | 10–50 | 102–104 | >90 | 102–103 | >150 | >2.5 |
| Pharmaceutical chemical | >100 | 10–103 | >90 | 10–102 | >60 | >1 |
![Figure 3 Typical relative contribution of raw material, biocatalyst production and downstream on the operating costs of a chemical (adapted from [5], [22], [43], [46], [65]).](/document/doi/10.1515/gps-2013-0094/asset/graphic/gps-2013-0094_fig3.jpg)
Typical relative contribution of raw material, biocatalyst production and downstream on the operating costs of a chemical (adapted from [5], [22], [43], [46], [65]).
Hence, four process metrics are proposed in order to evaluate the required development efforts and to assess the contribution of each individual step towards process feasibility: Yreaction (as a measure of the raw materials cost contribution), Ybiocatalyst (assessing the cost contribution of the biocatalyst), [P] (assessing the cost contribution of the DSP) and STY (accounting for capital cost via the size of the equipment necessary to fulfill a given productivity). Interestingly, the environmental and economic performances are often found correlated and indeed the four metrics proposed here have an effect of both environmental as well as economic assessment of a given process (Table 3).
Suitable metrics for early development process evaluation.
| Environmental metrics | Economic metrics | ||||
|---|---|---|---|---|---|
| Yreaction % | Ybiocatalyst gProduct·gbiocatalyst-1 | [P] gProduct·Lreactor-1 | STY gProduct·(Lreactor·h) -1 | ||
| RME | gProduct·g all reactants-1 | x | |||
| E-factor | gwaste generated·gProduct-1 | x | x | x | |
| PMI | g all reactants and products·gProduct-1 | x | x | x | |
| SI/WI | gsolvent/ water·gProduct-1 | x | x | ||
X denotes the relationship between environmental and economic metrics at Phase II
E-factor, environmental factor; [P], product concentration; PMI, process mass intensity; RME, reaction mass efficiency; SI, solvent intensity; STY, space-time yield; WI, water intensity.
3.2.1 Yreaction
Efficient conversion of the raw material is an essential requirement for process success, since high Yreaction (% molProduct/molSubstrate) simplifies the downstream separation and leads to a more cost-effective process, lowering the environmental and economic contribution of the raw material to the final process performance. Ultimately, the yield (and the associated cost differential of the substrate and product) determines the available opportunity for processing. For example, a low yield implies very little freedom for costs in the rest of the process. Since raw material costs are often in the range of 35%–90% of the total processing cost [18, 66], dependent on the industrial sector, there are different threshold values for the suggested Yreaction for each market (Table 2). When aiming for the production of a low value (bulk) chemical, there is a small gap between the cost of the raw material and the profitable product cost (>80% of the total processing cost [66]). Therefore, the production costs are often dominated by the cost of the raw materials and very high Yreaction are required. A higher Yreaction also has a positive effect on the environmental performance, leading to higher RME (by virtue of better raw material use), lower PMI (due to the lower mass contribution of the raw materials) and a lower E-factor (since there is a smaller amount of raw materials in the waste stream).
Furthermore, achieving a high conversion of a fossil-based raw material (as is the case for many fine chemicals and pharmaceuticals [34]) leads to lower cumulative energy requirements [and consequently lower global warming, acidification potential (AP), human and eco-toxicity impacts]. For bio-based raw materials, a high Yreaction might lead to lower nutrient enrichment potential (NEP) (due to reduced use of fertilizers during the growing of crops) and other land use aspects [34]. Due to the high selectivity of enzymes, when highly functionalized molecules or those with several chiral centers are aimed at, the biocatalytic route might appear to be a suitable alternative to avoid protection and de-protection steps (with an overall reduction of the process steps) and thus, the theoretical yield can be greatly improved and the amount of waste minimized [34]. Nevertheless, at industrially relevant conditions, high yields (i.e., high concentrations, presence of solvents) might be difficult to achieve, not only due to catalyst inhibition and/or stability (substrate or product at concentrations above their inhibitory level and/or presence of organic solvents), but also many of the industrially relevant biocatalytic reactions are not thermodynamically favorable (e.g., chiral amine synthesis using ω-transaminase). For these reactions, the allowable cost contribution of the raw material determines the efforts required for displacing the equilibrium (such as use of an excess of co-substrate or in situ product removal). However, for low value chemicals, the reaction thermodynamics might influence the process viability, since these types of chemicals have a smaller allowable cost for downstream processing (for co-substrate recovery and recycle) and often cannot afford the implementation of expensive process technologies to shift the equilibrium (e.g., membrane technology or resins for in situ product removal).
For instance, the asymmetric synthesis of amines can be performed with high Yreaction (>90%) using a vanadium catalyst and tert-butanesulfinamide as the amine donor [67] and thus, the Yreaction of the ω-transaminase-catalyzed reactions should at least match the overall Yreaction of the chemical route. However, under the mild operating conditions at which the biocatalytic reaction takes place, the synthesis of the amine from a pro-chiral ketone is very often hindered by the unfavorable thermodynamic equilibrium. Hence, by putting in place first a target to the Yreaction, the process can be designed in such a way that process technologies are put in place and the equilibrium can be shifted towards the amine production, as demonstrated (for instance) by Truppo and co-workers [68]. Among the strategies to shift the equilibrium, the use of an excess of one of the reagents is often used to improve the Yreaction. However, the use of this strategy leads to higher waste produced in the reaction (if the excess of substrate is not recovered) and might lead to additional downstream processing steps to recover or separate the unreacted substrate from the product.
3.2.2 Ybiocatalyst
Even enzymes for which the optimization of the expression system is not fully realized can be applied in industrially relevant processes [5], as the biocatalyst cost in itself does not mean much. The relevant question to address is how much the cost of the biocatalyst (including fermentation and biocatalyst formulation) contributes to the final processing cost (when compared with the competing synthetic processes). Furthermore, some of the environmental considerations of the biocatalyst production are also covered by the Ybiocatalyst (Table 3), since the fermentation step can have a large impact on land use footprint, NEP (due to growing of the carbon source crop) and AP (due to energy demand) [69]. Moreover, a process that has a low Ybiocatalyst (i.e., a higher biocatalyst use) implies higher PMI (due to a higher mass contribution of the biocatalyst), a higher E-factor (since the amount of biocatalyst in the waste stream is higher) and higher WI (related with the higher fermentation broth volumes). Furthermore, for the production of the catalyst itself, the media preparation and the immobilization procedure are the two main contributors for the environmental impacts [42, 69]. Typically, for optimized processes, the contribution of the enzyme to the overall environmental impact is small compared to the environmental impact of the raw material and production process. Nevertheless, at early development stages, often the biocatalyst activity and half-life time have not been optimized to match the large-scale conditions and thus, using this process metric tells the biologist the targets for the biocatalyst improvement and the large-scale conditions (i.e., concentrations, presence of inhibitors, etc.). Therefore, processes where the biocatalyst contribution is significant lead also to a less sustainable process (Table 3). It is therefore necessary to set a threshold value for the efficiency of the biocatalyst (Ybiocatalyst, gProduct·gbiocatalyst-1).
3.2.3 Product concentration
Recovery of the final product from the reaction phase is a critical step and it is often overlooked in laboratory assessments of biocatalytic processes. Clearly, the extent (and consequently the allowable cost) of the DSP is dependent on the product’s subsequent use.
Despite being beneficial for biocatalyst activity and stability, operating at low [P] (gProduct·Lreactor-1) compromises the DSP, due to the high volume of water (or organic solvent) that it is necessary to remove (often by evaporation), prior to effective processing. Hence, operating at low [P] increases the PMI (due to an increase in the mass contribution of water and solvents [19]), the E-factor (since the amount of water or solvents in the waste stream increases), the process energy requirements [49] (and consequently the energy costs and the emissions related with energy production), the SI (leading to VOCs emissions), the process water footprint (or WI) and volumetric capacity of the DSP units of operation (with subsequent increase of the capital costs of the DSP), as also reported by Ravelli et al. [49] for a photocatalytic reaction. Hence, unless the product is removed during the course of the reaction by in situ product removal, there is a trade-off between the biocatalyst activity and stability (and consequently the Ybiocatalyst) and the final [P], that determines the process performance (Table 3).
3.2.4 STY
When developing a new process, the business drivers are two-fold: economic (CAPEX and OPEX) and environmental (often greenhouse gas emissions) and thus, energy requirement reductions are often targeted [70]. High STY, or volumetric productivity, gProduct (Lreactor·h)-1, is required to lower the capital costs (CAPEX) and energy requirements during the reaction (lowering utility costs, labor related costs, emissions and environmental impacts related with energy production, such as the C-factor, AP and GWP). Indeed, a significant share of the greenhouse gas emissions in bioprocesses originates from the energy use and the type of energy input [71]. Tufvesson and co-workers [71] reported that changing the input energy from fossil (hard coal and natural gas) to a less carbon intensive (such as bioenergy) led to a reduction of about 20% of the GWP [71].
This process metric assesses the speed at which the reaction occurs, for a given equipment occupancy time and required production rate. When performing cost evaluation, there is often a trade-off between the STY and Ybiocatalyst, since operating at higher biocatalyst loading increases the STY (reducing the time that the reaction takes to reach completion and consequently CAPEX, utilities and labor related costs) at the expense of increasing the biocatalyst cost contribution, unless recycling and reuse is possible. Hence, the STY and [P] are indicators of the cost and impact of the process energy required, representing the upstream (i.e., reaction section) and the downstream (i.e., product recovery and purification section) costs. Furthermore, together, the Ybiocatalyst and STY determine the requirements (targets) for biocatalyst specific activity and stability.
4 Phase III: late development
Despite the potential of biocatalytic processes to provide selective and resource efficient synthetic alternatives in organic synthesis, the success of the biocatalytic processes at a large-scale is determined by performance when compared with the competing technologies. Hence, at the late development stage, specific considerations not covered by the aforementioned metrics must be raised in order to identify process pitfalls, bottlenecks and identify the competitiveness of the biocatalytic route, against the previously identified suitable alternatives.
At the late development stage, decision-making in process design is a challenging activity as it requires an immense amount of detail and it involves trade-offs of conflicting optimization goals, namely costs, technical feasibility and environmental impact. The goal of implementing process evaluation tools at this stage is to assist in go/no-go decision-making and also to identify the process inputs that require optimization and/or a tighter control. The starting point of the economic and environmental evaluation is a complete description of the mass and energy balances. Therefore, at this stage, the process should have a certain maturity so the process adjuvants, solvents, etc. are known and the units of operation for upstream and downstream are also known, since only with this information can the engineer take an informed decision either to implement or discontinue the process.
4.1 Tools for environmental assessment: life cycle assessment
The use of simple metrics is an attempt to measure the process chemistry and efficiency in a straightforward way and does not require process details, making it attractive to assist in initial process design decision-making. However, with simplicity might come several drawbacks, such as the fact that most of the metrics do not distinguish between waste types and emissions [46]. Furthermore, these metrics do not consider the waste generated upstream or downstream of the investigated process step(s).
At the other end of the spectrum, a more elaborate and comprehensive tool to quantify environmental effects is LCA [28]. LCA is a systematic approach to determine the environmental impact associated with products, processes and services. LCA assesses environmental burdens by quantifying energy and materials used, as well as wastes released into the environment. This assessment includes the entire life cycle of the product, process or activity including extraction and processing of raw materials, manufacturing, transportation and distribution, use, recycle, waste treatment and final disposal [72]. Unlike green chemistry metrics, LCAs are not specific for (bio)chemicals, chemical or bioprocesses. Indeed LCA was developed to be a suitable environmental assessment tool for all kinds of products and processes and today there are LCAs published for many different products from food [73] to television sets [74]. LCA is a standardized (and regulated) tool (ISO 14040) that provides detailed information about the type of emissions and the environmental impact over the life cycle of the product or functional unit. LCA provides a framework for reporting applicable green metrics reflecting the whole life cycle of a given product (i.e., from raw material to the disposal stage) [75]. LCA metrics can be reported as inventory data (energy consumption, raw material consumption or emissions), a measure of individual potential environmental impacts (such as GWP, acidification, nutrient enrichment), or as an aggregated score or index (such as EDIP, CML or Eco-Indicator) [62].
One of the most relevant steps of the LCA is to calculate a range of environmental impacts. These are classified in impact categories (e.g., GWP, photochemical ozone formation, human and ecotoxicity). The environmental impacts are classified accordingly to their radius of action into global, regional or local impacts. The chemical’s potential impact is often expressed as an equivalency factor (e.g., gCO2-eq, gC2 H4-eq). Substances which can contribute to more than one type of environmental impact require an equivalency factor for each type of impact. For example, emission of methane contributes to GWP and photochemical ozone formation. Hence, the emission of 1 g methane is translated on the impact assessment as 25 gCO2-eq and 0.007 gC2 H4-eq [62]. The equivalency factor expresses the emission measured relatively to a reference substance. Table 4 shows the environmental impact potentials and the appropriate unit (or equivalency factor).
Environmental impact potentials.
| Type of environmental impact | Environmental impact | Abbreviation | Equivalency factor |
|---|---|---|---|
| Global | Global warming potential | GWP | gCO2-eq |
| Stratospheric ozone depletion potential | SOP | gCFC11-eq | |
| Regional | Photochemical ozone creation potential | POCP | gC2 H4-eq |
| Acidification potential | AP | gSO2-eq | |
| Nutrient enrichment potential | NEP | gPO43--eq | |
| Local | Eco toxicity potential | ETP | PAF.m3.day |
| Human toxicity potential | HTP | cases | |
| Hazardous waste potential | HWP | kg | |
| Bulk waste | BWP | kg |
PAF, potentially affected fraction of species.
The importance of a given impact category varies depending on the type of chemical assessed [76]. More complex chemistry (such as synthesis of fine and pharmaceutical chemicals) often requires more processing steps and thus, often leads to more waste generation and a higher energy consumption, than bulk chemicals [34]. Several companies have reported the environmental profile of their processes or products by describing the equivalent emission of greenhouse gases or energy savings. Nevertheless, when performing an environmental assessment on a given chemical, one should choose the most relevant impact potential. For example, solvents are one of the biggest mass contributors in the production of fine or pharmaceutical chemicals process due to the low water solubility of many substrates and products [46] and VOC emissions are mainly due to solvent use [62]. Hence, when assessing such chemicals, it would be more relevant to study the impact assessment of regional and local impacts as photochemical ozone formation potential (instigated by high concentrations of VOC) and eco and human toxicity potential (due to emission of toxic particles during the chemical production process [77]). By contrast, when fuel production from renewable resources is evaluated, it would be more beneficial to analyze the potential impact on greenhouse gases emission, nutrient enrichment and land use. When comparing process options for the manufacture of biofuel or large volume (bulk) chemicals, or in fermentation processes (such as biocatalyst production), the impact of the cultivation of the raw materials (for the carbon-source) on global warming and NEP is influenced mainly by the choice of crop, but also by the process yield. Therefore, the yield coefficient of biomass on carbon substrate (Ysx) could be a very useful assessment metric. Primary energy demand is also a suitable metric to measure the process efficiency, mostly for the fermentation and DSP steps. In a similar away, AP can also measure the process efficiency, as the most significant man-made sources of acidification (i.e., SO2) are combustion processes for electricity and heat production [62] (although the relationship is rather dependent on the type of fuel used for energy production and its sulfur content).
Nevertheless, LCA is often a laborious task, since it requires a large amount of data from a variety of sources [46] and therefore its applicability to bioprocess is reserved only for late development, when detailed information about the raw materials is available. In order to facilitate environmental assessments, several companies have developed in-house modified LCA methodologies and software tools, such as FLASC [42], BASF Eco-efficiency method [78], GREENSCOPE [79] [a Waste Reduction Algorithm (WAR [80]) based software], EATOS [81] and EcoScale [82]. Nevertheless, the simpler approaches still require a defined process (i.e., defined solvent, auxiliaries, upstream and DSP) and are thus not suitable for the previous development stage (Phase II: early development) when neither the biocatalyst and process are under development; whereas, to be used at Phase III, many of the above-mentioned tools fail on providing an objective (e.g., EcoScale penalties does not distinguish the amount of solvent or reaction time [15]) and a complete picture of the environmental impacts (e.g., EATOS and BASF methods are exclusively based on the mass metrics and on potential toxicity impacts and safety of the materials used, while the other impact categories are not accounted for [15]). Hence, at a later development stage, only an evaluation based on the LCA methodology will be able to give a fair judgment of the environmental performance. However, there is a limitation of available LCAs of chemicals (in particular for fine chemicals and pharmaceuticals) and LCA does not yet enjoy widespread practice for environmental assessment in bioprocesses (with the exception of biofuels [34]), the difficulty in assessing renewable raw materials being one of the main reasons [34].
4.2 Tools for economic assessment: cost estimation
Economic evaluation is a decision-making tool to quantitatively estimate the expected profitability of a process, often in comparison with other processes [83]. The four essentials of an economic study are: problem definition, cost estimation, revenue estimation and profitability analysis. Additionally, characterization of the uncertainty and risk is required.
Cost estimation is extremely useful during the development of a chemical process, since it allows cost control and debottlenecking. Cost estimation can be divided into two categories: capital investment (CAPEX) and operating cost (OPEX).
Capital investment (CAPEX) corresponds to the sum needed to get the project started, for the machinery and equipment installation and can be classified in fixed capital and working capital [84]. Fixed capital refers to the capital necessary for all installed equipment and accessories required in the process operation and start-up [83, 85]. Fixed capital comprises the cost of purchasing, delivery and installation of equipment, piping, automated control, buildings and structures, site preparation, land (direct plant costs), engineering and construction (indirect plant costs) and contractor fees and contingency allowances (non-plant costs) [83, 84]. Working capital is the sum required for the day-to-day operation and includes the cost of inventories, supplies and some of the start-up expenses. The fixed capital investment is an important cost when developing the economics of a process, since this figure is used to estimate operating expenses and project profitability [85]. The accuracy of a fixed capital estimate is a function of the design effort involved [83]. As the project design is refined, the estimate evolves from the various preliminary phases into a more detailed and accurate estimate [83].
The operating (or manufacturing) cost (OPEX) is an important part of the economic evaluation. It consists of direct, indirect and fixed costs. The operating costs that need to be determined for decision-making during scale-up include raw materials, utilities (including waste management) and operating labor. Other direct production costs (such as supervision, repair and maintenance), indirect and fixed operating costs are usually calculated through direct labor costs and/or annual capital investment costs [83, 85].
Evaluation of the costs in the preliminary design stage involves guesses and applications of rules-of thumb. This means that the quality and accuracy of these estimations are to some extent dependent on the experience of the engineer [83]. Regardless of the level of detail and complexity in cost estimation and environmental impact evaluation, a certain degree of uncertainty will always remain [84]. This makes it is necessary to evaluate the effect of certain modifications to the original project on the total process environmental and economic performance by performing a sensitivity analysis.
5 Discussion
The increased use of environmental and economic assessment during the early development raises the question of comparability of the results. Often, well-established and optimized synthetic routes are compared with under-optimized biocatalytic processes, giving misleading results [34]. When looking at emerging processes (such as biocatalytic processes), it is necessary to consider potential changes to the process by implementation of biocatalyst engineering and/or process modification.
In the last decades, several green chemistry metrics have been defined, many of those with the same ideas and concepts [26] (e.g., atom economy, actual atom economy [86], EQ [58], e-factor based on molecular weight [35], stoichiometric factor [35]), which can explain the low acceptance of green chemistry metrics as a suitable assessment during the early stages of the process development. The use of more complete and complex performance assessment tools (such as LCA and/or full costing) during the early stages is definitely not a suitable strategy, as many of the process details are not yet defined, nor is the process optimized and thus, the output of these evaluations are highly sensitive to the quality and quantity of the input information. Nevertheless, several relevant mass metrics such as green chemistry metrics and process metrics are a necessary step to perform an LCA and determine process footprints [43]. Hence, it is necessary to select a suite of appropriate and relevant metrics that can well foresee the performance evaluation and relate with the environmental impacts and costs at a later stage (Table 5).
Correlation between green chemistry metrics and life cycle assessment environmental impact impacts potentials.
| Environmental evaluation at late development stage | Environmental evaluation at early development stage | ||||
|---|---|---|---|---|---|
| PMI | EMY | E-factor | SI/WI | ||
| Global warming potential | GWP | If oil-based | |||
| Photochemical ozone creation potential | POCP | If oil-based | x | ||
| Acidification potential | AP | If oil-based | |||
| Nutrient enrichment potential | NEP | If bio-based | |||
| Eco toxicity potential | ETP | If oil-based | x | ||
| Human toxicity potential | HTP | If oil-based | x | x | |
| Hazardous waste potential | HWP | x | x | ||
| Bulk waste potential | BWP | x | |||
E-factor, environmental factor; EMY, effective mass yield; PMI, process mass intensity; SI, solvent intensity; WI, water intensity.
Many of the Green Chemistry Metrics, such as those suggested by Andraos [35] and Calvo-Flores [26] are good attempts at identifying the greenness of a process during route selection and early development stage. However, these metrics do not always translate in a straightforward way the LCA environmental impacts or the cost estimation at the late development stage.
Furthermore, the metrics chosen for the environmental evaluation in these two studies are redundant and they lack a correlation between these mass metrics with more complex and complete metrics. By acquiring a good understanding of the process during the early development stage, the engineer can already foresee some of the results at a later stage evaluation (see Table 5). For instance, a process with a higher SI will certainly lead to a higher VOCs emission and thus, a higher photochemical ozone creation potential (Table 5). In a similar way, the process metrics can also indicate the main cost drivers in the cost estimates (Table 6).
Correlation between economic process metrics used at the early development stage and cost estimation used at late stage.
| Economic evaluation at late development stage | Economic evaluation at early development stage | |||
|---|---|---|---|---|
| Yreaction | Ybiocatalyst | [P] | STY | |
| Capital cost | ||||
| Direct fixed capital costs | ||||
| Equipment cost | x | x | x | |
| Piping and instrumentation | Estimated from equipment costs | |||
| Others | Estimated from equipment costs | |||
| Indirect fixed capital costs | ||||
| Allocated costs | Estimated from equipment costs | |||
| Working costs | ||||
| Others | ||||
| Operating costs | ||||
| Direct manufacturing costs | ||||
| Raw materials | x | x | ||
| Utilities cost | x | x | ||
| Direct labor | x | |||
| Others | Estimated from labor costs | |||
| Indirect manufacturing costs | Estimated from labor costs | |||
| Fixed costs | Estimated from direct fixed capital costs | |||
| Others | ||||
[P], product concentration; STY, space-time yield.
Despite the industry interest in promoting innovation in the pipelines implementing greener processes, it is the economic success and profitability that are the catalysts for the development of new processes at a large scale. For instance, when developing a new API, where the speed of development is crucial for the process success, at the early development stages the role of the chemical engineer is not to improve the process so it leads to savings in the emissions or costs, but instead his/her role is to make the process safe using hazard analysis (e.g., fault tree analysis [87], HAZOP [88]). However, when considering the replacement of technologies (e.g., implementation of a biocatalytic), production of generic pharmaceutical, a bulk or a speciality chemical, where typically there are several rounds of optimization before large-scale implementation, the application of the described metric to guide process design will set the guidelines for R&D and thus, lead to savings at implementation.
Sugiyama and co-workers [21] proposed a decision framework integrating not only economic and environmental aspects, but also Environment, Health and Safety (EHS) aspects. However, this methodology does not consider the process maturity and thus, well-established optimized conventional technologies are compared with not fully optimized processes (as is the case of the emerging biocatalytic synthetic routes) which gives misleading results. Moreover, selected metrics are very specific for the production of methyl methacrylate and the studied routes, where the cumulative energy demand is the only environmental impact accounted for.
All of the environmental and economic assessments published are for well-established and developed processes where indeed, the biocatalytic synthesis can be a suitable alternative. Nevertheless, many of these studies fail in giving a complete picture of the biocatalytic process environmental impact, since neither the biocatalyst production nor product recovery is included. Furthermore, for energy intensive processes (such as the typical production of pharmaceutical compounds), short-cut or simplified methodologies where the amount of energy consumed is disregarded (such as EATOS) are inadequate tools. For processes using bio-based raw materials, methods that do not include land use aspects are thus, unable to provide a fair comparison.
Kuhn and co-workers [19] reported that the biocatalytic productions are typically capital and energy intensive, due to the fermentation process, and thus it is necessary to set targets for the biocatalyst development, not only in terms of activity, but also in enzyme expression (if isolated) or cell-growth (if whole-cell). Furthermore, despite the negative and (often) the most critical impacts of some of the organic solvents [15, 18], operating in an aqueous media does not represent a greener or cheaper solution [19] and thus, it is crucial to set guidelines for the substrate(s) and product(s) concentrations at which the biocatalyst should be able to operate effectively. To achieve these research targets, the biocatalyst must be improved either by process technologies (e.g., enzyme immobilization) or by rDNA technology. When doing a complete assessment, it is necessary to include the environmental and the capital and operation costs of the DSP.
5.1 Recommendations
Many of the reviewed articles compare biocatalytic processes with conventional production paths, where several environmental and economic benefits of the biocatalytic route could be found. Nevertheless, the published performance evaluation studies are done for optimized processes and/or where the challenges for implementation are only moderate.
New biocatalytic processes will face new challenges such as unfavorable thermodynamic equilibrium, presence of solvents and/or catalyzing non-natural reactions [20]. Moreover, new plant design might become a less common practice in the coming decades [89]. However, this does not necessarily mean that there is no space for novel design solutions. New synthetic processes (including biocatalytic processes) will often be retroffited into existing plants, either to increase capacity, improve EHS compliance, or improve process performance. Hence, it is necessary not to discard potentially good, but non-optimized solutions (as is often the case of the biocatalytic processes in the early development). Instead, by using adequate tools for each stage of the development, these non-optimized solutions can be matured to the point where they can actually present the best option. Therefore, during early stages, we suggest the use and clear reporting of process metrics and process related green chemistry metrics to assess and guide the development of both the biocatalyst and the process.
This paper suggests that the use of simpler metrics [process related green chemistry metrics (RME, E-factor, PMI, SI, WI) and process metrics (Yreaction, Ybiocatalyst, final [P] and STY)] during early development of biocatalytic processes is a suitable assessment tool to guide research and development, setting targets for process, protein and genetic engineers. However, in a later stage of development, only comprehensive assessments based on LCA methodology and/or cost estimation can provide an adequate and fair representation of the environmental and economic performance of the process.
6 Conclusions
Frequently, environmental and economic analysis is carried out at a rather late stage of process development. This paper argues that such an analysis should be carried out far earlier, with the intent of providing guidance for route selection and to set early development targets. However, since the assessment of the process has different goals at each stage of the development life cycle, the tools used at each stage will naturally be different. As a result, this paper suggests three sets of tools dependent upon the stage of process development where the assessment is to be made.
Despite the increasing concern of the chemical industry in promoting greener processes, the truth is that when comparing the environmental profile of two different synthetic routes, the environmental assessment tools work only as a tiebreaker, when both processes display similar economic profiles. Nevertheless, this is not necessarily a less green management decision, as often savings in the economics are translated into environmental savings. Moreover, in the future, regulatory directives will likely promote greener raw materials and routes, by discouraging the use of less safe routes and promoting cleaner ones. Regardless of the future regulatory framework the tools presented here provide an invaluable development tool for process chemists and engineers alike.
About the authors

Joana Lima-Ramos obtained her Master’s degree in Biochemical Engineering from the Technical University of Lisbon, Portugal, in 2007. After a period as a research assistant at the Université Catholique de Louvain, Belgium, she started her PhD studies at the Technical University of Denmark (DTU), which she concluded in 2013. She is currently a postdoctoral researcher at DTU, where her research focus is on biocatalytic processes.

Pär Tufvesson obtained his PhD from Lund University, Sweden. He has recently returned to an industrial position after five years at DTU. During his PhD and postdoctoral work at DTU, his research focus was on biocatalysis.

John M. Woodley is a Professor at the Department of Chemical and Biochemical Engineering at the Technical University of Denmark (DTU), where he has been working since 2007. His research interests include bioprocess and biocatalytic process technology. He is a Fellow of the Royal Academy of Engineering, London, UK.
Acknowledgments
JL-R acknowledges support from the BIOTRAINS Marie Curie ITN, financed by the European Union through the 7th Framework people Programme (Grant agreement no.: 238531). PT acknowledges support from AMBIOCAS, financed by the European Union through the 7th Framework people Programme (Grant agreement no.: 266025).
References
[1] Woodley JM, Breuer M, Mink D. Chem. Eng. Res. Design 2013, 91, 2029–2036.10.1016/j.cherd.2013.06.023Search in Google Scholar
[2] Burton SG. Trends Biotechnol. 2003, 21, 543–549.Search in Google Scholar
[3] Patel RN. Coord. Chem. Rev. 2008, 252, 659–701.Search in Google Scholar
[4] Schulze B, Wubbolts MG. Curr. Opin. Biotechnol. 1999, 10, 609–615.Search in Google Scholar
[5] Straathof AJJ, Panke S, Schmid A. Curr. Opin. Biotechnol. 2002, 13, 548–556.Search in Google Scholar
[6] Schmid A, Dordick JS, Hauer B, Kiener A, Wubbolts M, Witholt B. Nature 2001, 409, 258–268.10.1038/35051736Search in Google Scholar PubMed
[7] Anastas PT, Warner JC. Green Chemistry: Theory and Practice, Oxford University Press: New York, 2000.Search in Google Scholar
[8] Woodley JM. Comput.-Aided Chem. Eng. 2009, 27, 157–162.Search in Google Scholar
[9] Tufvesson P, Fu W, Jensen JS, Woodley JM. Food Bioprod. Process 2010, 88, 3–11.10.1016/j.fbp.2010.01.003Search in Google Scholar
[10] Rozzell JD. Bioorg. Med. Chem. 1999, 7, 2253–2261.Search in Google Scholar
[11] Tufvesson P, Lima-Ramos J, Nordblad M, Woodl JM. Org. Process Res. Dev. 2011, 15, 266–274.Search in Google Scholar
[12] Pollard DJ, Woodley JM. Trends Biotechnol. 2007, 25, 66–73.Search in Google Scholar
[13] Henderson RK, Jiménez-González C, Preston C, Constable DJ, Woodley JM. Ind. Biotechnol. 2008, 4, 180–192.Search in Google Scholar
[14] Kim S, Jiménez-González, C, Dale, BE. Int. J. Life Cycle Ass. 2009, 14, 392–400.Search in Google Scholar
[15] Gaber Y, Törnvall U, Orellana-Coca C, Ali Amin M, Hatti-Kaul, R. Green Chem. 2010, 12, 1817–1825.Search in Google Scholar
[16] Adlercreutz D, Tufvesson P, Karlsson A, Hatti-Kaul R. Ind. Biotechnol. 2010, 6, 204–211.Search in Google Scholar
[17] Mathys RG, Schmid A, Witholt B. Biotechnol. Bioeng. 1999, 64, 459–477.Search in Google Scholar
[18] Eissen M, Weiß M, Brinkmann T, Steinigeweg S. Chem. Eng. Technol. 2010, 33, 629–637.Search in Google Scholar
[19] Kuhn D, Abdul Kholiq M, Heinzle E, Bühler B, Schmid A. Green Chem. 2010, 12, 815–827.Search in Google Scholar
[20] Bornscheuer U, Huisman GW, Kazlauskas RJ, Lutz S, Moore JC, Robins K. Nature 2010, 485, 185–194.10.1038/nature11117Search in Google Scholar PubMed
[21] Sugiyama H, Fischer U, Hungerbühler K, Hirao M. AIChE J. 2008, 54, 1037–1053.Search in Google Scholar
[22] Anderson NG. Practical Process Research and Development: A Guide for Organic Chemists, Academic Press: Oxford, 2012.Search in Google Scholar
[23] Curzons AD, Constable DJ, Mortimer DN, Cunningham VL. Green Chem. 2001, 3, 1–6.Search in Google Scholar
[24] Sikdar SK. AIChE J. 2004, 49, 1928–1932.Search in Google Scholar
[25] Wilson J, Tyedmers P, Pelot R. Ecol. Ind. 2007, 7, 299–314.Search in Google Scholar
[26] Calvo-Flores FG. ChemSusChem 2009, 2, 905–919.10.1002/cssc.200900128Search in Google Scholar PubMed
[27] Trost BM. Science 1991, 254, 1471–1477.10.1126/science.1962206Search in Google Scholar PubMed
[28] Anastas PT, Lankey RL. Green Chem. 2000, 2, 289–295.Search in Google Scholar
[29] Sheldon RA. Pure Appl. Chem. 2000, 72, 1233–1246.Search in Google Scholar
[30] Corey E, Bakshi RK, Shibata S, Pin Chen C, Singh VK. J. Am. Chem. Soc.1987, 109, 7925–7926.Search in Google Scholar
[31] Goldberg K, Schroer K, Lütz S, Liese A. Appl. Microbiol. Biotechnol. 2007, 76, 249–255.Search in Google Scholar
[32] Weckbecker A, Hummel W. Biotechnol. Lett. 2004, 26, 1739–1744.Search in Google Scholar
[33] Turner NJ. Nat. Chem. Biol. 2009, 5, 567–573.Search in Google Scholar
[34] Tufvesson LM, Tufvesson P, Woodley JM, Börjesson P. Int. J. Life Cycle Ass. 2012, 18, 431–444.Search in Google Scholar
[35] Andraos J. Org. Process Res. Dev. 2005, 9, 149–163.Search in Google Scholar
[36] Sheldon RA. J. Mol. Catal. A: Chem. 1996, 107, 75–83.Search in Google Scholar
[37] Sheldon R. In Green Chemistry in the Pharmaceutical Industry, Wiley Online Library: Weinheim, 2010, pp 1–20.Search in Google Scholar
[38] Sheldon RA. Green Chem. 2007, 9, 1273–1283.Search in Google Scholar
[39] Sheldon RA. Chem. Soc. Rev. 2010, 41, 1437–1451.Search in Google Scholar
[40] Jiménez-González C, Woodley JM. Comput. Chem. Eng. 2010, 34, 1009–1017.Search in Google Scholar
[41] Clark JH, Macquarrie DJ. Handbook of Green Chemistry and Technology, John Wiley & Sons: Oxford, 2008.Search in Google Scholar
[42] Curzons AD, Jiménez-González C, Duncan AL, Constable DJC, Cunningham VL. Int. J. Life Cycle Ass. 2007, 12, 272–280.Search in Google Scholar
[43] Jiménez-González C, Ponder CS, Broxterman QB, Manley JB. Org. Process Res. Dev. 2011, 15, 912–917.Search in Google Scholar
[44] Jiménez-González C, Poechlauer P, Broxterman QB, Yang B-S, am Ende D, Baird J, Bertsch C, Hannah RE, Dell’Orco P, Noorman H, Yee S, Reintjens R, Wells A, Massonneau V, Manley, J. Org. Process Res. Dev. 2011, 15, 900–911.Search in Google Scholar
[45] Constable DJC, Jimenez-Gonzalez C, Henderson RK. Org. Process Res. Dev. 2007, 11, 133–137.Search in Google Scholar
[46] Henderson RK, Constable DJC, Jiménez-González C. In Green Chemistry in the Pharmaceutical Industry, Wiley Online Library: Weinheim, 2010, pp. 21–48.10.1002/9783527629688.ch2Search in Google Scholar
[47] Jiménez-González C, Curzons AD, Constable DJC, Cunningham, VL. Int. J. Life Cycle Ass. 2004, 9, 114–121.Search in Google Scholar
[48] Hellweg S, Fischer U, Scheringer M, Hungerbühler K. Green Chem. 2004, 6, 418–427.Search in Google Scholar
[49] Ravelli D, Dondi D, Fagnoni M, Albini A. Appl. Catal., B: Environ. 2010, 99, 442–447.Search in Google Scholar
[50] Jiménez-González C, Curzons AD, Constable DJC, Cunningham VL. Clean Technol. Environ. Policy 2004, 7, 42–50.10.1007/s10098-004-0245-zSearch in Google Scholar
[51] Curzons AD, Constable DC, Cunningham VL. Clean Prod. Processes 1999, 1, 82–90.10.1007/s100980050014Search in Google Scholar
[52] Gani R, Jiménez-González C, Constable DJC. Comput. Chem. Eng. 2005, 29, 1661–1676.Search in Google Scholar
[53] Gani R, Gómez PA, Folić M, Jiménez-González C, Constable DJ. Comput. Chem. Eng. 2008, 32, 2420–2444.Search in Google Scholar
[54] Straathof A. Biotechnol. Prog. 2003, 19, 755–762.Search in Google Scholar
[55] Halling PJ. Enzyme Microb. Technol. 1994, 16, 178–206.Search in Google Scholar
[56] DeSimone JM. Science 2002, 297, 799–803.10.1126/science.1069622Search in Google Scholar PubMed
[57] Constable DJ, Curzons AD, Freitas dos Santos LM, Geen GR, Hannah RE, Hayler JD, Kitteringham J, McGuire MA, Richardson JE, Smith P, Lee Webb R, Yu M. Green Chem.2001, 3, 7–9.Search in Google Scholar
[58] Sheldon RA. CHEMTECH 1994, 24, 38–47.10.1108/eb040526Search in Google Scholar
[59] Hudlicky T, Frey DA, Koroniak L, Claeboe CD, Brammer Jr, LE. Green Chem. 1999, 1, 57–59.Search in Google Scholar
[60] Christensen CH, Rass-Hansen J, Marsden CC, Taarning E, Egeblad K. ChemSusChem 2008, 1, 283–289.10.1002/cssc.200700168Search in Google Scholar PubMed
[61] Voss B, Andersen SI, Taarning E, Christensen CH. ChemSusChem 2009, 2, 1152–1162.10.1002/cssc.200900215Search in Google Scholar PubMed
[62] Wenzel H, Hauschild MZ, Alting L. Environmental Assessment of Products: Volume 1: Methodology, Tools and Case Studies in Product Development. Vol. 1. Springer: Massachusetts, 2000.Search in Google Scholar
[63] Tufvesson LM, Börjesson P. Int. J. Life Cycle Ass. 2008, 13, 328–338.Search in Google Scholar
[64] Tufvesson P, Lima-Ramos J, Al Haque N, Gernaey KV, Woodley JM. Org. Process Res. Dev. 2013, 17, 1233–1238.Search in Google Scholar
[65] Jiménez-González C, Ollech C, Pyrz W, Hughes D, Broxterman QB, Bhathela N. Org. Process Res. Dev. 2013, 17, 239–246.Search in Google Scholar
[66] Douglas JM. AIChE J. 1985, 31, 353–362.Search in Google Scholar
[67] Liu G, Cogan DA, Ellman JA. J. Am. Chem. Soc. 1997, 119, 9913–9914.Search in Google Scholar
[68] Truppo MD, David Rozzell J, Turner NJ. Org. Process Res. Dev. 2010, 14, 234–237.Search in Google Scholar
[69] Nielsen PH, Nielsen PH, Oxenbøll KM, Wenzel H. Int. J. Life Cycle Ass. 2007, 12, 432–438.Search in Google Scholar
[70] Quaglia A, Sarup B, Sin G, Gani R. Computers Chem. Eng. 2010, 38, 213–223.Search in Google Scholar
[71] Tufvesson P, Ekman A, Sardari RR, Engdahl K, Tufvesson L. Bioresour. Technol. 2013, 149, 556–564.Search in Google Scholar
[72] Ouattara A, Pibouleau L, Azzaro-Pantel C, Domenech S, Baudet P, Yao B. Computers Chem. Eng. 2011, 36, 174–188.Search in Google Scholar
[73] Andersson K. Int. J. Life Cycle Ass. 2000, 5, 239–248.Search in Google Scholar
[74] Hischier R, Baudin I. Int. J. Life Cycle Ass. 2010, 15, 428–438.Search in Google Scholar
[75] ISO, I. 14044: Environmental Management – Life Cycle Assessment – Requirements and Guidelines. International Organization for Standardization, 2006.Search in Google Scholar
[76] Börjesson P, Tufvesson LM. J. Clean Prod. 2011, 19, 108–120.Search in Google Scholar
[77] Baumann H, Tillman AM. The Hitch Hiker’s Guide to LCA. An Orientation in Life Cycle Assessment Methodology and Application. External organization, 2004.Search in Google Scholar
[78] Saling P, Kicherer A, Dittrich-Krämer B, Wittlinger R, Zombik W, Schmidt I, Schrott W, Schmidt S. Int. J. Life Cycle Ass. 2002, 7, 203–218.Search in Google Scholar
[79] Gonzalez MA, Smith RL. Environ. Prog. 2003, 22, 269–276.Search in Google Scholar
[80] Young DM, Cabezas H. Comput. Chem. Eng. 1999, 23, 1477–1491.Search in Google Scholar
[81] Eissen M, Metzger J. EATOS—Environmental Assessment Tool for Organic Syntheses, 2008.Search in Google Scholar
[82] Van Aken K, Strekowski L, Patiny L. Beilstein J. Org. Chem. 2006, 2, 3.Search in Google Scholar
[83] Suslick, KS. Kirk-Othmerencyclopedia of Chemical Technology. John Wiley and Sons, Inc.: New York, 1998.Search in Google Scholar
[84] Timmerhaus KD, Peters MS, West RE. Plant Design and Economics for Chemical Engineers. McGraw-Hill: New York, 1991.Search in Google Scholar
[85] Perry RH, Green DW, Maloney JO. In Perry’s Chemical Engineer’s Handbook. McGraw-Hill Book: New York, 1984.Search in Google Scholar
[86] Doxsee K, Hutchison J. Tools, and Laboratory Experiments, Brooks/Cole Pub Co.: 2004.Search in Google Scholar
[87] Parmar J, Lees F. Reliab. Eng. 1987, 17, 277–302.Search in Google Scholar
[88] Dunjó J, Fthenakis V, Vílchez JA, Arnaldos J. J. Hazard. Mater. 1020, 173, 19–32.Search in Google Scholar
[89] Lieberman NP. Process Engineering for a Small Planet: How to Reuse, Re-Purpose, and Retrofit Existing Process Equipment, John Wiley and Sons: 2011.10.1002/9780470637050Search in Google Scholar
©2014 by Walter de Gruyter Berlin/Boston
Articles in the same Issue
- Frontmatter
- In this issue
- Editorial
- Megatrends – megascience? Part 2
- Feature
- Novel sustainable industrial processes: from idea to commercial scale implementation
- Original articles
- Application of environmental and economic metrics to guide the development of biocatalytic processes
- Synthesis of nanostructured MgO powders with photoluminescence by plasma-intensified pyrohydrolysis process of bischofite from brine
- A solvent free approach for Knoevenagel condensation: facile synthesis of 3-cyano and 3-carbethoxycoumarins
- Green synthesis and characterisations of antibacterial silver-polyvinyl alcohol nanocomposite films for wound dressing
- Company profiles
- AVA Biochem: commercialising renewable platform chemical 5-HMF
- Invenios: micro process technology – chemical process technology of tomorrow
- Conference announcements
- International Conference on Green Chemistry and Sustainable Engineering International (Barcelona, Spain, July 29–31, 2014)
- 7th Annual European Forum for Industrial Biotechnology and the Biobased Economy (Reims, France, September 30–October 2, 2014)
- 19th International Symposium on Homogeneous Catalysis (ISHC-XIX; Ottawa, ON, Canada, July 6–11, 2014)
- 248th American Chemical Society National Meeting and Exposition: Chemistry and Global Stewardship (San Francisco, CA, USA, August 10–14, 2014)
- Conferences 2014–2017
- Book reviews
- Green materials for sustainable water remediation and treatment
- Engineering catalysis