Modelling of carrying capacity in National Park - Fruška Gora (Serbia) case study
-
Aleksandra Vujko
 ,
Jovan Plavša
,
Jovan Plavša

Abstract
Negative effects of tourism development in a destination are usually the consequence of the high concentration of tourists, accommodation facilities and the activities that are practiced in a relatively restricted area. One of the most important measures to protect the areas is to calculate the maximum number of tourists that can simultaneously reside in a region, i.e. the determination of the carrying capacity. This paper outlines a method for determining carrying capacity based on zoning of environmental resources and zoning within a region. The paper argues for a return to the idea of identifying maximum appropriate number of users. The main hypothesis of the paper is based on the statement that the development of tourism in Fruška Gora (Mountain) National Park in Northern Serbia must be in accordance with the basic principles of sustainability, including the determination of carrying capacity. The main research goal was to show the opinion of local residents about the uncontrolled development of tourism, and to determine the carrying capacity in four sports and recreational zones of the mountain. The carrying capacity of the area is calculated by Lavery and Stanev formulas.
1 Introduction
When it comes to protected areas, especially those natural, such as national parks, as a distinct and decisive determinant of sustainable development, there is a so-called carrying capacity. It is a measure of the resistance of a single locality and its power to take certain influences from the environment. In many research studies, human impact was indicated as the main factor of pressure and influence on the biophysical characteristics of the protected areas [1–3]. Thus, to save region and its original resources that attract visitors, tourism should not be over-developed. It has to be self-limiting in its development ambitions, to find the upper limit of the development in a given spatial coverage (region, area and place); otherwise it can lead to self-destruction [4]. Fruška Gora Mountain was declared as a national park in 1960, in order to provide permanent protection and enhancement of its natural beauty and values. The area of active protection covers 25,393.00 ha [5, 6].
The current condition and the size of contractive zone and sports and recreational amenities of Fruška Gora National Park are on the level of national tourism values, with a tendency to spread internationally. In this respect, there would be an attempt to connect the following into a single unit: tourist attractions, sports and recreational tourism in the national park, zoning, system of trails for hiking, mountain biking and horseback riding, various sports and recreational activities. In the area of Fruška Gora National Park, four characteristic zones can be identified with about 600 km of trails intended primarily for cycling, hiking and horseback riding. On some paths there would also be certain points for enjoying many sports and recreational activities, such as flying and water sports, as well as various games. The observed mountain area (which includes the National Park) covers the area of approximately 50,800.00 ha. In this regard, there is a need to determine the quantitative units expressed in the number of persons per unit of time, which may reside within such territory, or on each individual path [7]. As numbers of visitors to national parks have increased over recent decades [8–10], many management agencies have limited numbers through various mechanisms. This is a common, but unpopular tool to reduce impacts. If agencies banned powered vehicles, restricted camping to designated sites and limited the campsites available, that would restrict the total number of visitors. Broader systems limit the total number of people in the park through a road entrance turnstile system. More sophisticated measures use booking systems, control numbers by charging high entrance or permit fees, divide parks into zones, allow only one group per zone at any time. All these approaches need mechanisms to determine what the threshold visitor number is, and how the carrying capacity concept originated [11]. Carrying capacities in nature are not fixed, static, or simple relations. They are contingent on technology, preferences and the structure of production and consumption. They are also contingent on the ever-changing state of interactions between the physical and biotic environment [12, 13]. The study aims to analyze sport and recreational tourism landscape components (carrying capacity of all four zones in Fruška Gora National Park), on the basis of the opinion of the local population. The main subject of this research is the examination of how human activities do affect natural surroundings in a vulnerable protected area, such as the observed national park. The obtained data were analyzed by appropriate statistical methods, which were descriptive and comparative in nature, enabling the explication of the research results and the performance of certain conclusions. The analysis is aimed at checking whether there is a connection among groups of participants and the probability of connection. The attitudes and opinion of local residents helped in understanding the potential negative aspects of uncontrolled development of tourism in the National Park, while Stanev and Lavery formulas helped determining the maximum potential of sports and recreational tourists in certain areas along the projected path.
2 Literature review
The negative impact of tourism on national parks is a global problem. Tourism generates air and noise pollution, aesthetic degradation, littering, trampling, etc. According to Finnessey [14], there are three main sources of impact left on national parks by tourists: depletion of natural resources, pollution and physical impacts. Visitor impacts, caused by sport and recreational tourism activities (walking, hiking, backpacking, rock climbing, horseback riding, camping, vehicle use and biking) have relevant negative impacts on national parks [15]. Vegetation is being trampled, soil compacted and ecosystems destroyed, because of the growing number of tourists coming to these areas. Food supplies and other waste materials are brought into parks, and often, much of it is left behind. Trampling is caused by tourists using the same trail over and over again, without a resting period and can cause damage that can eventually lead to the loss of biodiversity [16, 17]. While significant progress has been made in evaluating carrying capacity, some of the methods lack analytical rigor [1]. There are several different conceptual bases for carrying capacity. One is social: the visitor density at which the number of meetings, sightseeing, or other unplanned interactions among individuals or groups begins to reduce their pleasant experience. Another is economic: visitors must pay entrance fees or travel costs, and the amount paid decreases with crowding. Economic carrying capacity is the number of visitors that maximizes real or notional net revenue, i.e. number of visitors x per capita payment - less infrastructure and support costs. The third is ecological: the number of visitors, which produces no detectable, or at least no irreversible, ecological change to the ecosystems in the area concerned. Due to recreational succession, social carrying capacity increases over time, as the type of visitor changes. For those craving solitude and wilderness, social carrying capacity may be only one person per 100 km2 in areas traversed by foot, or orders of magnitude lower in areas traversed by bycicle or vehicle. For those craving nightlife and social interactions, hundreds of thousands of people per km2 may be fine. Thus, social carrying capacity is meaningful only under a management regime, which prevents recreational succession and filters the types of visitors. Similar considerations are applied to economic carrying capacity. If allowable activities permitted in an area are predetermined, and visitors are charged entrance fees as for zoos or private wildlife parks, then the economic carrying capacity is the number of visitors, which maximizes revenue [11, 18]. Because of this and because of recreational succession, setting visitor numbers to maximize revenues will produce high crowding and ecological damage. Ecological carrying capacity also suffers major limitations, unless the concept is much more precisely defined. All visitors create some impacts, so if ecological carrying capacity is defined as the threshold of zero impact, then it will always be zero. Of course, an impact is only known to be nonzero if it is detectable. But detection thresholds can be highly variable, depending on the parameter measured, detection technologies, patterns of natural variation, sampling design and the degree of sampling effort [11, 18].
The World Tourism Organization (UNWTO) defines three levels at which capacity can be assessed. Ecological capacity is the maximum use of region, while at the same time there is no environmental degradation; psychological capacity is the maximum utilization of region from the standpoint of the number of tourists, their activities and facilities built, and without causing any decline in the quality of tourism experiences; socio-cultural capacity is the maximum of possible development of tourism, including tourists, their activities, built capacities and infrastructure that will not disrupt the way of life of local people, their culture and traditions [19]. The concept of carrying capacity is widely discounted, in part because it is fluid and virtually unquantifiable. Past discoveries and technological breakthroughs have, many times, raised carrying capacity, and much western science encourages the belief that technology’s potential is unlimited. Technological optimists typically reject scientific warnings that no substitutes exist for topsoil, fresh water, clean air, and the “free services” of many species, or that technology and its deployment to replace existing uses of petrochemical energy will take 20 years to bring on line, minimum [20]. In recent years, there has been some discussion concerning the carrying capacity of the earth for humans, and the ultimate limit to global carrying capacity for economic development. There are numerous papers that discuss qualitatively the relationships of environment to carrying capacity [21–31], and a few quantitative studies [32, 33]. The concept of carrying capacity relates to the concept of sustainable development [33, 34]. Sustainable development requires that population and consumption remain within the limits of carrying capacity, while preventing a decline in the carrying capacity of an area requires that the productive systems implanted through development be sustainable [27]. Carrying capacity can be measured either at the level of a tourist destination as a whole, with all its associated contents or at the level of individual, specific services and facilities. In both cases, capacity is characterized by economic, physical and social attributes that can be measured. Each type of capacity may significantly vary from one destination to another, depending on the natural-ecological characteristics of a given area, the manner of its use, and developmental goals to be achieved. Each capacity type is characterized by a tolerance limit for a destination as a whole or for individual objects and facilities [35]. Given what has been so far observed, it can be said that capacity levels and the consequent tolerance threshold mainly depend on two groups of factors: characteristics of tourists and characteristics of a tourist destination and its population[36].
3 Research methodology
3.1 Study area
Fruška Gora National Park is located between 45°00’ and 45°15’ north latitude and between 16°37’ and 18°01’ east longitude. It is a mountain range in the northern part of Srem District (South-western Vojvodina Province, Northern Serbia), i.e. south-eastern periphery of the vast Pannonian Plain. Since this part of Vojvodina is situated between the lower Danube and the Sava rivers, this means that Fruška Gora National Park is situated in Srem, mostly in Serbia, with only a small part, in the far west, situated in Croatia [37]. This mountain range is an interesting area for development of sport and recreational tourism in Northern Serbia. In its west – east direction it has the length of about 80 km. This low island type mountain range, with the peaks Crveni čot (539 m), Orlovac (512 m), and Iriški venac (490 m), represents a mountain range with a special benefit for the development of sport and recreational tourism [38–41]. However, because of its dominant appearance in relation to the surrounding flat terrain, it seems more massive than it actually is. The chain of Fruška Gora National Park is broken and the mountain range is basically composed of three parts: the area of Telek in the west, which is barely noticeable, Slankamen in the east and the central part of the mountain range (Fig. 1). The last one, central part extends from Đipša in the west (Fig. 2) to Banstol in the east, forming a ridge about 40 km long, and 440–460 m high. This is the part that is asymmetrical and dissected or broken with numerous valleys, with the developed source crest. The central part of the Mountain has the shape of a long anticline, east – west, with a fragmented appearance of the wings. Anticline is symmetrically preserved, except in the far eastern part, where it sinks beneath the northern flank of the Danube fault [42]. The Mountain base is surrounded by two loess plateau areas, 130–150 m and 110–120 m high. The Mountain is partly covered with thick or thin layers of loess and loess deposits that ease severity and sudden transitions that are characteristics of older and more compact rocks, which is certainly in favor of sport and recreational tourism as a viable and accessible mountain in almost all its parts [40–42].

The eastern and central parts of the Fruška Gora National Park. (Source: base Geokarta - finishing A. Vujko)
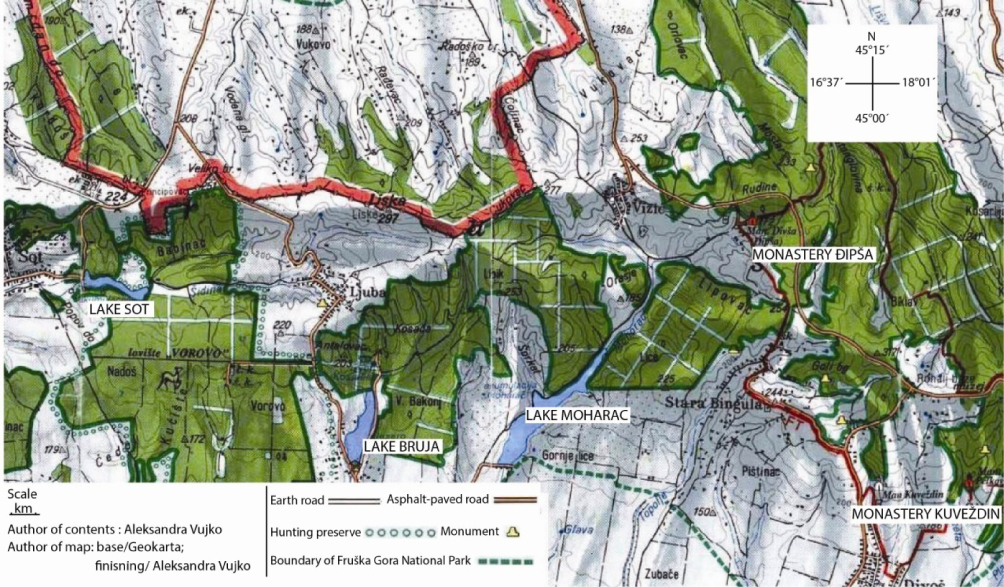
The western part of the Fruška Gora National Park. (Source: base Geokarta - finishing A. Vujko)
3.2 Sources of data
The first part of this study was the field research and data collection through direct questionnaire examination that was conducted in the area of Fruška Gora National Park. We examined the local population in seven settlements surrounding Fruška Gora National Park: Petrovaradin, Sremski Karlovci, Čortanovci, Ledinci, Sremska Kamenica, Erdevik and Banstol. The survey was conducted between May and August 2012, and the questionnaire consisted of questions grouped into independent and dependent variables (view supplementary data). The second part included a specific calculation of the carrying capacity based on formulas set by Stanev and Lavery.
3.3 Research hypothesis and procedure
The independent variable is a group of questions related to gender and age structure. Regarding the dependent variable, it is concerned with the specimens out of the possible negative impact that tourism can have on the observed region. The main hypothesis H, that the development of sports and recreational tourism in the Fruška Gora National Park must be developed in accordance with the fundamental principles of sustainability, which also includes the determination of carrying capacity, serves as the base structure of this paper. Within this group of variables, the lower-level hypothesis has been set: h1 – local population believes that there is a need for limiting the number of sports and recreational tourists in National Park; h2 – measurable effects limit the number of sports and recreational tourists; and h3 – within the individual zones, it is possible to calculate different ratios depending on the specific features of the site through/beside which the projected paths pass.
The first question, the respondents were asked, was the question on whether sports and recreational tourism can have negative impacts on the development of a destination. It is interesting that all of the analyzed 249 questionnaires had a positive response, which actually encouraged further research. This paper presents the responses regarding participants’ opinions about the possible negative aspects of uncontrolled development of sports and recreational tourism in Fruška Gora National Park, about their opinions on the need to limit the number of tourists visiting the National Park and the potential benefits that such actions may bring. It was concluded that the determination of the carrying capacity of sports and recreational tourists, within certain zones, appears to be a sustainable and desirable activity. Thus, the carrying capacity is one of the most important issues in the sustainable tourism development planning in Fruška Gora National Park. It is a starting point for planning and conducting tourist activities in the area. According to Stanev [43] and Čomić and Pjevač [44], one of the most important ways to protect the area of excessive tourism is to determine the spatial limits and standards. At the same time, the most important criterion for determining the optimal capacity limit is the observed tourist area. The term optimal capacity indicates the maximum number of tourists that can be accepted in the peak season by making full use of sports and recreational opportunities, but no damaging the area and disruption of normal life in the region or place. Capacity is determined as a function of different factors: conservation of natural resources and ecological balance environment, comfort, health and safety of touristswhile ensuring proper equipment to satisfy both the mental and physical needs, psychological aspects and more.
As Lavery [45] and Stanev [43] state, real capacity of an area for a short vacation, which includes a national park determines the maximum number of sports and recreational tourists who can stay at the same time in one day without compromising on the natural environment sustainability and normal life rhythm of the region. According to these authors, determining the capacity of a given area for sports and recreational tourist visits can be made according to the following formula:
where K denotes the maximum capacity of the area (number of visitors), S is the total surface area (m2), k represents correction coefficient whose value ranges from 0.5 to 1.0, depending on the characteristics and sensitivity of a given region (relief, engineering-geological, hydrological and other elements of the landscape), and N denotes the normative area for any visitor (m2/human). In terms of the National Park, the normative area is 1.200 m2 per human, for the entire area; 16 m2 per human in forest areas, 32 m2 per human per areas at about 300 m above sea level and 53 m2 per human for important historic place [45].
4 Results
Out of the 300 questionnaires, 249 were analyzed, and the respondents in this survey were residents of the mountain in the following structure: Petrovaradin (41.8%), Sremski Karlovci (12.4%), Ledinci (12%), Čortanovci (10.4%), Banstol (6.8%) and Erdevik (6.8%). Regarding the age structure of the respondents, the survey included 61.4% males and 38.6% females.
The survey results, presented in the Table 1, showed the respondents’ opinion in relation to place of their residence. To the question: “What, in your opinion, were the negative aspects of the uncontrolled development of sports and recreational tourism in the National Park¿‘, respondents in the highest percentage (40.9%) responded that it would probably result in the destruction of many habitats and the environment in the area of the National Park. Moreover, smaller percentage was recorded for the answer that the uncontrolled development of sports and recreational tourism has contributed to the development of vandalism, (22.7%), and (19.0%) that it would contribute to increased housing costs.
Negative indicators of the uncontrolled development of tourism in the Fruška Gora National Park according to residents.
| What, in your opinion, were the negative aspects of the uncontrolled development of sports and recreational tourism in the National Park? | Would increase the cost of living in places of residence in the park. | Would result in the destruction of many habitats and the environment. | Contribute to the development of vandalism. | The forest would be swamped and destroyed. | I do not know | Total | ||
|---|---|---|---|---|---|---|---|---|
| Petrovaradin | Count | 19 | 51 | 16 | 16 | 2 | 104 | |
| % of Total | 7.7% | 20.6% | 6.5% | 6.5% | 0.8% | 42.1% | ||
| Banstol | Count | 1 | 9 | 6 | 1 | 0 | 17 | |
| % of Total | 0.4% | 3.6% | 2.4% | 0.4% | 0% | 6.9% | ||
| Ledinci | Count | 1 | 2 | 18 | 9 | 0 | 30 | |
| % of Total | 0.4% | 0.8% | 7.3% | 3.6% | 0% | 12.1% | ||
| Sremska Kamenica | Count | 3 | 2 | 9 | 10 | 0 | 24 | |
| Living place | % of Total | 1.2% | 0.8% | 3.6% | 4.0% | 0% | 9.7% | |
| of participants? | Sremski Karlovci | Count | 12 | 11 | 3 | 3 | 2 | 31 |
| % of Total | 4.9% | 4.5% | 1.2% | 1.2% | 0.8% | 12.6% | ||
| Čortanovci | Count | 7 | 16 | 2 | 0 | 0 | 25 | |
| % of Total | 2.8% | 6.5% | 0.8% | 0% | 0% | 10.1% | ||
| Erdevik | Count | 4 | 10 | 2 | 0 | 0 | 16 | |
| % of Total | 1.6% | 4.0% | 0.8% | 0% | 0% | 6.5% | ||
| Total | Count | 47 | 101 | 56 | 39 | 4 | 247 | |
| % of Total | 19.0% | 40.9% | 22.7% | 15.8% | 1.6% | 100% | ||
Results from the Table 2 showed ecological and sustainable responsibility of the locals. The responses of male and female respondents directly pointed to the need to determine the carrying capacity of the National Park. Given that the majority of respondents of both genders responded positively to the question whether, in their opinion, it is necessary to limit the number of sports and recreational tourists to the National Park. In this regard, the lower level hypothesis h1 is actually confirmed that the local population believes that there is a need for limiting the number of sports and recreational tourists in National Park.
The need of limitation the sports and recreational tourists on the trails during the day in the Fruška Gora National Park.
| Would it, in your opinion, limit the number of sports and recreational tourists/ paths / day in the National Park? | Yes | I do not know | Total | ||
|---|---|---|---|---|---|
| Petrovaradin | Count | 102 | 2 | 104 | |
| % of Total | 41.0% | 0.8% | 41.8% | ||
| Banstol | Count | 17 | 0 | 17 | |
| % of Total | 6.8% | 0% | 6.8% | ||
| Ledinci | Count | 30 | 0 | 30 | |
| % of Total | 12.0% | 0% | 12.0% | ||
| Sremska Kamenica | Count | 24 | 0 | 24 | |
| Living place of participants? | % of Total | 9.6% | 0% | 9.6% | |
| Sremski Karlovci | Count | 29 | 2 | 31 | |
| % of Total | 11.6% | 0.8% | 12.4% | ||
| Čortanovci | Count | 26 | 0 | 26 | |
| % of Total | 10.4% | 0% | 10.4% | ||
| Erdevik | Count | 17 | 0 | 17 | |
| % of Total | 6.8% | 0% | 6.8% | ||
| Total | Count | 245 | 4 | 249 | |
| % of Total | 98.4% | 1.6% | 100% | ||
The next question was to list the advantages of limiting the sports and recreational tourists to the National Park (Table 3). It can be seen that the respondents have a high degree of knowledge on environmental and sustainable development aspects of tourism. In terms of percentages, the most common response among respondents (49.4%) was that in this way it is possible to prevent pollution or at least to minimize it. Other responses were: it is easier to provide tourist service and accommodation (16.1%), it is easier to control tourists’ movements (20.9%), and controlled number of sports and recreational tourists improves the image of the mountain, as it keeps a sense of peace and tranquility typical for mountainous regions (12.4%). According to this result, the lower level hypothesis h2 is confirmed that there are measurable effects, which limit the number of sports and recreational tourists in Fruška Gora National Park. From the above Tables 1, 2 and 3, it can be seen that participants have a highly developed awareness of the negative impact of uncontrolled development of sports and recreational tourism. This result indicates the need for determining the carrying capacity, which proves the initial hypothesis. By proving the main hypothesis, we have made the first steps to determine the carrying capacity of the National Park. In order to achieve this, the region needed to be divided into zones. Redistribution of multifunctional tourism structure of the National Park can be achieved by means of typical four zones [7].
The advantages of limiting the number of sports and recreational tourists on the trails in the National Park
| What are, in your opinion, the advantages of limiting the number of sports and recreational tourists on the trails? | Tourists are easier to accommodate and serve. | It is easier to control their movement. | The possibility of environmental pollution is minimized. | The identity of the National Park remains unchanged (peace and quiet that nature provides). | I do not know | Total | ||
|---|---|---|---|---|---|---|---|---|
| Petrovaradin | Count | 16 | 15 | 56 | 16 | 1 | 104 | |
| % of Total | 6.4% | 6.0% | 22.5% | 6.4% | 0.4% | 41.8% | ||
| Banstol | Count | 1 | 5 | 11 | 0 | 0 | 17 | |
| % of Total | 0.4% | 2.0% | 4.4% | 0% | 0% | 6.8% | ||
| Ledinci | Count | 8 | 11 | 11 | 0 | 0 | 30 | |
| % of Total | 3.2% | 4.4% | 4.4% | 0% | 0% | 12.0% | ||
| Sremska Kamenica | Count | 4 | 7 | 8 | 5 | 0 | 24 | |
| Living place | % of Total | 1.6% | 2.8% | 3.2% | 2.0% | 0% | 9.6% | |
| of participants? | Sremski Karlovci | Count | 0 | 3 | 16 | 10 | 2 | 31 |
| % of Total | 0% | 1.2% | 6.4% | 4.0% | 8% | 12.4% | ||
| Čortanovci | Count | 5 | 6 | 15 | 0 | 0 | 26 | |
| % of Total | 2.0% | 2.4% | 6.0% | 0% | 0% | 10.4% | ||
| Erdevik | Count | 6 | 5 | 6 | 0 | 0 | 17 | |
| % of Total | 2.4% | 2.0% | 2.4% | 0% | 0% | 6.8% | ||
| Total | Count | 40 | 52 | 123 | 31 | 3 | 249 | |
| % of Total | 16.1% | 20.9% | 49.4% | 12.4% | 1.2% | 100% | ||
The first Fruška Gora National Park zone
The total length of the paths within the Fruška Gora National Park first zone would be about 170 km divided into three characteristic sub-zones. The height profile of the Fruška Gora National Park first zone is very uniform and almost all three sub-zones are at about 300 m above sea level. Within this zone, there are some of the sights most frequently visited in the National Park, such as eastern orthodox monasteries: Krušedol (16th century), Staro Hopovo (15th century) and Novo Hopovo (16th century). Also, there is Petrovaradin fortress, built between 1692 and 1780 (area of 112 ha), historical sites of Sremski Karlovci and Irig, known for the wine events, and some of the most popular Fruška Gora National Park picnic sites, such as Iriški Venac, Zmajevac and Čortanovci.
The second Fruška Gora National Park zone
The total length of paths within the Fruška Gora National Park second zone would be about 80 km, divided into two characteristic sub-zones. The height profile of the second zone has large fluctuations and the sub-zones that are located within this zone are moving at an interval from 80 m to 539 m above sea level. This zone is located in the central, highest part of Fruška Gora National Park, but goes down to some historical places like Vrdnik, known for its thermal waters and spa and tower of Vrdnik, first mentioned in 1315. Within this zone, there are monasteries Rakovac and Jazak, both from the 15th century. Given the fact that this zone is mainly located in the central, highest part of the mountain, this area is covered with woods and here are some of the most popular picnic sites, such as Popovica, Glavica, Osovlje and Crveni čot.
The third Fruška Gora National Park zone
The total length of paths within the Fruška Gora National Park third zone would be about 130 km divided into two characteristic sub-zones. The height profile of the Fruška Gora National Park third zone is generally uniform and both sub-zones are at about 200 m above sea level. Within this zone there are monasteries Đipša (15th century), Kuveždin (16th century), Petkovica (16th century) and Šišatovac (16th century). Within this zone there is a protected forest reserve under the first level of protection, such as site of Paprat Do, as well as picnic sites Testera and Andrevlje.
The fourth Fruška Gora National Park zone
The total length of paths within the Fruška Gora National Park fourth zone would be about 40 km consisting of only one characteristic sub-zone. The height profile of the Fruška Gora National Park fourth zone is generally uniform and the sub-zone is about 150 m above sea level. Within this zone there is the western most monastery Privina glava (12th century) and three biggest artificial lakes of Fruška Gora National Park: Sot, Bruje and Moharač Lake.
The total area of the individual zones is calculated according to field research and the calculation is done by using the topographic maps [7]. Area of the first zone is about 20.312,00 ha (203.120,000 m2); area of the second zone is about 10.156,00 ha (101.560,000 m2); area of the third zone is about 15.235,00 ha (152.350,000 m2); and area of the fourth zone is about 5.078,00 ha (50.780,000 m2). The application of the appropriate formula set by Stanev and Lavery resulted in the data presented in the Table 4. The numbers 85.000, 42.000, 63.000 and 21.000 imply general numbers of people that could be simultaneously accommodated in the region, without derogating from a specific area, such as forest areas, areas at about 300 m above sea level or cultural and historical places in the mountains. Bearing in mind that the area of the mountain can allocate such areas, the maximum number of visitors was calculated for these areas. This is the confirmation of the low-level hypothesis h3 – within the individual zones, it is possible to calculate different ratios depending on the specificities of the site through/besides, which the projected path passes. In order to be permanently protected, the regimes of 1st, 2nd and 3rd degree of protection were introduced on its territory and any changes to the area became prohibited. However, permitted activities are more than favourable for routing all of these paths. Among other issues, the following is permitted: collecting wild fungi, plants and animals in accordance with the legal provisions about controlling the collection, use and trade of wild plant and animal species, the establishment of monitoring, protection, preservation and promotion of protected plant and animal species and their communities, informative presentation, promotion and education in natural values, the controlled use of soft unclassified roads with the use of protective measures by erosion, construction and motion controlled on local roads, controlled movement of visitors (hikers, mountain climbers, etc.), controlled rerouting and construction of hiking trails and other. All these mean that in these areas rerouting paths is a feasible and desirable activity, which implies sport and recreational tourism as a sustainable form of tourism in Fruška Gora National Park.
Calculation of carrying capacity for the Fruška Gora National Park by Stanev and Lavery and modified by authors.
| Zone | Localities | Carrying capacity |
|---|---|---|
| Petrovaradin – Tekije – Vezirac – Sremski Karlovci – | Forest = 6.350 people | |
| Stražilovo – Banstol – Velika Remeta – Krušedol - | Regions at about 300 m above sea level = 3.175 people | |
| I Zone | Kružedolski Prnjavor – Grgeteg – Međeš Lake – Šatrinci – | Historic places = 1.915 people |
| Neradin – Perkov Salaš – Irig – Hopovo – Iriški Venac – | Other areas = 73.560 people | |
| Čortanovci – Beška – Krčedin – Stari Slankamen. | Total: 85.000 people | |
| Vrdnik – Zmajevac –Rakovac Monastery – Stari Rakovac – | Forest = 3.175 people | |
| Novi Rakovac – Dumbovo – Novi Ledinci – Stari Ledinci | Regions at about 300 m above sea level = 1.586 people | |
| II Zone | –LedinaČko Lake – Sremska Kamenica – Popovica – Glavica | Historic places = 958 people |
| – Jazak – Mala Remeta – Crveni Čot – Bešenovski prnjavor – | Other areas = 36.281 people | |
| Osovlje – Dobri Waterfall –Beočin Monastery – Beočin. | Total: 42.000 people | |
| Beočin –Beočin Monastery – Šakotinac – Čerević -Testera – | Forest = 4.760 people | |
| Andrevlje – Banoštor – Koruška – Sviloški vodopad – Susek | Regions at about 300 m above sea level = 2.380 people | |
| III Zone | – Neštin – Vizić – Đipsa – Divoš – Kuveždin Monastery – | Historic places = 1.437 people |
| Petkovica Monastery – Šišatovac Monastery – Ležimir – | Other areas = 54.423 people | |
| Grgurevci – Letenka. | Total: 63.000 people | |
| Forest = 1.586 people | ||
| Erdevik – Ljuba –Bruja Lake –MoharaČ Lake – Vorovo –Sot | Regions at about 300 m above sea level = 793 people | |
| IV Zone | Lake – Sot – Bikića Do – Privina Glava Monastery – | Historic places = 479 people |
| Berkasovo – LipovaČa – Šid – Gibarac – BaČinci – Kukujevci. | Other areas = 18.142 people | |
| Total: 21.000 people | ||
5 Discussion
Our findings have important implications for the management and can inform and potentially improve local policy and long term planning and decision-making of Fruška Gora National Park. By better understanding of local residents and visitors values, protected areas managers can plan which facilities should be provided within specific protected areas – or in some cases may require closer monitoring and management. These include infrastructure, education, sport and recreational tourism facilities, as well as having a better understanding of the type of activities that may be permitted and the need to potentially designate or zone some areas for more intensive activities. With regard to carrying capacity, it was necessary to introduce into consideration various factors that may affect its calculation. One of these factors is the vulnerability of ecosystems caused by human influence. It should be borne in mind that some ecosystems and landscapes that are found within the area of the first level of protection in Fruška Gora National Park (e.g. the localities of important forest ecosystems, such as Papratski do, Stražilovo, Đerova Kosa, Janok, Radovanac, etc.) are extremely sensitive and even the slightest inattention can cause radical consequences. In particular, the analysis should take the mosaic of ecosystems and their different levels of sensitivity. Then, there are current and projected levels of tourism development and their compliance with associated infrastructure. It is the threshold of material tourist base that can “hold” a certain number of visitors [46]. In areas of national parks, such as Fruška Gora, the number of visitors, who are staying in the National Park is important. Calculation of the number can be a serious problem because there is currently no mechanism to determine the number of visitors, which is one of the initial components for calculating the carrying capacity. Another important factor is local economy and its relationship to tourism in the National Park. It is necessary to consider the dependence of tourism on local economy in order to coordinate tourism development with the carrying capacity level. Thus, determination of carrying capacity depends on the level of tourism management development in protected natural resources [47]. The current state of tourism development in which the carrying capacities of national parks are not planned and calculated, best implies the necessity of this factor for the creation of a “support tool of sustainable development” [48]. Therefore, for Fruška Gora National Park, and all other tourist destinations, the concept of carrying capacity is directly connected with the concept of sustainable development, with the aim of determining the maximum number of users. Its importance is reflected in the long-term viability of the destination, without fear that the attractiveness of the area will “reduce” or “wear out” over the time. The fact is, however, that in determining the appropriate methodology in advance it is necessary to take into account all the possible consequences of decisions but long before that decisions are made [49, 50]. Bearing all these in mind, it can be concluded that one of the most important challenges arising from aims of sustainable tourism development is responsible planning of destinations [51, 52].
6 Conclusion
Considering the ongoing and extremely progressive increase of the population [24–28], the most important conclusion of this study is the importance of the conceptualization of the capacity principles, because the ability to express the carrying capacity in terms of setting a standard measure, is required to facilitate planning of tourism [53, 54]. The study on the limits of the concept of carrying capacity has a long tradition in biology, forestry, sociology and geography [29, 55–57]. The paper presented the ratio of population to the local environment and tourism development [4], where it was noted that the concept of sports and recreational tourism is in direct proportion to the concept of sustainability. Local residents showed a high degree of awareness of the importance of controlled development of sports and recreation tourism, which was the first step in the attempt to calculate the maximum number of sports and recreational tourists for certain areas. According to these statements, it can be concluded that there is no unique formula for such a calculation and it should be noted that the presented numbers were based on the formula set by the Stanev and Lavery. The main findings of this paper were the main hypothesis confirmation that the development of sports and recreational tourism in the Fruška Gora National Park must be developed in accordance with the fundamental principles of sustainability, which also includes the determination of carrying capacity. With all these matters, this research emphasizes the conclusion that the local population believes that there is a need for limiting the number of sports and recreational tourists in National Park. The other findings show that there are measurable effects, which limit the number of sports and recreational tourists and that is possible to calculate different ratios depending on the specific features of the site through/beside which the projected paths pass, within the individual zones of Fruška Gora National Park.
Acknowledgement
The research was supported by Ministry of Education, Science and Technological Development, Republic of Serbia (Grant III 47007).
References
[1] Prato T., Modeling carrying capacity for national parks. Ecological Economics, 2001, 39, 321–33110.1016/S0921-8009(01)00248-8Suche in Google Scholar
[2] Prato T., Fuzzy adaptive management of social and ecological carrying capacities for protected areas. Journal of Environmental Management, 2009, 90, 2551-255710.1016/j.jenvman.2009.01.015Suche in Google Scholar
[3] Klaučo M., Gregorova, B., Stankov, U., Marković, V., Lemenkova, P., Determination of ecological significance based on geostatistical assessment: a case study from the Slovak Natura 2000 protected area. Open Geosciences, 2013, 5 (1), 28–42, 10.2478/s13533-012-0120-0Suche in Google Scholar
[4] Kreisel W., Reeh T., Tourism and landscape in South Tyrol. Open Geosciences, 2011, 3 (4), 410–423, DOI: 10.2478/s13533-011-0040-410.2478/s13533-011-0040-4Suche in Google Scholar
[5] Vujičić M. D., Vasiljević Dj. A., Marković S. B., Hose T. A., Lukić T., Hadžić O., Janićević S., Preliminary Geosite Assessment Model (GAM) and Its Application on Fruška Gora Mountain, Potential Geotourism Destination of Serbia. Acta Geographica Slovenica, 2011, 51, 361-37610.3986/AGS51303Suche in Google Scholar
[6] Petrović M. D., Vasiljević Dj. A., Vujičić M. D., Hose T. A., Marković S. B., Lukić T., Global Geopark and Candidate – Comparative Analysis of Papuk Mountain (Croatia) and Fruška gora Mountain (Serbia) by using GAM Model. Carphatian Journal of Earth and Environmental Sciences, 2013, 8 (1), 105–116Suche in Google Scholar
[7] Vujko A., Fruška gora i Vršačke planine - sadašnje i buduće destinacije sportsko-rekreativnog turizma, Ph.D. thesis, Faculty of Science, Novi Sad. (in Serbian), 2011Suche in Google Scholar
[8] Pettebone D., Newman P., Lawson R.S., Estimating visitor use at attraction sites and trailheads in Yosemite National Park using automated visitor counters. Landscape and Urban Planning, 2010, 97(4), 229-23810.1016/j.landurbplan.2010.06.006Suche in Google Scholar
[9] Pierce W.V., Manning R.E., Day and overnight visitors to the Olympic Wilderness. Journal of Outdoor Recreation and Tourism, 2015, 12, 14-2410.1016/j.jort.2015.11.002Suche in Google Scholar
[10] National Park Service Visitor Use Statistics, 2016 https://irma.nps.gov/Stats/Reports/ParkSuche in Google Scholar
[11] Buckley R., An ecological perspective on carrying capacity. Annals of Tourism Research, 1999, 26 (3), 705–70810.1016/S0160-7383(99)00011-0Suche in Google Scholar
[12] Arrow K., Bolin B., Costanza R., Dasgupta P., Folke C., Holling C.S., Jansson B. O., Levin S., Mäler K. G., Perrings C., Pimentel D., Economic growth, carrying capacity, and the environment. Science, 1995, 268, 520-52110.1126/science.268.5210.520Suche in Google Scholar PubMed
[13] Dang X., Liu G., Emergy measures of carrying capacity and sustainability of a target region for an ecological restoration programme: A case study in Loess Hilly Region, China. Journal of Environmental Management, 2012, 102, 55-6410.1016/j.jenvman.2012.02.023Suche in Google Scholar PubMed
[14] Finnessey L., The Negative Effects of Tourism on National Parks in the United States, PhD thesis, Johnson & Wales University, US, 2012Suche in Google Scholar
[15] Xin T.K., Kim J., Chan L., Tour Operator Perspectives on Responsible Tourism Indicators of Kinabalu National Park. Sabah, Procedia - Social and Behavioral Sciences, 2014, 144 (20), 25-3410.1016/j.sbspro.2014.07.270Suche in Google Scholar
[16] Xu F., Fox D., Modelling attitudes to nature, tourism and sustainable development in national parks: A survey of visitors in China and the UK. Tourism Management, 2014, 45, 142-15810.1016/j.tourman.2014.03.005Suche in Google Scholar
[17] Monz C., D’Antonio A., Lawson S., Barber J., Newman P., The ecological implications of visitor transportation in parks and protected areas: Examples from research in US National Parks. Journal of Transport Geography, 2016, 51, 27-3510.1016/j.jtrangeo.2015.11.003Suche in Google Scholar
[18] Butler R. W., The concept of carrying capacity for tourism destinations: dead or merely buried? Progress in Tourism and Hospitality Research, 1996, 2, 283-29310.1002/pth.6070020309Suche in Google Scholar
[19] World Tourism Organization, Tourism Carrying Capacity: Report on the Senior – Level Expert Group Meeting held in Paris, June 1990, WTO, 1992, MadridSuche in Google Scholar
[20] Abernethy V. D., Carrying capacity: The tradition and policy implications of limits. Ethics in Science and Environmental Politics ESEP, 2001, 23, 9–1810.3354/esep001009Suche in Google Scholar
[21] Van Den Bergh, J. C. J. M., A framework for modeling economy-environment-development relationships based on dynamic carrying capacity and sustainable development feedback. Environmental Resources and Economics, 1993, 3 (4), 395–41210.1007/BF00418819Suche in Google Scholar
[22] Sterrer W., Human economics: A non-human perspective. Ecological Economics, 1993, 7 (3), 183–20210.1016/0921-8009(93)90003-OSuche in Google Scholar
[23] Carey D. I., Development based on carrying capacity: A strategy for environmental protection. Global Environmental Change, 1993, 3 (2), 140–14810.1016/0959-3780(93)90002-3Suche in Google Scholar
[24] King J., Slesser M., Prospects for sustainable development: The significance of population growth. Population and Environment, 1995, 16 (6), 487–50510.1007/BF02208558Suche in Google Scholar
[25] Cohen J. E., Population growth and Earth’s human carrying capacity. Science, 1995, 26 (5222), 341–34610.1126/science.7618100Suche in Google Scholar PubMed
[26] Wetzel K. R., Wetzel J. F., Sizing the earth: recognition of economic carrying capacity. Ecological Economics, 1995, 12 (1), 13-2110.1016/0921-8009(94)00019-RSuche in Google Scholar
[27] Fearnside P.M., Human carrying capacity estimation in Brazilian Amazonia as a basis for sustainable development. Environmental Conservation, 1997, 24 (3), 271-28210.1017/S0376892997000350Suche in Google Scholar
[28] Cohen J. E., Population, economics, environment and culture: an introduction to human carrying capacity. Journal of Applied Ecology, 1997, 34 (6), 1325-1333.10.2307/2405250Suche in Google Scholar
[29] McCool S., Lime D., Tourism carrying capacity: tempting fantast or useful reality. Journal of Sustainable Tourism, 2001, 9, 372-38810.1080/09669580108667409Suche in Google Scholar
[30] Brown M.T., Ulgiati S., Emergy measures of carrying capacity to evaluate economic investments. Population and Environment, 2001, 22 (5), 471-50110.1023/A:1010756704612Suche in Google Scholar
[31] Miljković O., Živković Lj., Possibilities for the development of ecotourism in protected areas of western Serbia. Journal of Geographical Institute ”Jovan Cvijic” SASA, 2012, 62 (3), 65-8010.2298/IJGI1203065MSuche in Google Scholar
[32] Zhong-gen W., Yu-zhou L., Ming-hua Z., Jun X., Quantitative evaluation of sustainable development and eco-environmental carrying capacity in water-deficient regions: A case study in the Haihe River Basin, China. Journal of Integrative Agriculture, 2014, 13 (1), 195-20610.1016/S2095-3119(13)60423-2Suche in Google Scholar
[33] Petrović M. D., Marković J. J., Sustainable Tourism as a Part of Comprehensive Environmental Monitoring. A Study of Serbia. Journal of Environmental and Tourism Analysis, 2013, 1, 30-42Suche in Google Scholar
[34] Alexandrovich Kuberis E., Alekseevich Gorbachov E., Environmental monitoring and analysis of quality of the Nizhny Novgorod Region ground water with the development of the technologies of their filtration. Journal of Geographical Institute ”Jovan Cvijić” SASA, 2014, 64 (2), 177–19110.2298/IJGI1402177KSuche in Google Scholar
[35] Jovićić D., Dragin A., The Assessment of Carrying Capacity – A Crucial Tool for Managing Tourism Effects in Tourist Destinations. Tourism, 2008, 12, 4-1110.5937/Turizam0812004JSuche in Google Scholar
[36] Weaver D., Sustainable Tourism: Theory and Practice. Elsevier Butterworth-Heinemann, 2006, OxfordSuche in Google Scholar
[37] Bukurov B., Baćka, Banat, Srem. Matica Srpska, 1978, Novi Sad, (in Serbian)Suche in Google Scholar
[38] Hose, T., Marković, S.B., Komac, B., Zorn, M. Geotourism - a short introduction. Acta Geographica Slovenica, 2011, 51, 339-342, 10.3986/AGS51301Suche in Google Scholar
[39] Vasiljević, Dj.A., Marković, S.B., Hose, T.A., Smalley, I., O’Hara Dhand, K., Basarin, B., Lukić, T., Vujičić, M.D. Loess Towards (Geo) Tourism - Proposed Application on Loess In Vojvodina Region (North Serbia). Acta Geographica Slovenica, 2011, 51, 391-406, 10.3986/AGS51305Suche in Google Scholar
[40] Vujko A., Plavša J., Networking of Fruška gora lakes tourist offer through system of cyclepaths – case study Sot, Bruje and Moharać. Tourism, 2010,15 (1), 1-1010.5937/Turizam1101001VSuche in Google Scholar
[41] Vujko A. Plavša J., Evaluation of National Park Fruška Gora (Serbia) for sport and recreational tourism. Acta geographica Slovenica, 2014, 54 (2), 321–334, http://dx.doi.org/10.3986/AGS5420610.3986/AGS54206Suche in Google Scholar
[42] Vasiljević, D.A., Marković, S.B., Hose, T.A., Ding, Z. L, Guo, Z.T., Liu, X.M., Smalley, I., Lukić, T., Vujičić, M.D. Loess-palaeosol sequences in China and Europe: Common values and geoconservation issues. Catena, 2014, 117, 108-117.10.1016/j.catena.2013.06.005Suche in Google Scholar
[43] Stanev P., Harmful ecological consequences of the development of the tourist industry and their prevention. UN-ECE, 1976, New YorkSuche in Google Scholar
[44] Čomić Đ., Pjevać N., Turistička geografija, Savezni centar za unapređenje hotelijerstva – ugostiteljstva, 1997, Beograd, (in Serbian)Suche in Google Scholar
[45] Lavery P., Recreational Geography. David-Charles, 1971, LondonSuche in Google Scholar
[46] Mihalić T., Environmental management of a tourist destination. A factor of tourism competitiveness. Tourism Management, 2000, 21, 65–7810.1016/S0261-5177(99)00096-5Suche in Google Scholar
[47] Ritchie J. R. B., Crouch, G. I., The competitive destination: A sustainability perspective. Tourism Management, 2000, 21, 1–7Suche in Google Scholar
[48] Papageorgiou K., Brotherton I., A management planning framework based on ecological, perceptual and economic carrying capacity: the case study of Vikos-Aoos National Park, Greece. Journal of Environmental Management, 1999, 56, 271-28410.1006/jema.1999.0285Suche in Google Scholar
[49] Rajarama T., Das A., Screening for EIA in India: Enhancing effectiveness through ecological carrying capacity approach. Journal of Environmental Management, 2011, 92, 140-14810.1016/j.jenvman.2010.08.024Suche in Google Scholar
[50] Liu R.Z., Borthwick A. G. L., Measurement and assessment of carrying capacity of the environment in Ningbo, China. Journal of Environmental Management, 2011, 92, 2047-205310.1016/j.jenvman.2011.03.033Suche in Google Scholar
[51] Rees W., Ecological footprints and appropriated carrying capacity: what urban economics leaves out. Environment and Urbanization, 1992, 4, 121-13010.4324/9781315800486-15Suche in Google Scholar
[52] Dredge D., Destination place planning and design. Annals of Tourism Research, 1999, 26 (4), 772–79110.1016/S0160-7383(99)00007-9Suche in Google Scholar
[53] Lindberg K., McCool S., Stankey G., Rethinking carrying capacity. Annals of Tourism Research, 1997, 24, 461-46510.1016/S0160-7383(97)80018-7Suche in Google Scholar
[54] Garrigos-Simón F. J., Narangajavana Y., Palacios Marques D., Carrying capacity in the tourism industry: a case study of Hengistbury Head. Tourism management, 2004, 25 (2), 275-28310.1016/S0261-5177(03)00089-XSuche in Google Scholar
[55] Navarro Jurado E., Tejada Tejada M., Almeida García F., Cabello González J., Cortés Macías R., Delgado Peńa J., Fernández Gutiérrez F., Gutiérrez Fernández G., Luque Gallego M., Málvarez García M., Marcenaro Gutiérrez O., Navas Concha F., Ruiz de la Rúa F., Ruiz Sinoga J., Solís Becerra F., Carrying capacity assessment for tourist destinations. Methodology for the creation of synthetic indicators applied in a coastal area. Tourism Management, 2012, 33, 1337-134610.1016/j.tourman.2011.12.017Suche in Google Scholar
[56] Brankov, J., Jovičić, D., Milijašević, D., Sustainable Tourism in National Park “Đerdap”, Serbia – Attitudes of Local Population. Journal of the Geographical Institute “Jovan Cvijic” SASA, 2015, 65 (2), 183-199.10.2298/IJGI1502183BSuche in Google Scholar
[57] Srdanović, M., Pavić, D., Tourists’ attitudes on tourism offer in north-western part of Montenegro. Journal of the Geographical Institute “Jovan Cvijic” SASA, 2015, 65 (2), 201–214.10.2298/IJGI1502201SSuche in Google Scholar
© 2017 Aleksandra Vujko et al.
This work is licensed under the Creative Commons Attribution-NonCommercial-NoDerivatives 3.0 License.
Artikel in diesem Heft
- Regular Articles
- Two types of gabbroic xenoliths from rhyolite dominated Niijima volcano, northern part of Izu-Bonin arc: petrological and geochemical constraints
- Regular Articles
- CRSP, numerical results for an electrical resistivity array to detect underground cavities
- Regular Articles
- Magma evolution inside the 1631 Vesuvius magma chamber and eruption triggering
- Regular Articles
- Probabilities of Earthquake Occurrences along the Sumatra-Andaman Subduction Zone
- Regular Articles
- Modelling of carrying capacity in National Park - Fruška Gora (Serbia) case study
- Regular Articles
- Knickzone Extraction Tool (KET) – A new ArcGIS toolset for automatic extraction of knickzones from a DEM based on multi-scale stream gradients
- Regular Articles
- When the display matters: A multifaceted perspective on 3D geovisualizations
- Regular Articles
- Dependence of Gully Networks on Faults and Lineaments Networks, Case Study from Hronska Pahorkatina Hill Land
- Regular Articles
- Environmental Geochemistry of Geophagic Materials from Free State Province in South Africa
- Regular Articles
- Neotectonic interpretations and PS-InSAR monitoring of crustal deformations in the Fujian area of China
- Regular Articles
- Dual-shale-content method for total organic carbon content evaluation from wireline logs in organic shale
- Regular Articles
- The dolerite dyke swarm of Mongo, Guéra Massif (Chad, Central Africa): Geological setting, petrography and geochemistry
- Regular Articles
- Seismic data filtering using non-local means algorithm based on structure tensor
- Regular Articles
- Pore Distribution Characteristics of the Igneous Reservoirs in the Eastern Sag of the Liaohe Depression
- Regular Articles
- Three-dimensional structural model of the Qaidam basin: Implications for crustal shortening and growth of the northeast Tibet
- Regular Articles
- Failure Mode of the Water-filled Fractures under Hydraulic Pressure in Karst Tunnels
- Regular Articles
- Creating a low carbon tourism community by public cognition, intention and behaviour change analysisa case study of a heritage site (Tianshan Tianchi, China)
- Regular Articles
- Mapping Mangrove Density from Rapideye Data in Central America
- Regular Articles
- Marine sediment cores database for the Mediterranean Basin: a tool for past climatic and environmental studies
- Regular Articles
- Retrofitting the Low Impact Development Practices into Developed Urban areas Including Barriers and Potential Solution
- Regular Articles
- Spatial uncertainty of a geoid undulation model in Guayaquil, Ecuador
- Regular Articles
- Structure and Filling Characteristics of Paleokarst Reservoirs in the Northern Tarim Basin, Revealed by Outcrop, Core and Borehole Images
- Regular Articles
- Ground volume assessment using ’Structure from Motion’ photogrammetry with a smartphone and a compact camera
- Regular Articles
- Classification of coal seam outburst hazards and evaluation of the importance of influencing factors
- Regular Articles
- Geochemical characterization of Neogene sediments from onshore West Baram Delta Province, Sarawak: paleoenvironment, source input and thermal maturity
- Regular Articles
- Influence of Social-economic Activities on Air Pollutants in Beijing, China
- Regular Articles
- Spectral properties of weathered and fresh rock surfaces in the Xiemisitai metallogenic belt, NW Xinjiang, China
- Regular Articles
- Geochemistry of sandstones and shales from the Ecca Group, Karoo Supergroup, in the Eastern Cape Province of South Africa: Implications for provenance, weathering and tectonic setting
- Regular Articles
- Petrology and geochemistry of meta-ultramafic rocks in the Paleozoic Granjeno Schist, northeastern Mexico: Remnants of Pangaea ocean floor
- Regular Articles
- Distal turbidite fan/lobe succession of the Late Oligocene Zuberec Fm. – architecture and hierarchy (Central Western Carpathians, Orava–Podhale basin)
- Regular Articles
- Fourier Transform Infrared Spectroscopy of Clay Size Fraction of Cretaceous-Tertiary Kaolins in the Douala Sub-Basin, Cameroon
- Regular Articles
- Optimized AVHRR land surface temperature downscaling method for local scale observations: case study for the coastal area of the Gulf of Gdańsk
- Regular Articles
- New non-linear model of groundwater recharge: Inclusion of memory, heterogeneity and visco-elasticity
- Regular Articles
- “Urban geosites” as an alternative geotourism destination - evidence from Belgrade
- Regular Articles
- A customized resistivity system for monitoring saturation and seepage in earthen levees: installation and validation
- Regular Articles
- Consideration of Landsat-8 Spectral Band Combination in Typical Mediterranean Forest Classification in Halkidiki, Greece
- Regular Articles
- Coda Wave Attenuation Characteristics for North Anatolian Fault Zone, Turkey
- Regular Articles
- Modal composition and tectonic provenance of the sandstones of Ecca Group, Karoo Supergroup in the Eastern Cape Province, South Africa
- Regular Articles
- Quantitative studies of the morphology of the south Poland using Relief Index (RI)
- Regular Articles
- Interpretation of sedimentological processes of coarse-grained deposits applying a novel combined cluster and discriminant analysis
- Regular Articles
- Utilizing borehole electrical images to interpret lithofacies of fan-delta: A case study of Lower Triassic Baikouquan Formation in Mahu Depression, Junggar Basin, China
- Regular Articles
- Grain size statistics and depositional pattern of the Ecca Group sandstones, Karoo Supergroup in the Eastern Cape Province, South Africa
- Regular Articles
- Carbonate stable isotope constraints on sources of arsenic contamination in Neogene tufas and travertines of Attica, Greece
- Regular Articles
- Appreciation of landscape aesthetic values in Slovakia assessed by social media photographs
- Regular Articles
- Geochemistry of Selected Kaolins from Cameroon and Nigeria
- Regular Articles
- Spatial pattern of ASG-EUPOS sites
- Regular Articles
- A Stream Tilling Approach to Surface Area Estimation for Large Scale Spatial Data in a Shared Memory System
- Regular Articles
- A location-based multiple point statistics method: modelling the reservoir with non-stationary characteristics
- Regular Articles
- Water Inrush Analysis of the Longmen Mountain Tunnel Based on a 3D Simulation of the Discrete Fracture Network
- Regular Articles
- A Computer Program for Practical Semivariogram Modeling and Ordinary Kriging: A Case Study of Porosity Distribution in an Oil Field
- Regular Articles
- Imaging and locating paleo-channels using geophysical data from meandering system of the Mun River, Khorat Plateau, Northeastern Thailand
- Regular Articles
- Rare earth element contents of the Lusi mud: An attempt to identify the environmental origin of the hot mudflow in East Java – Indonesia
- Regular Articles
- Is Nigeria losing its natural vegetation and landscape? Assessing the landuse-landcover change trajectories and effects in Onitsha using remote sensing and GIS
- Regular Articles
- Methodological approach for the estimation of a new velocity model for continental Ecuador