A customized resistivity system for monitoring saturation and seepage in earthen levees: installation and validation
-
Diego Arosio
 ,
Stefano Munda
,
Stefano Munda

Abstract
This work is based on the assumption that a resistivity meter can effectively monitor water saturation in earth levees and can be used as a warning system when saturation exceeds the expected seasonal maxima. We performed time-lapse ERT measurements to assess the capability of this method to detect areas where seepage is critical. These measurements were also very useful to design a prototype monitoring system with remarkable savings by customizing the specifications according to field observations. The prototype consists of a remotely controlled low-power resistivity meter with a spread of 48 stainless steel 20 × 20 cm plate electrodes buried at half-meter depth. We deployed the newly-designed permanent monitoring system on a critical levee segment. A weather station and an ultrasonic water level sensor were also installed in order to analyse the correlation of resistivity with temperature, rainfalls and water level seasonal variations.
The preliminary analysis of the monitoring data shows that the resistivity maps follow a very reasonable trend related with the saturation/drying cycle of the levee caused by the seasonal variations of the water level in the irrigation channel. Sharp water level changes cause delayed and smooth resistivity variations. Rainfalls and, to a lesser extent, temperature seem to have an influence on the collected data but effects are apparently negligible beyond 1 m depth. The system is currently operating and results are continuously monitored.
1 Introduction
Failures of levees cause flooding that can pose a serious threat to human settlements and infrastructures. In many instances, assessment of earth embankments involves just visual inspection, so that the conditions of the inner structure of the levees are poorly known. Seepage is one of the main phenomena causing damages within earth embankments and can lead to ultimate failure, as it is difficult to be detected in advance. However, geophysical methodologies can be used to investigate embankment inner conditions in a non-destructive manner, with the aim of locating critical saturation areas.
Because of an increased sensitivity to environmental risk mitigation, in the last years geophysical techniques classically used for exploration tasks have been turned into valuable monitoring tools in different application fields, such as reservoir induced seismicity [1], reservoir stimulation [2], gas storage reservoirs, CO2 sequestration pilot sites [3], clandestine underground nuclear testing, landslides [4, 5], unstable rock slopes [6–11]. Passive seismics is the most popular geophysical technique for monitoring purposes but DC resistivity has been recently gaining more and more interest for environmental risks related to water circulation.
Resistivity is an intrinsic property indicating how strongly a material opposes the flow of electrical current and it is function of many parameters, such as salinity, temperature [12], soil grain size, porosity and water content [13–18]. For these grounds, Electrical Resistivity Tomography (ERT) methods can be used for several purposes, such as natural hazard mitigation [19–23], monitoring of contaminated sites [24, 25] and of infrastructures [26, 27], hydrology [28–31] and CO2 monitoring [32], providing information about subsurface characteristics.
In recent years, time-lapse ERT has been employed in many studies in order to associate changes in resistivity values to variations in the monitored parameters of interests. But just in a limited number of cases an automatic integrated monitoring system has been developed [33–36]. According to the scientific literature, the most addressed application field is the one related to permanent or periodic landslide monitoring [37–40], because resistivity values are strongly affected by water content variation, which is one of the most important landslide triggering factors [41]. The work presented here discusses time-lapse ERT as a permanent monitoring tool for water saturation and infiltration in earth embankments. Areas with augmented saturation or seepage, which may evolve to ultimate dyke failure, are supposed to be detectable as zones of negative resistivity gradient. Others geophysical techniques can also be used to assess the stability of levees and dams, such as streaming potential [42], seismic tomography [42–45], Multichannel Analysis of Surface Waves (MASW) [43], refraction seismics [42, 45], Ground Penetrating Radar (GPR) [45] and Controlled Source MagnetoTelluric (CSMT) [45], but these methods are not as attractive as ERT for the development of a permanent monitoring system. The streaming potential method is sensitive to water flow and can detect the occurrence of new seepage areas as well as the increase of known seepage phenomena. Nevertheless, it could not be able to monitor slow variations of saturation level and, as a consequence, it may fail to detect when a water content threshold level is exceeded, this giving poor information about the triggering factor of a possible structural failure. Besides, the streaming potential method requires non-polarizable electrodes whose durability and maintenance are likely to be unsuitable for a permanently buried spread. Active seismics can detect underground water, but cannot be used for continuous monitoring, while passive seismics is potentially suitable, but its sensitivity to saturation level variations is lower than ERT one. GPR is a promising fast scanning tool for checking the integrity of levees and for detecting new cavities, such as those excavated by rodents. However, GPR can hardly be customized into a permanent and automated monitoring system and may suffer from low penetration depth due to high-conductivity embankment materials or when the levee is highly saturated (i.e., during the irrigation season). For the above grounds, we elected DC resistivity to be the best geophysical technique to monitor levee saturation because of its high sensitivity to water content variations and because the equipment can be easily customized into a permanent monitoring system.
To test the methodology, a custom prototype of resistivity-meter, specifically designed to be cost-effective and energy-efficient, has been installed to monitor a levee close to a small village in a rural area. The electrodes have been deployed along the crest of the levee and the system collects standard 2D resistivity sections parallel to the channel main axis. Different deployment geometries could have been considered, e.g., crossline spreads or 3D configurations [46], but the small size of the levee section investigated in this study and the concrete liner protecting its internal side make the design of other configurations quite difficult. The test site has been also equipped with a weather station to record meteorological parameters for data interpretation since resistivity values are influenced by air and soil temperature as well as by rainfalls. In the last decades several studies have deeply investigated the relationship between temperature and resistivity and many approaches have been proposed to remove the effect of temperature from collected datasets [47–53]. On the contrary, only a few studies analysed how to remove the influence of rainfalls from field measurements [54].
2 Methods
2.1 Preliminary tests
Preliminary time-lapse tests were performed on a short segment of an earth levee to achieve the following objectives: a) to evaluate the effectiveness of ERT measurements to detect seepage areas; b) to determine ideal acquisition parameters (i.e., current injection, duty cycle, minimum required voltage) in order to define the specifications for the design of a low-cost permanent monitoring system customized for earth levees.
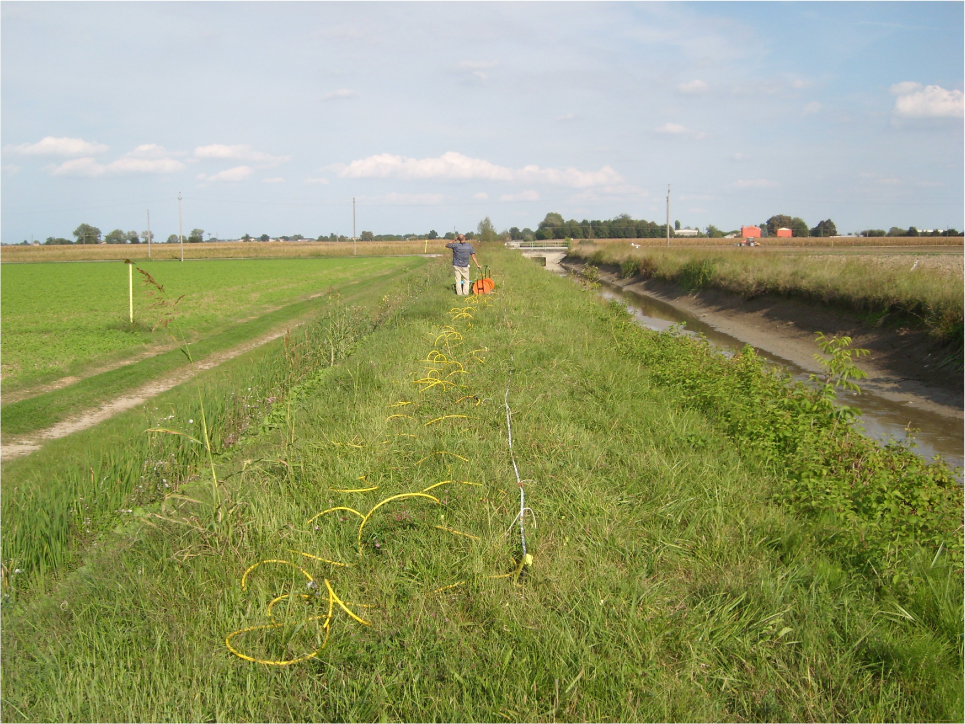
We selected a reference test-site (Figure 1), hereafter referred to as site A, located in a small village about 30 km south-east of Mantova, a city in Northern Italy in the Po Plain, where intensive farming promoted the development of a dense network of irrigation canals. The authority managing the irrigation infrastructures has been regularly monitoring this site because it is affected by a visible water leakage pinpointed in a very small area of the levee. Although site A is located in a rural area with no houses directly threatened by a potential failure of the embankment, we were suggested to test the ERT methodology here to evaluate whether it is sensitive enough to detect small seepage paths that might slowly erode the levee and generate a collapse of the earth structure. According to this, for the preliminary measurements we have been visiting site A regularly throughout one year with a commercial resistivity meter (IRIS Syscal Pro Switch) controlling an array of 48 1 m-spaced electrodes. Dipole-dipole and Wenner configurations were initially tested, and since both were able to detect the seepage zone with satisfactory accuracy, the Wenner configuration was finally preferred in order to ensure a good signal-to-noise ratio with minimum current injection. Indeed, low-current injection is beneficial to minimize costs and power consumption of the permanent monitoring system. With the selected acquisition geometry, the minimum quadrupole separation is 1 m, while the maximum is 15 m, so that the expected maximum penetration depth is 7.5 m, with a vertical resolution of 0.5 m and a horizontal one of 1 m. As a result, the electrical survey is supposed to explore the entire structure of the levee and the foundation soil with a good level of detail. Within the levee, corresponding to the top 3 m of the resistivity section, we expect that a standard Wenner configuration with the abovementioned acquisition geometry can provide resolution and sensitivity good enough to detect water content anomalies with sizes of the order of 1 m or 2 m, as also proved by the following experimental results.
Earth levee and water channel (on the right) in test site A at the end of the irrigation season.
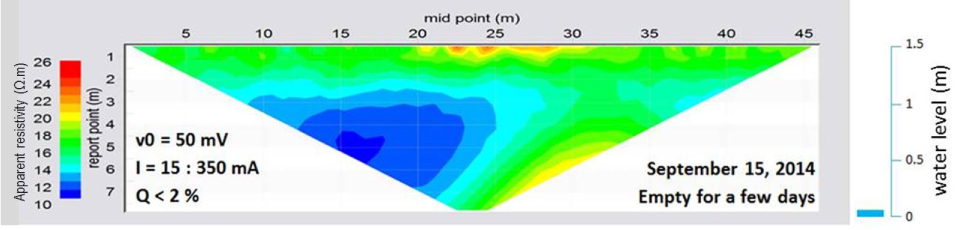
The preliminary tests provided good results as we observed a high correlation with the irrigation periods (Figure 2). Resistivity increases during autumn and winter, when the water level in the channel is very low, and decreases in summertime, when the water level is maximum. We also checked that resistivity values are only affected by dyke saturation and that they are not influenced by 3D lateral effects due to the presence of the water mass in the canal. This is proved by comparing the top three apparent resistivity maps in Figure 2. During winter (resistivity map collected on January 13), remarkable higher resistivity values are measured as a result of the drying of the levee earth structure. Since the drying process takes some time to occur, the resistivity map measured on September 15, i.e. a few days after the channel was emptied, is very similar to the map measured on September 3 when the water level was still very high. If the difference between resistivity maps measured in early September and in January could be directly related to the presence of the water mass in the canal, resistivity values collected in mid-September should have been similar to those collected in winter time.
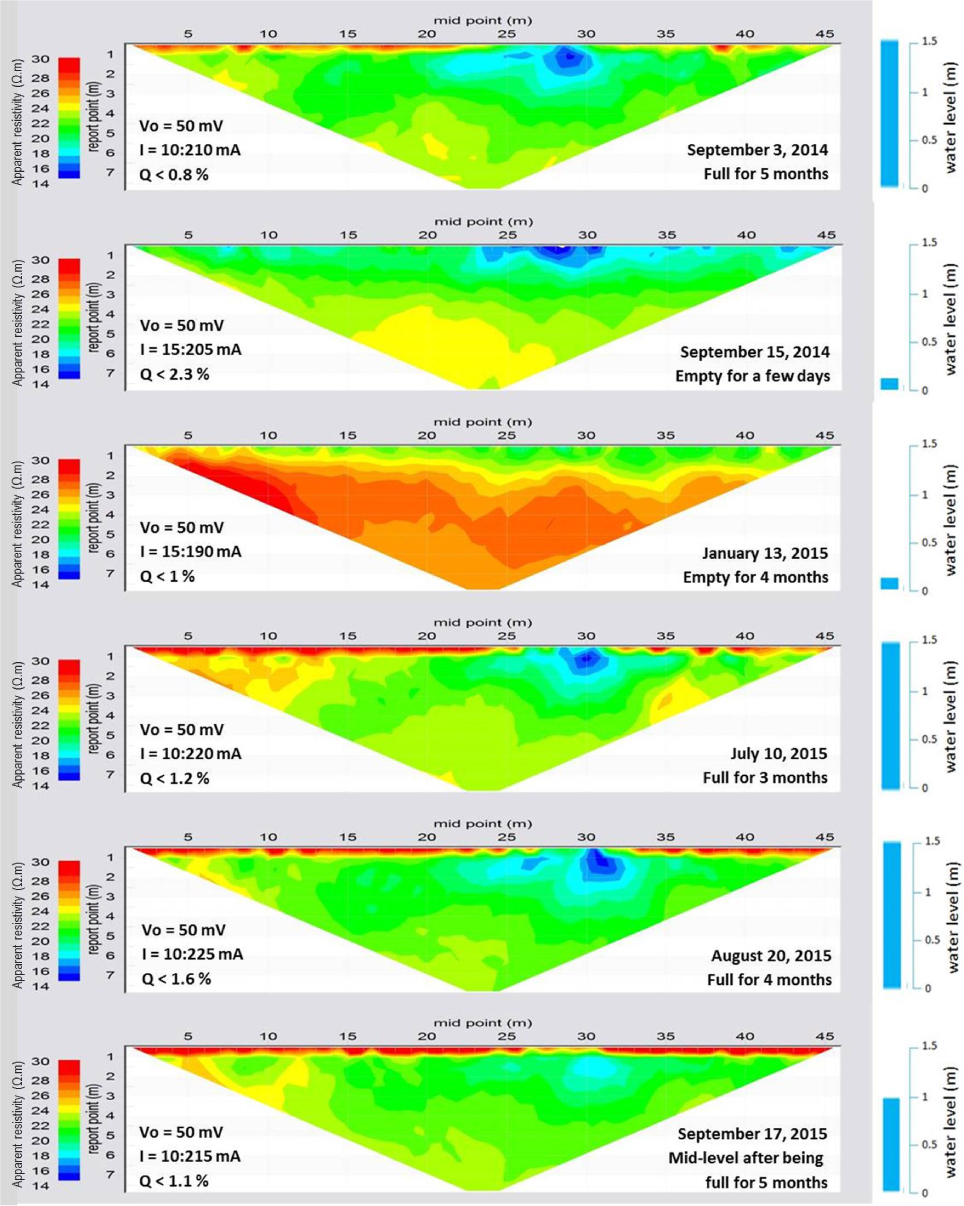
Apparent resistivity maps obtained in the preliminary measurements with a commercial portable equipment in test site A. Vo is the required minimum voltage, I is the range of the injected current and Q is the standard deviation of the measurements. The label “report point” of the vertical axis indicates the pseudo-depth of the measured resistivity and is proportional to the electrode distance. The light blue bar on the right side of each map indicates the water level in the canal during the measurement.
The known seepage in site A was first detected as a shallow low resistivity anomaly during summer 2014, then it vanished during the following winter season when the canal was empty, and finally it was again detected in spring-summer 2015 as soon as the irrigation season started. Nonetheless, an unexpected result was observed in the last survey performed on September 17 (bottom map in Figure 2). While during July and August the low resistivity anomaly is clearly noticeable on the apparent resistivity maps, the map measured in mid-September, when water level started to decrease, hardly shows the low resistivity spot. By carefully inspecting the levee close to the seepage, we observed a 2 m-wide 0.5 m-deep ground subsidence (Figure 3). Thus, we interpreted the lack of the resistivity anomaly as the result of a temporarily stop of the seepage caused by a sudden soil compaction event.
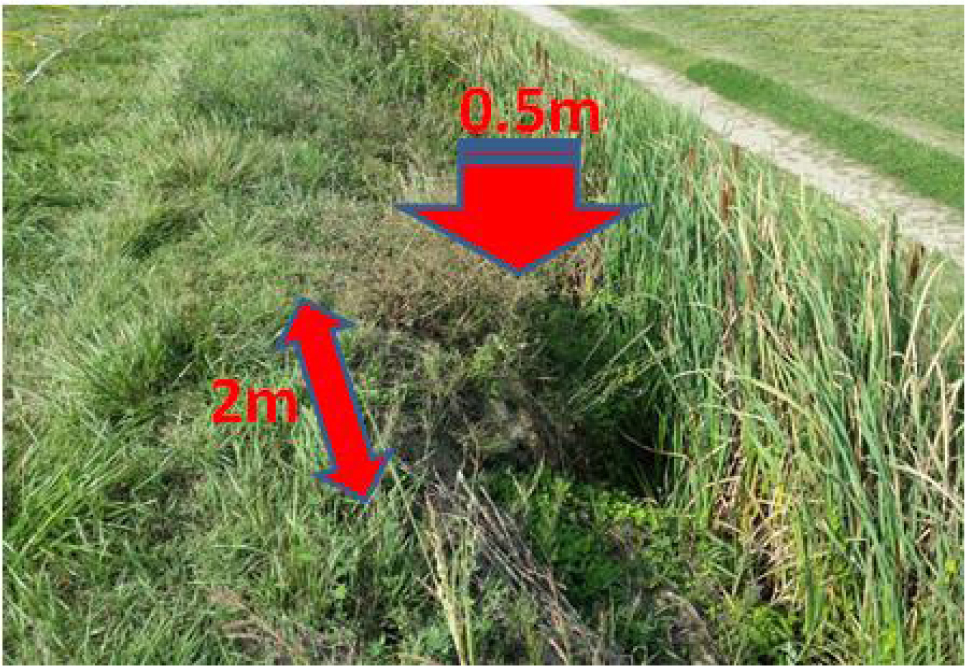
Small levee subsidence observed in test site A.
Based on the results obtained in the preliminary study carried out in test site A, we could conclude that ERT sensitivity and resolution are high enough to pinpoint seepage zones along earth levees and that DC resistivity equipment could be used as a permanent monitoring tool to reveal potential failures. Preliminary measurements were also important to define the specifications of the custom resistivity meter according to the measured resistivity range, which was found to vary from 5 to 40 Ωm, and to the electrode contact resistance spanning from 300 to 800 Ω. We also checked the highest current injection required to measure a voltage of at least 50 mV at the potential electrodes with standard deviation lower than 2.5% and we determined that a current of 200 mA would be enough to ensure reliable results. Finally, we calculated that the energy consumption for a 48 electrode system exploring the full depth range with the Wenner configuration is lower than 8 Wh and this value was used to design the power supply system of the prototype.
Preliminary measurements were also carried out on other embankments with the purpose of selecting a test site where to install the prototype of the newly-designed monitoring system. We finally selected a site, hereafter referred to as site B, just 2 km west of site A. Despite their small distance, site B is very different from site A because in this area the channel is very close to nearby houses and it is protected by a concrete liner that covers the floor as well as the inner sides (Figure 4a). In the past, this section was highly affected by structural problems and required frequent maintenance so that concrete lining was necessary to improve waterproofing and stability by reducing seepage and erosion. Nevertheless, erosion of the earth structure behind the liner can still take place because seepage may occur both along joints between different sections of the liner (Figure 4b) and behind concrete slabs at the beginning/end of the lined section (Figure 4c). In the long term, seepage can progressively increase and large cavities behind the liner can undermine the stability of the structure. In addition, concrete lining may also prevent a prompt detection of erosional activity (Figure 4c) so that dyke failures may occur unexpectedly and with potentially serious consequences. During preliminary measurement sessions, we found out that site B is also characterized by a quite large low resistivity anomaly during the irrigation season, as depicted in Figure 5, which shows the apparent resistivity map measured in mid-September, a few days after the canal was emptied. The large local minimum of apparent resistivity located on the left side of the map may indicate significant under seepage flow. As in site A, the resistivity anomaly progressively disappears throughout autumn and winter, but is again detected in spring at the beginning of the irrigation season.
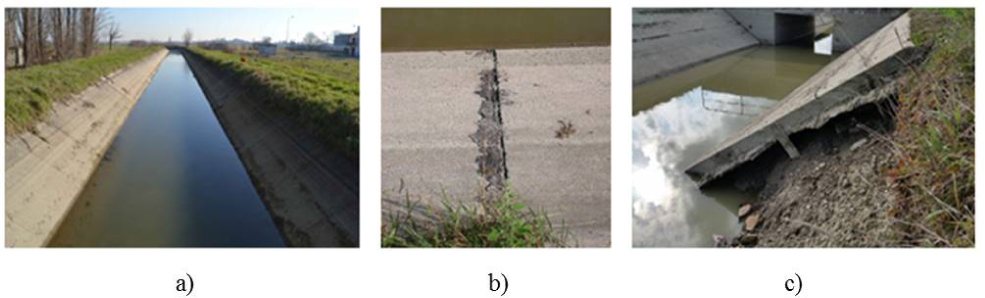
(a) Water channel and earth levees in test site B; (b) Examples of open joint between liner sections; (c) Example of a section were erosion is taking place behind the liner.
Apparent resistivity map obtained in the preliminary measurements with a commercial portable equipment in test site B. Vo is the required minimum voltage, I is the range of the injected current and Q is the standard deviation of the measurements. The label “report point” of the vertical axis indicates the pseudo-depth of the measured resistivity and is proportional to the electrode distance. The light blue bar on the right side of the map indicates the water level in the canal during the measurements.
For all the above mentioned grounds, we deemed site B to be a suitable test site were to install the prototype permanent monitoring system.
2.2 Prototype design and installation
Commercial resistivity meters are general purpose equipment designed to explore a large range of depths, from a few meters with short cables and small electrode spacing to some hundreds of meters by using long cables and by injecting high currents. This feature is needless when ERT is employed as a permanent monitoring tool on earth structures such as embankments and levees. Besides, commercial systems are portable devices that are generally conceived neither for remote control nor for automatic longdistance data transmission. As a result, the use of a commercial resistivity meter for a levee long-term monitoring system is not cost-effective because the equipment is oversized in terms of penetration depth. In addition, it would also require the development of hardware and software to connect the monitoring system to the solar panels providing battery recharge and to the mobile network to ensure remote control and data transmission. Thus, we decided to design a new prototype system according to the main specifications listed in Table 1.
Main specifications for the prototype monitoring system.
| Number of electrodes | 48 |
| Max injection current | 200 mA |
| Default electrode configuration | Wenner |
| Lightning protection | Yes |
| Contact resistance check | Yes |
| Power system for battery recharge | Solar panel |
| Remote control and transmission | Via mobile network |
| Default measurement interval | 24 hours |
| Default data transmission interval | 24 hours |
| Data file parameters | Voltage, Current, Standard Deviation, Resistivity |
Actually, the very first prototype was designed to have a maximum injection current of 100 mA but this value was increased to 200 mA with no need for changing any hardware components once we observed that doubling the current improved the stability of the deeper measurements and that the power supply system (battery and solar panel) was not critically affected by the increase in energy consumption.
For the deployment of the prototype we prepared a spread consisting of two multi-conductor cables with 24 1 m-spaced take-outs each. Therefore, the spread allows for the levee to be investigated down to a maximum depth of about 7 m which is far beyond the 3 m thickness of the earth embankment in site B. Because of the spacing of 1m between the electrodes, measurement horizontal resolution is 1 m, while vertical resolution is about 0.5 m.
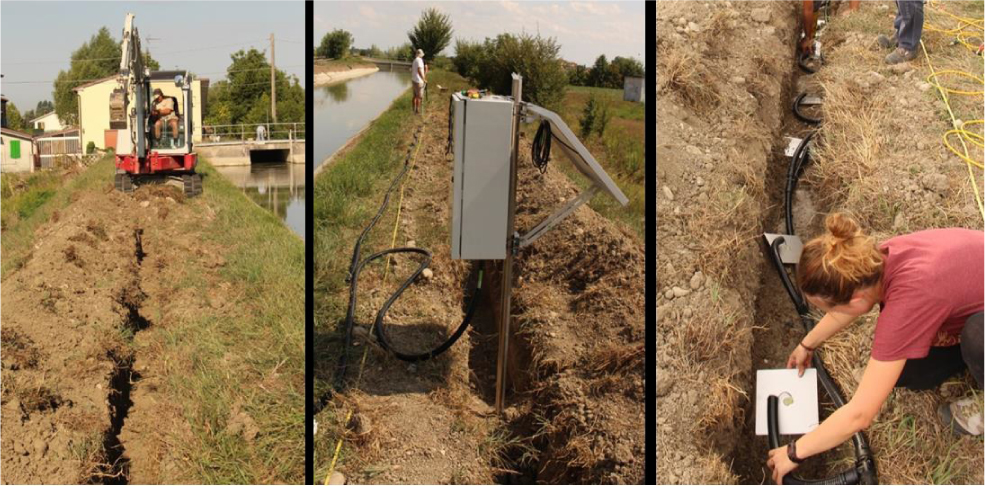
The spread was thought to be buried in the middle of the levee cross-section so that we had to adopt a proper electrode design and a method to protect the cables from rodents. We installed 20 × 20 cm stainless-steel plate electrodes to ensure an efficient long-term coupling, cables were enclosed within a robust dielectric plastic case (Figure 6a) and the connections with the electrodes were sealed by means of a bi-component resin. A box hosting the electronics of the resistivity meter was placed in the middle of the array (Figure 6b), and cables and electrodes were buried in a 0.5 m-deep trench (Figure 6c). A weather station, equipped with air and soil temperature sensors, hygrometer, rain gauge, ultrasonic water level sensor and 1m Time Domain Reflectometry (TDR) probe was also installed in order to correlate resistivity values with the variations of temperature, rainfall and water level in the canal. As the TDR probe can monitor soil permittivity, we may be able to tune a curve relating resistivity and water content.
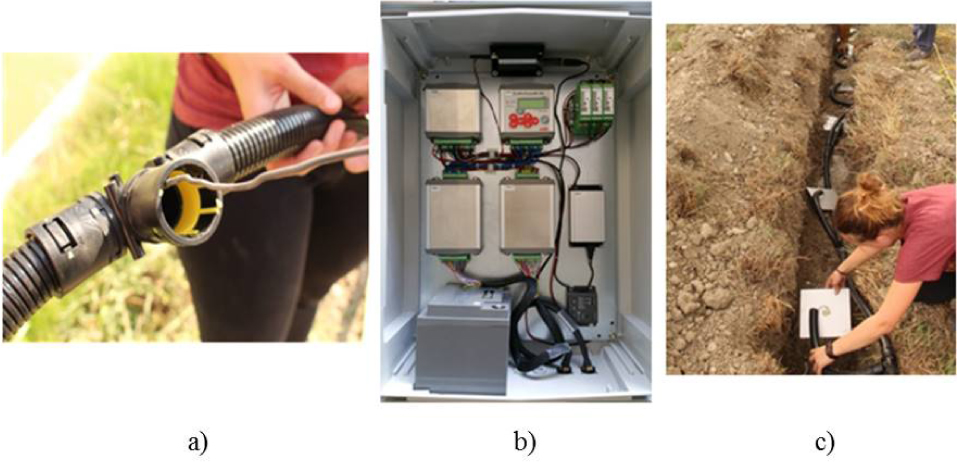
(a) Anti-rodent dielectric protection; (b) Resistivity meter box; (c) Deployment of the permanent plate electrodes.
Both the resistivity meter and the weather station are powered by solar panels and a modem is set for daily data transmission to a web site where the data are stored and can be analysed.
The file transmitted from the resistivity meter (one file per day) contains apparent resistivity values, injected current, measured voltage and a quality factor (percentage standard deviation) of the measurements, while the one from the meteorological station provides air and soil temperatures, air humidity, rainfall, water level and dielectric constant measured with a sampling interval of 10 minutes.
All the acquisition parameters, such as the maximum injected current, the minimum requested voltage, the requested quality factor, the measurement interval and the acquisition sequence, can be remotely managed through the mobile network connection.
2.3 Prototype validation
To analyse the performance of the prototype and to check the reliability of the collected datasets, we planned comparison sessions between the prototype and a Syscal Pro Switch resistivity meter. More in detail, we performed joint measurements on the day the prototype was deployed at site B and two weeks later, namely on September 17, 2015. Each system was connected to its own electrode spread, i.e. 48 buried plate electrodes and 48 stainless steel rods planted on the levee surface for the prototype and the commercial equipment respectively.
The results of the comparison performed on the day of the installation were very encouraging as the apparent resistivity values measured by the two systems have the same trend down to a pseudo-depth of 5 m, with a difference of 2-3 Ωm, corresponding to a misfit of 10%-20%. At first we occasionally observed unsatisfactory standard deviations in the prototype deeper measurements, but this issue was solved by optimizing the acquisition parameters (especially the duty cycle) in the following days. The second comparison session was planned to check the prototype system was working flawlessly and to allow for soil compaction above the permanent buried electrodes. Figure 7 shows apparent resistivity values at different depths, while Fig. 8 compares the apparent resistivity pseudosections: data consistency is good and trends are very similar with maximum differences of about 3 Ωm. However, we observed that apparent resistivity measured by the prototype is systematically lower with a mean difference of about 1-2 Ωm. This is due to different electrode depths of the two systems. Contrary to the custom system, the commercial equipment employed surface electrodes planted in the high-resistivity top soil (see Figure 8) resulting from a long period of dry weather. Since measured apparent resistivities are influenced by the real resistivities of the materials in between the electrodes and the maximum penetration depth of the injected current, Syscal apparent resistivities are higher, as a result of the high-resistivity top soil which is not affecting the apparent resistivities measured by the prototype electrodes buried at 0.5 m depth. Thus, the validation of the prototype installed in test site B was considered successful and we completed the set-up of the monitoring system by also calibrating and validating the weather station equipped with the abovementioned sensors.
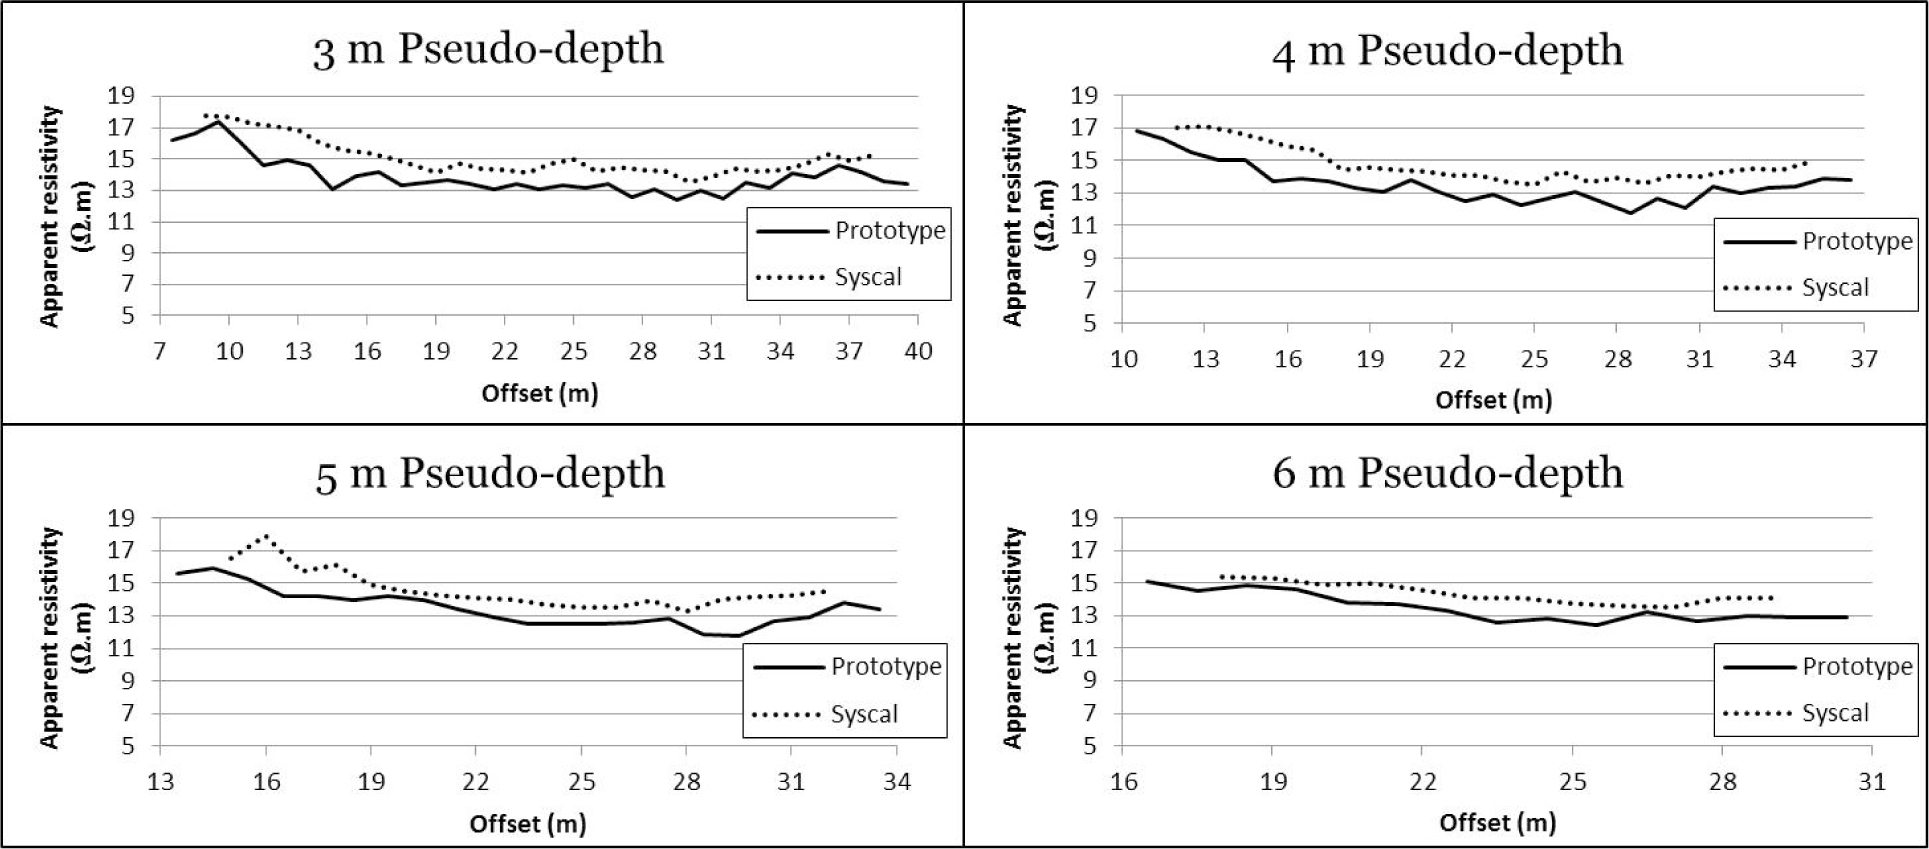
Comparison of apparent resistivity values measured at different pseudo-depths by the prototype and the commercial system on September 17, 2015.
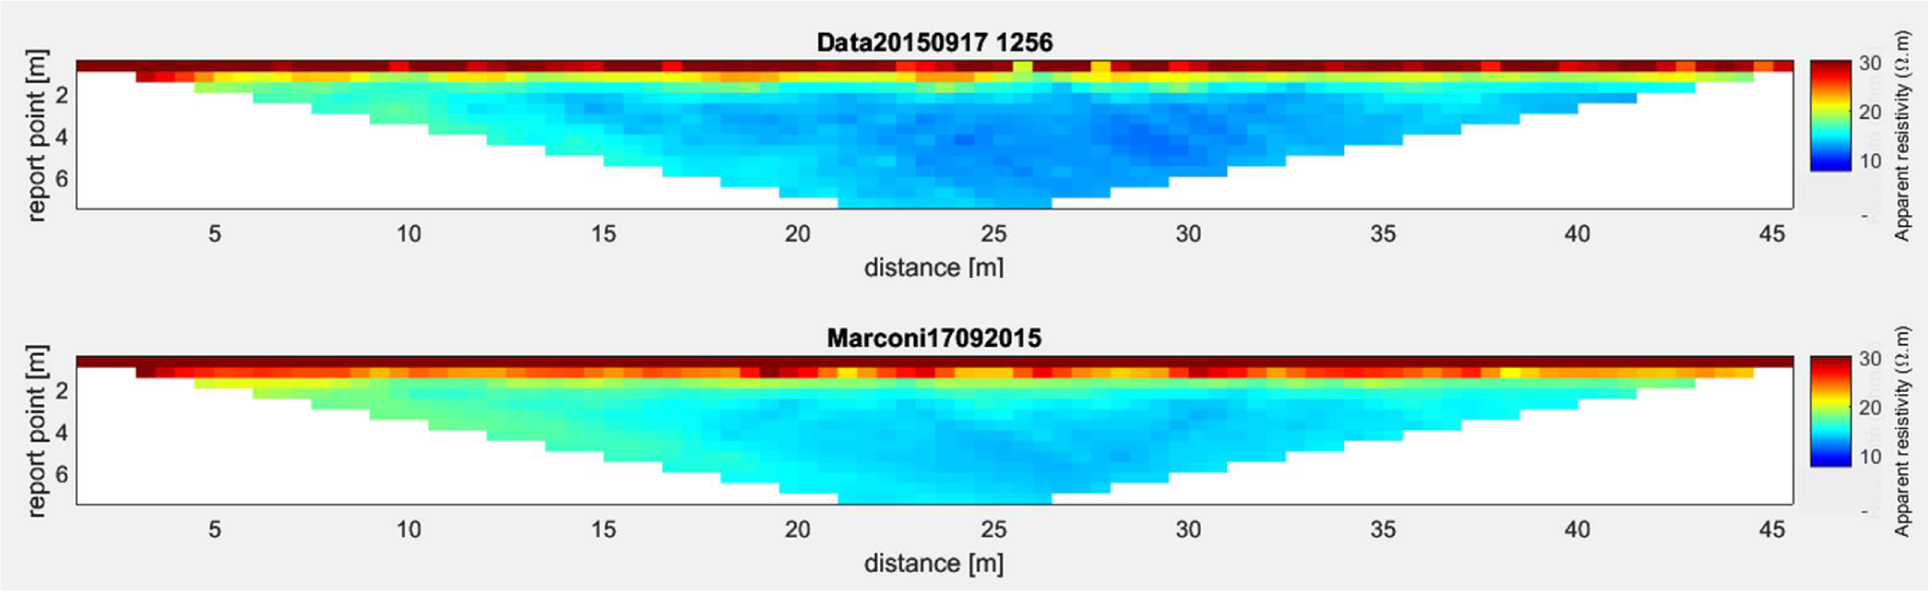
Apparent resistivity maps generated by the prototype (top) and the commercial system (bottom). The label “report point” of the vertical axis indicates the pseudo-depth of the measured resistivity and is proportional to the electrode distance.
3 Results and Discussion
The datasets obtained with the customized monitoring system during a few months have been analysed in order to produce preliminary interpretations and to study the correlation of the resistivity maps with water level variations in the canal and with other parameters such as rainfalls and temperature.
The reliability of the apparent resistivity maps daily generated by the prototype is supported by different grounds. First of all, measured values are found to be extremely stable and repeatable (within ±0.5 Ωm) when weather conditions are constant, i.e., absence of rainfalls and of sudden temperature variations. This is mainly due to the robustness of the Wenner configuration offering a high signal-to-noise ratio, and to the favourable requirements in terms of maximum depth of the investigation. Secondly, the parameters associated to the resistivity measurements reveal that with a maximum injected current of 200 mA (actually injected only to investigate the deepest layers) the measured voltages range between 40 and 145 mV. As a consequence, voltage readings can be considered very reliable since the prototype voltage sensitivity is 25 μV. Finally, daily logs report that percentage standard deviation values are always lower than 1%, this indicating that data are statistically reliable. Indeed, the equipment has been designed to adjust the injected current and to repeat each measurement until a sufficiently small standard deviation is obtained.
The deployment of the prototype took place at the end of the irrigation season so that the data of the following months monitor the progressive drying of the levee throughout autumn and winter, when the canal is practically empty. We interpreted the gradual increase in resistivity in the dyke, as well as below it, as the result of an ongoing drying process of the sand and clay mix that constitutes the local soil and that was also used to build the embankment. Emptying the channel network is usually a speedy process triggered by the managing authority during the first intense rainfall event at the end of the irrigation season to prevent any risk of flooding. The datasets confirm the slow drying process of the levee that starts immediately after the channel was drained and continues for several months. Figure 9 compares the apparent resistivity maps recorded in September, with channel half full but after five months of intense irrigation activity, and in November, after approximately two months the cannel was voided. Figure 9c is the difference between the November and the September maps and depicts a general increase in resistivity with the exception of the very shallow subsurface. The increase is more evident, up to 5 Ωm, within the levee structure, i.e. down to 3 m pseudo-depth, but a minor increase, up to 2 Ωm, is also observed underneath as a result of a probable slow drying of the sandy clay underneath the levee. According to historical time series of piezometers installed nearby test site B, the water table is normally 5-6 m below ground level so that the water content in the soil beneath and nearby the levee is mainly controlled by rainfalls and by the water level in the canal. Thus, a good correlation between resistivity values at 4-6 m pseudo-depth below the levee top surface and water level in the canal is not surprising. As already observed in the preliminary time-lapse measurements in site A (Figure 2), monitoring data confirm that the presence of the water mass in the canal does not directly affect the apparent resistivity maps. Abrupt water level decrease in the canal causes a delayed and smooth increase in apparent resistivity values (due to the levee getting dryer) rather than a sharp increase due to the absence of the water mass in the canal. The resistivity decrease, down to about 14 Ωm, for the shallower layer down to 1 m pseudo-depth, which is opposing to the usual increasing trend observed in Figure 9, is due to rainfalls (the weather station, recorded 20mm of rainfalls during November 21 and 22). This example demonstrates that rainfalls influence resistivity measurements down to about 1m depth, but they do not affect the saturation of the deeper layers of the levee where the drying process seems to be ongoing during autumn and winter. Of course, this preliminary conclusion needs to be corroborated by detailed analysis of other rainfall events, considering both frequency and magnitude.
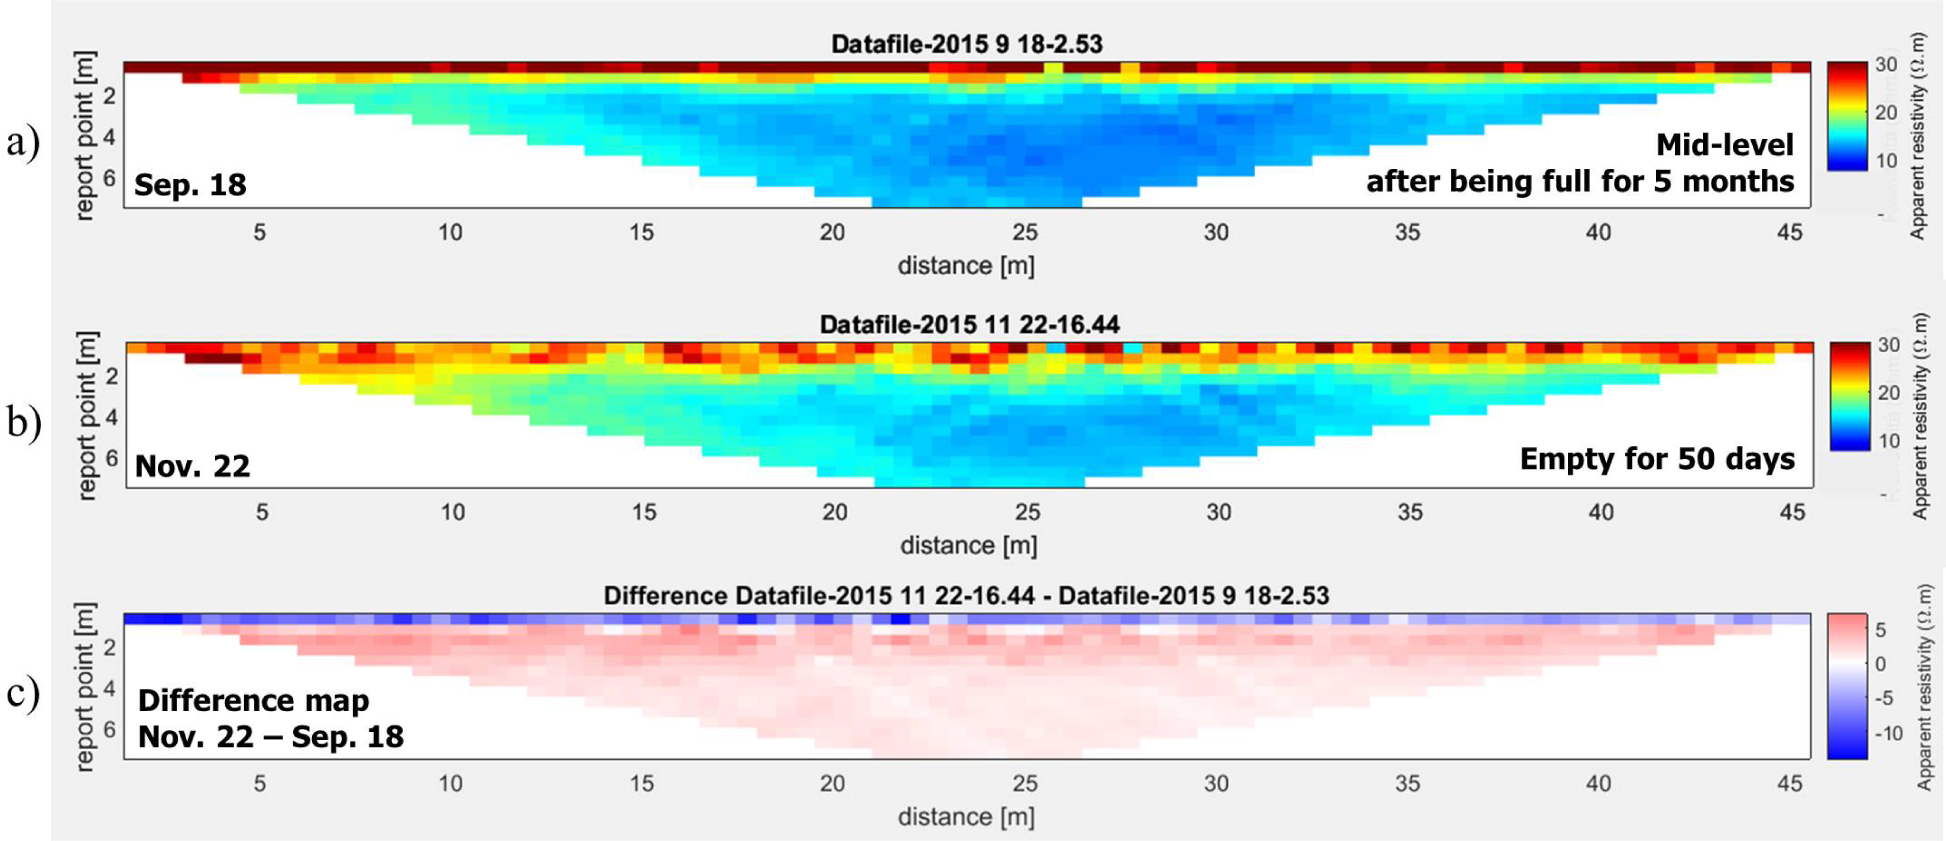
Comparison between apparent resistivity maps: (a) 18/09/15; (b) 22/11/15; (c) November 22 – September 18 difference map. The label “report point” of the vertical axis indicates the pseudo-depth of the measured resistivity and is proportional to the electrode distance.
To study the possible influence of temperature on the measured apparent resistivity values, we tried to analyse collected datasets in which the temperature effect could be isolated from resistivity variations induced by rainfalls and water level in the canal. Figure 10a and Figure 10b show resistivity measurements performed at the same time of the day on November 10 and 15, respectively. In between the two surveys neither rainfalls occurred nor water level in the channel changed, nonetheless a significant temperature drop from 17° C to 10° C was recorded. As expected from theory [42, 45], Figure 10c confirms that the higher the air temperature, the lower the soil resistivity, at least when the soil is not completely dry. However, according to the monitoring data, the resistivity difference below the shallower layer is negligible so that our preliminary conclusion is that temperature affects just the first upper meter while resistivity values measured at greater depths do not need to be corrected for temperature variations in order to be able to interpret with confidence the resistivity maps in terms of drying-saturation cycles occurring within the main body of the levee structure.
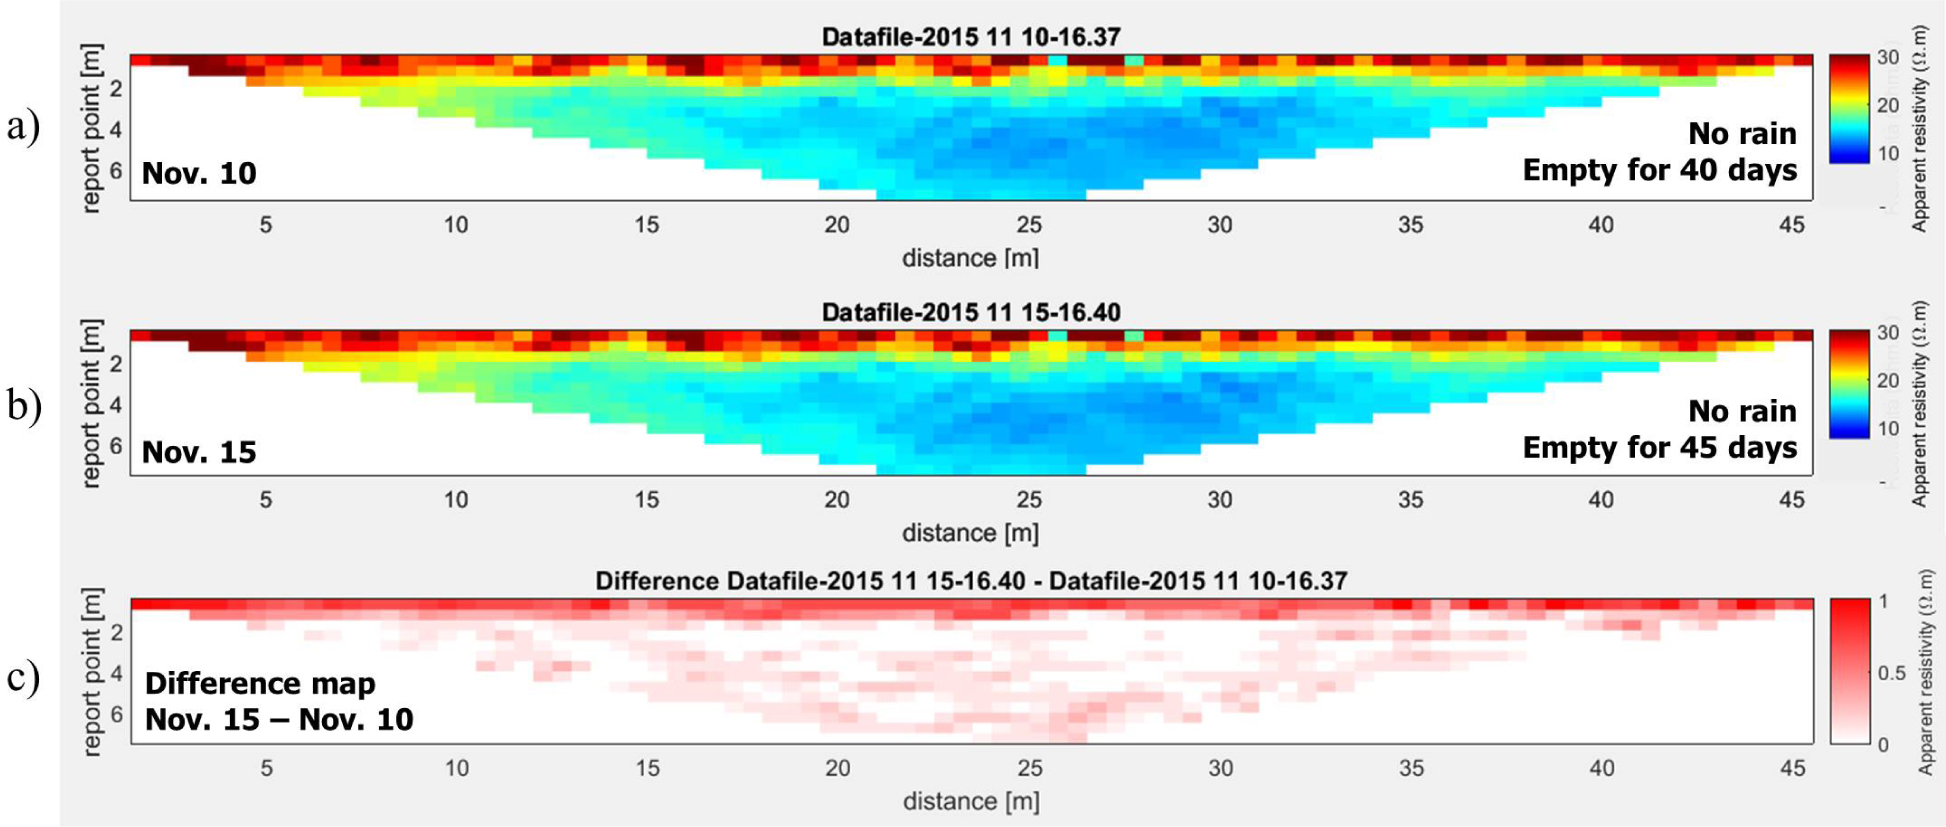
Comparison between apparent resistivity maps recorded before and after a 7 °C temperature drop: (a) 10/11/15; (b) 15/11/15; (c) November 15 – November 10 difference map. The label “report point” of the vertical axis indicates the pseudo-depth of the measured resistivity and is proportional to the electrode distance.
4 Conclusions
Preliminary time-lapse tests proved that ERT can be successfully applied for monitoring seepage phenomena occurring in earth structures such as levees or embankments and that this technique could be used as an early warning system along critical or strategic sections of channel networks.
A new prototype of resistivity meter was developed with specifications tailored to make the system costeffective and suitable for a permanent installation with a power supply system based on solar panels and with wireless remote control of data acquisition and transmission.
The prototype was installed in a test site affected by seepage and close to a group of houses, this increasing the consequences of a potential failure, and a commercial resistivity meter has been used to validate the newlydesigned monitoring system.
The preliminary analysis of the collected datasets shows that the resistivity maps seem to follow a very reasonable trend related with the saturation/drying cycle of the levee structure and of the basement of the levee caused by the seasonal variations of the water level in the irrigation channel. The response of the resistivity maps to sharp water level variations is delayed and smooth. The water mass in the canal is not directly affecting the measured resistivity values, i.e., no 3D lateral effects have been observed. Rainfalls and, to a lesser extent, temperature have some influence on the collected data but the effects are apparently negligible below 1 m depth.
The system is currently operating and results are continuously monitored. New data will be used to validate or to update our preliminary interpretations and conclusions.
Since the results are encouraging and consistent with the expectations, the research is still in progress and new calibration experiments are planned in order to transform the inverted resistivity maps into quantitative estimates of the soil water content. Our ultimate goal is to use these data as input for models that can predict levee structural stress conditions and instabilities.
Acknowledgement
The prototype monitoring system has been developed with the technical support of LSI-Lastem. The research was partially funded by Fondazione Cariplo, grant n° 2016-0785. The authors would like to thank Consorzio di Bonifica Terre dei Gonzaga in Destra Po for the collaboration and assistance in the field.
References
[1] Viegas G., Baig A., Coulter W., Urbancic T., Effective monitoring of reservoir-induced seismicity utilizing integrated surface and downhole seismic networks. First Break, 2012, 30, 77–8110.3997/1365-2397.30.7.60347Search in Google Scholar
[2] Warpinski N. R., Microseismic monitoring-The key is integration. The Lead. Edge, 2014, 33 (10), 1098-1100, 10.1190/tle33101098.1Search in Google Scholar
[3] Albaric J., Oye V., Kühn D., Microseismic Monitoring in Carbon Capture and Storage Projects, Extended abstract, Proceeding of Fourth EAGE CO2 Geological Storage Workshop, Stavanger, 2014, 10.3997/2214-4609.20140138Search in Google Scholar
[4] Spillmann T., Maurer H., Green A. G., Heincke B., Willenberg H., Husen S., Microseismic investigation of an unstable mountain slope in the Swiss Alps. J. of Geophys. Res., 2007, 112, B07301, 10.1029/2006JB004723Search in Google Scholar
[5] Walter M., Joswig M., Comprehensive mapping of landslide dynamics by nanoseismic monitoring. First Break, 2014, 32(8), 115-12110.3997/1365-2397.32.8.76971Search in Google Scholar
[6] Arosio D., Longoni L., Papini M., Scaioni M., Zanzi, L., Alba, M., Towards rockfall forecasting through observing deformations and listening to microseismic emissions. Nat. Hazards and Earth System Sci., 2009, 9, 1119-1131, ISSN 1561-863310.5194/nhess-9-1119-2009Search in Google Scholar
[7] Arosio D., Longoni L., Mazza F., Papini M., Zanzi L., Freeze-thaw cycle and rockfall monitoring. In: Margottini, C., Canuti, P., Sassa, K. (Eds), Landslide Science and Practice: Early warning, instrumentation and monitoring. Springer, Berlin, Germany, 2013, Volume 2, 385-390, ISBN 978-3-642-31444-5, 10.1007/978-3-642-31445-2Search in Google Scholar
[8] Arosio D., Longoni L., Papini M., Zanzi L., Analysis of microseismic activity within unstable rock slopes. In: Scaioni, M. (Ed), Modern Technologies for Landslide Monitoring and Prediction. Springer Natural Hazards, Berlin, Germany, 2015, 141-154, ISBN 978-3-662-45930-0, 10.1007/978-3-662-45931-7Search in Google Scholar
[9] Arosio D., Zanzi L., Longoni L., Papini M., Microseismic monitoring of an unstable rock face – Preliminary signal classification, Expanded abstract. Proceedings of Near Surface Geoscience, Torino, 2015, 5, ISBN 978-151081412-710.3997/2214-4609.201413667Search in Google Scholar
[10] Helmstetter A., Garambois S., Seismic monitoring of Séchilienne Rockslide (French Alps): analysis of seismic signals and their correlation with rainfalls. J. of Geophys. Res., 2010, 115, F0301610.1029/2009JF001532Search in Google Scholar
[11] Walter M., Schwaderer U., Joswig M., Seismic monitoring of precursory fracture signals from a destructive rockfall in the Vorarlberg Alps, Austria. Nat. Hazards and Earth System Sci., 2012, 12, 3545–3555, 105194/nhess-12-3545-2012Search in Google Scholar
[12] Hayley K., Bentley L. R., Gharibi M., Nightingale M., Low temperature dependence of electrical resistivity: Implications for near surface geophysical monitoring. Geophys. Res. Lett., 2007, 34, L18402, 10.1029/2007GL031124Search in Google Scholar
[13] Archie G. E., The electrical resistivity log as an aid in determining some reservoir characteristics. Pet. Transactions of AIME, 1942, 146, 54–62, 10.2118/942054-GSearch in Google Scholar
[14] De Vita P., Di Maio R., Piegari E., A study of the correlation between electrical resistivity and matric suction for unsaturated ash-fall pyroclastic soilsin the Campnia region (southern Italy). Environ. Earth Sci., 2012, 67(3), 787-798, 10.1007/S12665012-1531-4Search in Google Scholar
[15] Fukue M., Minatoa T., Horibe H., Taya N., The microstructure of clay given by resistivity measurements. Eng. Geol., 1999, 54, 43–53, 10.1016/S0013-7952(99)00060-5Search in Google Scholar
[16] McCarter W. J., The electrical resistivity characteristics of compacted clays. Géotechnique, 1984, 34(2), 263-267, 10.1680/geot.1984.32.2.263Search in Google Scholar
[17] Michot D., Benderitter Y., Dorigny A., Nicollaud B., King D., Tabbagh A., Spatial and temporal monitoring of soil water content with an irrigated corn crop cover using surface electrical resistivity tomography. Water Resour. Res., 2003, 39(5), 10.1029/2002WR001581Search in Google Scholar
[18] Muñoz-Castelblanco J. A., Pereira J. M., Delage P., Cui Y. J., The Influence of Changes in Water Content on the Electrical Resistivity of a Natural Unsaturated Loess. Geotech. Test. J., 2012, 35(1), 1-7, 1520/GTJ103587Search in Google Scholar
[19] Di Maio R., Piegari E., Water storage mapping of pyroclastic covers through electrical resistivity measurements. J. of Appl. Geophys., 2011, 75, 196-202, 10.1016/j.appgeo.2011.07.009Search in Google Scholar
[20] Niesner E., Subsurface resistivity changes and triggering influences detected by continuous geoelectrical monitoring. The Lead. Edge, 2010, 29(8), 952-955, 10.1190/1.3480008Search in Google Scholar
[21] Perrone A., Lapenna, V., Piscitelli S., Electrical resistivity tomography technique for landslide investigation: A review. Earth-Sci. Rev., 2014, 135, 65-82, 10.1016/j.earscirev.2014.04.002Search in Google Scholar
[22] Supper R., Römer A., Jochum B., Geoelectrical measurements for natural hazard monitoring. Proceedings of the 9th SEGJ International Symposium, Sapporo, Japan, 2009, 1-410.1190/segj092009-001.36Search in Google Scholar
[23] Supper R., Ottowitz D., Jochum B., Kim J.H, Römer A., Baron I., Pfeiler S., Lovisolo M., Gruber S., Vecchiotti F., Geoelectrical monitoring: An innovative method to supplement landslide surveillance and early warning. Near Surf. Geophys., 2014, 12(1), 133-150, 10.3997/1873-0604.2013060Search in Google Scholar
[24] Dahlin T., Bernstone C., Loke M. H., A 3D resistivity investigation of a contaminated site at Lernacken in Sweden. Geophys., 2002, 67(6), 1692-1700, 10.1190/1.1527070Search in Google Scholar
[25] Kirmizakis P., Soupios P., Simyrdanis K., Kirkou S., Papadopoulos N., Tsourlos P., Ntarlagiannis D., Robinson, J., Slater L. D., Kim J. H., Geoelectrical characterization of an olive oil mill waste (OOMW) site. Proceedings of Symposium on the Application of Geophysics to Engineering and Environmental Problems, Austin, Texas, 2015, 696-699, 10.1190/SAGEEP.28Search in Google Scholar
[26] Aina A., Olorunfemi M. O., Ojo J. S., An integration of aeromagnetic and electrical resistivity methods in dam site investigation. Geophys., 1996, 61(2), 349-356, 10.1190/1.1443963Search in Google Scholar
[27] Chambers J. E., Gunn D. A., Wilkinson P. B., Ogilvy R. D., Ghataora G. S., Burrow M. P. N., Tilden Smith R., Non-invasive time-lapse imaging of moisture content changes in earth embankments using electrical resistivity tomography (ERT). In: Ellis, Yu, McDowell, Dawson &Thom (Eds.), Advances in transportation geotechnics. British Geological Survey, Nottingham, England, 2008, 475-48010.1201/9780203885949.pt6Search in Google Scholar
[28] Daily W., Ramirez A., La Breque D., Nitao J., Electrical resistivity tomography of vadose water movement. Water Resour. Res., 1992, 28(5), 1429-1442, 10.1029/91WR03087Search in Google Scholar
[29] Di Maio R., Fabbrocino S., Forte G., Piegari E., A threedimensional hydrogeological-geophysical model of a multilayered aquifer in the coastal alluvial plain of Sarno River (southern Italy). Hydrogeol. J., 2014, 22, 691-703, 10.1007/s10040-013-1087-8Search in Google Scholar
[30] Leroux V., Dahlin T., Time-lapse resistivity investigations for imaging saltwater infiltration in glaciofluvial deposits. Environ. Geol., 2005, 49(3), 347-358, 10.1007/s00254-005-0070-7Search in Google Scholar
[31] Sandberg S. K., Slater L. D., Versteeg R., An integrated geophysical investigation of the hydrogeology of an isotropic unconfined aquifer. J. of Hydrol., 2002, 267(3-4), 227-243, 10.1016/S0022-1694(02)00153-1Search in Google Scholar
[32] Bergmann P., Schmidt-Hattenberger C., Kiessling D., Rücker C., Labitzke T., Henninges J., Baumann G., Schütt H., Surface-downhole electrical resistivity tomography applied to monitoring of CO2 storage at Ketzin, Germany. Geophys., 2012, 77(6), B253-B267, 10.1190/geo2011-0515.1Search in Google Scholar
[33] Hilbich C., Fuss C., Hauck C., Automated time-lapse ERT for improved process analysis and monitoring of frozen ground. Permafr. Periglac. Process., 2011, 22(4), 306-319, 10.1002/ppp.732Search in Google Scholar
[34] Kuras O., Pritchard J. D., Meldrum P. I., Chambers J. E., Wilkinson P. B., Ogilvy R. D., Wealthall G. P., Monitoring hydraulic processes with automated time-lapse electrical resistivity tomography (ALERT). Comptes Rendus Geosci., 2011, 341(10), 868-885, 10.1016/j.crte.2009.07.010Search in Google Scholar
[35] Supper R., Römer A., Kreuzer G., Jochum B., Ottowitz D., Ita A., Kauer S., The GEOMON 4D electrical monitoring system: current state and future developments. Instrumentation and data acquisition technology. Proceedings of GELMON 2011, Wien, Austria, 2011, 23-26, ISSN 1017 – 8880Search in Google Scholar
[36] Weller A., Lewis R., Tran C., Moller M., Scholz B., Geotechnical and Geophysical Long-term Monitoring at a Levee of Red River in Vietnam. J. of Environ. and Eng. Geophys., 2014, 19(3), 183–192, 10.2113/JEEG19.3.183Search in Google Scholar
[37] Chambers J. E., Meldrum P. L., Gunn D. A., Wilkinson P. B., Kuras O., Weller A. L., Ogilvy R. D, Hydrogeophysical monitoring of landslide processes using Automated time-Lapse Electrical Resistivity Tomography (ALERT). Proceedings of Near surface 2009 –15th European meeting of environmental and engineering geophysics, Dublin, Ireland, 200910.3997/2214-4609.20147066Search in Google Scholar
[38] Gallipoli M. R., Lapenna V., Lorenzo P., Mucciarelli M., Perrone A., Piscitelli S., Sdao F., Comparison of geological and geophysical prospecting techniques in the study of a landslide in southern Italy. Eur. J. Environ. Eng. Geophys., 2000, 4, 117-128Search in Google Scholar
[39] Godio A., Strobbia C., De Bacco G., Geophysical characterisation of a rockslide in alpine region. Eng. Geol., 2006, 83, 273-286, 10.1016/j.enggeo.2005.06.034Search in Google Scholar
[40] Jomard H., Lebourg T., Guglielmi Y., Tric E., Electrical imaging of sliding geometry and fluids associated with a deep seated landslide (La Clapière, France). Earth Surf. Process. Land., 2010, 35(5), 588-599, 10.1002/esp.1941Search in Google Scholar
[41] Longoni L., Papini M., Brambilla D., Barazzetti L., Roncoroni F., Scaioni M., Ivanov V.I., Monitoring riverbank erosion in mountain catchments using terrestrial laser scanning. Remote Sens., 2016, 8(3), 241, 10.3390/rs8030241Search in Google Scholar
[42] Frasheri A., Nishani P., Kapllani L., Xinxo E., Canga B., Dhima F., Seismic and geoeletric tomography surveys of dams in Albania. The Lead. Edge, 1999, 18(12), 1384-1388, 10.1190/1.1438222Search in Google Scholar
[43] Cardarelli E., Cercato M., De Donno G,. Characterization of an earth-filled dam through the combined use of electrical resistivity tomography, P-and SH-wave seismic tomography and surface wave data. J. of Appl. Geophys., 2014, 106, 87-95, 10.1016/j.jappgeo.2014.04.007Search in Google Scholar
[44] Cardarelli E., Cercato M., Di Filippo G., Geophysical investigation for the rehabilitation of a flood control embankment. Near Surf. Geophys., 2010, 8, 287-296, 10.3997/18730604.2010018Search in Google Scholar
[45] Kim J.-H., Yi M.-J., Song Y., Seol S.J. and Kim K.-S., Application of geophysical methods to the safety analysis of an earth dam. J. of Environ. and Eng. Geophys., 2007, 12(2), 221-235, 10.2113/JEEG12.2.221Search in Google Scholar
[46] Cho I. K., Yeom J. Y., Crossline resistivity tomography for the delineation of anomalous seepage pathways in an embankment dam. Geophysics, 2007, 72(2), G31-G38, 10.1190/1.2435200Search in Google Scholar
[47] Besson A., Cousin I., Dorigny A., Dabas M., King D., The temperature correction for the electrical resistivity measurements in undisturbed soil samples: Analysis of the existing conversion models and proposal of a new model. Soil Sci., 2008, 173(10), 707–720, 10.1097/SS.0b013e318189397fSearch in Google Scholar
[48] Corwin D. L., Lesch S. M., Apparent soil electrical conductivity measurements in agriculture. Computers and Electron. in Agric., 2005, 46, 11–43, 10.1016/j.compag.2004.10.005Search in Google Scholar
[49] Durlesser H., Bestimmung der Variation bodenphysikalischer Parameter in Raum und Zeit mit elektromagnetischen Induktionsverfahren (Determination of the spatial and temporal variability of physical soil parameters using electromagnetic induction). Stuttgart: Shaker Verlag 1999 (in German)Search in Google Scholar
[50] Hayashi M., Temperature-electrical conductivity relation of water for environmental monitoring and geophysical data inversion. Environ. Monit. Assess., 2004, 96, 119–128, 10.1023/B:EMAS.0000031719.83065.68Search in Google Scholar
[51] Lück E., Rühlmann J., Spangenberg U., Physical background of soil EC mapping: Laboratory, theoretical and field studies. In: J. V. Stafford (Ed.), Precision agriculture’05, Wageningen Academic Publishers, Wageningen, Netherlands, 2005, 417–424Search in Google Scholar
[52] Rhoades J. D., Chanduvi F.; Lesch S., Soil salinity assessment: Methods and interpretation of electrical conductivity measurements. FAO Irrigation and Drainage Paper 1999, 57, 100-150Search in Google Scholar
[53] Sheets K. R., Hendrickx J. M. H., Non-invasive soil water content measurement using electromagnetic induction. Water Resour. Res., 1995, 31, 2401–2409, 10.1029/95WR01949Search in Google Scholar
[54] Li L., Li H., Xiang B., Qin B., Influence of Precipitation on the Determination of Proper Time for Soil Resistivity Measurement. J. of Meteorol. Res., 2009, 24(2), 259-268Search in Google Scholar
© 2017 Diego Arosio et al.
This work is licensed under the Creative Commons Attribution-NonCommercial-NoDerivatives 3.0 License.
Articles in the same Issue
- Regular Articles
- Two types of gabbroic xenoliths from rhyolite dominated Niijima volcano, northern part of Izu-Bonin arc: petrological and geochemical constraints
- Regular Articles
- CRSP, numerical results for an electrical resistivity array to detect underground cavities
- Regular Articles
- Magma evolution inside the 1631 Vesuvius magma chamber and eruption triggering
- Regular Articles
- Probabilities of Earthquake Occurrences along the Sumatra-Andaman Subduction Zone
- Regular Articles
- Modelling of carrying capacity in National Park - Fruška Gora (Serbia) case study
- Regular Articles
- Knickzone Extraction Tool (KET) – A new ArcGIS toolset for automatic extraction of knickzones from a DEM based on multi-scale stream gradients
- Regular Articles
- When the display matters: A multifaceted perspective on 3D geovisualizations
- Regular Articles
- Dependence of Gully Networks on Faults and Lineaments Networks, Case Study from Hronska Pahorkatina Hill Land
- Regular Articles
- Environmental Geochemistry of Geophagic Materials from Free State Province in South Africa
- Regular Articles
- Neotectonic interpretations and PS-InSAR monitoring of crustal deformations in the Fujian area of China
- Regular Articles
- Dual-shale-content method for total organic carbon content evaluation from wireline logs in organic shale
- Regular Articles
- The dolerite dyke swarm of Mongo, Guéra Massif (Chad, Central Africa): Geological setting, petrography and geochemistry
- Regular Articles
- Seismic data filtering using non-local means algorithm based on structure tensor
- Regular Articles
- Pore Distribution Characteristics of the Igneous Reservoirs in the Eastern Sag of the Liaohe Depression
- Regular Articles
- Three-dimensional structural model of the Qaidam basin: Implications for crustal shortening and growth of the northeast Tibet
- Regular Articles
- Failure Mode of the Water-filled Fractures under Hydraulic Pressure in Karst Tunnels
- Regular Articles
- Creating a low carbon tourism community by public cognition, intention and behaviour change analysisa case study of a heritage site (Tianshan Tianchi, China)
- Regular Articles
- Mapping Mangrove Density from Rapideye Data in Central America
- Regular Articles
- Marine sediment cores database for the Mediterranean Basin: a tool for past climatic and environmental studies
- Regular Articles
- Retrofitting the Low Impact Development Practices into Developed Urban areas Including Barriers and Potential Solution
- Regular Articles
- Spatial uncertainty of a geoid undulation model in Guayaquil, Ecuador
- Regular Articles
- Structure and Filling Characteristics of Paleokarst Reservoirs in the Northern Tarim Basin, Revealed by Outcrop, Core and Borehole Images
- Regular Articles
- Ground volume assessment using ’Structure from Motion’ photogrammetry with a smartphone and a compact camera
- Regular Articles
- Classification of coal seam outburst hazards and evaluation of the importance of influencing factors
- Regular Articles
- Geochemical characterization of Neogene sediments from onshore West Baram Delta Province, Sarawak: paleoenvironment, source input and thermal maturity
- Regular Articles
- Influence of Social-economic Activities on Air Pollutants in Beijing, China
- Regular Articles
- Spectral properties of weathered and fresh rock surfaces in the Xiemisitai metallogenic belt, NW Xinjiang, China
- Regular Articles
- Geochemistry of sandstones and shales from the Ecca Group, Karoo Supergroup, in the Eastern Cape Province of South Africa: Implications for provenance, weathering and tectonic setting
- Regular Articles
- Petrology and geochemistry of meta-ultramafic rocks in the Paleozoic Granjeno Schist, northeastern Mexico: Remnants of Pangaea ocean floor
- Regular Articles
- Distal turbidite fan/lobe succession of the Late Oligocene Zuberec Fm. – architecture and hierarchy (Central Western Carpathians, Orava–Podhale basin)
- Regular Articles
- Fourier Transform Infrared Spectroscopy of Clay Size Fraction of Cretaceous-Tertiary Kaolins in the Douala Sub-Basin, Cameroon
- Regular Articles
- Optimized AVHRR land surface temperature downscaling method for local scale observations: case study for the coastal area of the Gulf of Gdańsk
- Regular Articles
- New non-linear model of groundwater recharge: Inclusion of memory, heterogeneity and visco-elasticity
- Regular Articles
- “Urban geosites” as an alternative geotourism destination - evidence from Belgrade
- Regular Articles
- A customized resistivity system for monitoring saturation and seepage in earthen levees: installation and validation
- Regular Articles
- Consideration of Landsat-8 Spectral Band Combination in Typical Mediterranean Forest Classification in Halkidiki, Greece
- Regular Articles
- Coda Wave Attenuation Characteristics for North Anatolian Fault Zone, Turkey
- Regular Articles
- Modal composition and tectonic provenance of the sandstones of Ecca Group, Karoo Supergroup in the Eastern Cape Province, South Africa
- Regular Articles
- Quantitative studies of the morphology of the south Poland using Relief Index (RI)
- Regular Articles
- Interpretation of sedimentological processes of coarse-grained deposits applying a novel combined cluster and discriminant analysis
- Regular Articles
- Utilizing borehole electrical images to interpret lithofacies of fan-delta: A case study of Lower Triassic Baikouquan Formation in Mahu Depression, Junggar Basin, China
- Regular Articles
- Grain size statistics and depositional pattern of the Ecca Group sandstones, Karoo Supergroup in the Eastern Cape Province, South Africa
- Regular Articles
- Carbonate stable isotope constraints on sources of arsenic contamination in Neogene tufas and travertines of Attica, Greece
- Regular Articles
- Appreciation of landscape aesthetic values in Slovakia assessed by social media photographs
- Regular Articles
- Geochemistry of Selected Kaolins from Cameroon and Nigeria
- Regular Articles
- Spatial pattern of ASG-EUPOS sites
- Regular Articles
- A Stream Tilling Approach to Surface Area Estimation for Large Scale Spatial Data in a Shared Memory System
- Regular Articles
- A location-based multiple point statistics method: modelling the reservoir with non-stationary characteristics
- Regular Articles
- Water Inrush Analysis of the Longmen Mountain Tunnel Based on a 3D Simulation of the Discrete Fracture Network
- Regular Articles
- A Computer Program for Practical Semivariogram Modeling and Ordinary Kriging: A Case Study of Porosity Distribution in an Oil Field
- Regular Articles
- Imaging and locating paleo-channels using geophysical data from meandering system of the Mun River, Khorat Plateau, Northeastern Thailand
- Regular Articles
- Rare earth element contents of the Lusi mud: An attempt to identify the environmental origin of the hot mudflow in East Java – Indonesia
- Regular Articles
- Is Nigeria losing its natural vegetation and landscape? Assessing the landuse-landcover change trajectories and effects in Onitsha using remote sensing and GIS
- Regular Articles
- Methodological approach for the estimation of a new velocity model for continental Ecuador