Election Advertising on Meta, Google, and Snapchat in 2024
-
Erika Franklin Fowler

 ,
Breeze Floyd
,
Meiqing Zhang
,
Yujin Kim
,
Travis N. Ridout
,
Pavel Oleinikov
and
Michael M. Franz
,
Breeze Floyd
,
Meiqing Zhang
,
Yujin Kim
,
Travis N. Ridout
,
Pavel Oleinikov
and
Michael M. Franz

Abstract
We analyze digital advertising by candidates in federal races (presidential and congressional campaigns) in the 2024 U.S. general election cycle. We focus on election ads placed on Meta (which includes Instagram and Facebook) and Google (which includes YouTube, search, display and banner), and we provide some spending numbers from Snapchat advertising. We consider variation in ad spending across Meta and Google to get a sense not only of how digital spending stacks up across both venues but also to compare spending to television and radio. Beyond spending, we consider the content (including tone, goal, and issue focus) of Meta ads and Google video ads and compare it to television. All told, the analysis in this paper represents a first-cut look at the information environment in digital advertising sponsored by candidates in 2024 federal races during the general election period.
1 Introduction
At one time, the bulk of a political campaign’s outreach strategy – for president, Congress or statewide office – was devoted to television. But in recent years, that has changed, and digital advertising has become a much more important component of a campaign’s advertising effort. In fact, research in the United States, based on an analysis of Federal Election Commission filings, suggests that digital spending in federal races rose from $43 million in the 2004 election cycle to $2.4 billion in the 2020 election cycle (Sheingate, Scharf and Delahanty 2022).[1]
The increased importance of advertising on digital and social media platforms makes sense given some of the advantages it can provide. First, it can be targeted to much more specific geographic areas than broadcast television ads, which are distributed to entire media markets. Thus, in media markets that do not align well with state boundaries, many viewers of television ads are not able to vote for the candidates advertised. Ads on local cable television can be targeted to more narrow geographic areas than broadcast television ads, but cable ads are still more broadly targeted than many campaigns might like. At the same time, digital ads can be targeted at individuals who fit certain demographic profiles and have certain online behaviors and interests. In many ways, then, digital advertising is much more efficient than television advertising (Fowler et al. 2021a, 2021b).
A second advantage of digital advertising is that it can help campaigns pursue a multiplicity of goals. Not only can digital ads be used for persuasion – the almost sole goal of television advertising – but many digital ads are aimed at fundraising, acquiring contact information about prospective voters and volunteers, and mobilizing potential voters to attend rallies and show up at their polling place on Election Day. A growing literature in political science has identified and tracked the many different goals of political ads on the growing number of online venues (Ronzhyn, Cardenal, and Batlle Rubio 2023; Ballard, Hillygus, and Konitzer 2016).
Given the importance of digital advertising to political campaigns today, we analyzed digital advertising by candidates in federal races (presidential and congressional campaigns) in the 2024 U.S. election cycle. We focus on election ads placed on Meta (which includes Instagram and Facebook) and Google (which includes YouTube, search, display and banner ads), and we provide some spending numbers from Snapchat advertising as well. Recent analysis, which looked at Meta and Google properties, suggests that political advertising on both platforms in the 2023–24 election cycle surpassed $1.3 billion of spending on ads up and down the ballot, including policy-related ads.[2] This figure excludes political ad spending by sponsors who spent less than $5,000 on both platforms, as well as a host of other digital platforms (such as ads delivered to viewers through streaming applications like Paramount+ and Hulu), but it does provide a useful benchmark for comparison to spending by candidates and across cycles.
In this analysis, and aside from the presidential race, we focus primarily on spending by federal candidates (including party coordinated spending where it exists) on Meta and Google, leaving more comprehensive analysis of party and outside group spending online to future work. In looking at candidates, we consider variation in ad spending across Meta and Google to get a sense not only of how digital spending stacks up across both venues but also to compare spending to television and radio. While federal candidates are clearly turning to digital platforms for ad spending (with Google accounting for a slightly higher share of spending), we find that radio and television still account for the bulk of media spending (though that varies across campaigns). We then turn to the goal of digital advertising: for example, just how important is fundraising online relative to other goals? Finally, we consider the content of digital advertising, examining both the tone of digital advertising – how negative is it? – and the issues covered by the campaigns. Given the ability to target digital ads precisely, we find an issue agenda online that is somewhat different than the campaigns’ issue agenda on television, though in general digital ads seem to contain far fewer references to policies than television ads.
All told, the analysis in this paper represents a first-cut look at the information environment in digital advertising in 2024 federal races, building on prior work after the 2020 and 2022 elections (Fowler et al. 2023; Ridout, Fowler, and Franz 2021a). As campaigns diversify their outreach to voters beyond traditional television, it is critical that scholars consider this spending and compare it to efforts on more traditional venues (Ridout et al. 2024). While television still dominates federal ad spending, this will not always be the case, especially as voters migrate away from live (a.k.a. linear) television in favor of increasingly diverse digital and online outlets.
2 Data Source and Processing
In this research, we primarily examine the spending and content of advertising on Meta (which includes Instagram and Facebook) and Google (which includes YouTube, search, display and banner) by general election candidates in federal races (including coordinated spending between candidates and parties). For Google, we consider all available spending by federal candidates but only analyze YouTube content. We obtain data from Meta’s Ad Library Report (https://www.facebook.com/ads/library) and Google Ads Transparency Center (https://transparencyreport.google.com/political-ads). For Meta’s digital spending totals, we examine each page name and disclaimer combination from the platform’s aggregate reports (Meta Ad Library Report) that include daily spending (the platform also has weekly, 30- and 90-day aggregations). For Google’s spending totals, we use weekly reports from the platform’s Transparency Report, which show Sunday to Saturday totals every week. We also supplement totals from these two platforms with spending by federal candidates on Snapchat (https://www.snap.com/political-ads).[3] Finally, we compare data from these platforms to broadcast TV ad data from Vivvix/CMAG, a media intelligence firm, which is available to us through the Wesleyan Media Project (for more details see Ridout, Fowler, and Franz 2025).
To identify digital spending activity by federal candidates, we rely on a 2024 candidate list from the Federal Election Commission with updates from OpenSecrets and the Wesleyan Media Project. We search aggregate reports from each platform (and the Meta Ad Library API) using keywords that include candidate names and generic terms such as “senate,” “senator,” “congress,” and “house of representatives” to identify and match candidates to their respective advertising. We also conducted a systematic assessment of top spenders to ensure that we did not miss candidate pages. The Facebook API provides ad metadata such as the range of spending at the ad level along with ad impressions, region distribution, and demographic distribution for both Instagram and Facebook. We include all ads from pages and entities (page ID and funding disclaimer pairings) that have been identified through the process described above, and we filter this collection to include all ads as long as they were running between September 3, 2024, and November 5, 2024. We call this the general election period as almost all states had held their primaries for House and Senate races by then.
In order to identify Google ads that were active during the general election period, we used the “Creative Stats” table that is posted by Google as part of its Ad Transparency Report, which reports when the ad was active. We included the ads whose activity date range overlapped with the September 3 to November 5 date range. We also downloaded the Snapchat data from 2023 to 2024, identifying ads sponsored by candidates in the presidential and congressional races. For all platforms, we collapse coordinated spending (where a candidate jointly sponsors advertising with their party) with candidate spending and include both spending and content from coordinated advertising in the candidate analysis below (and in comparable television figures).
Beyond spending information, we also examined ad content of both Meta and Google ads (only videos, primarily from YouTube, for the latter[4]). We collected text fields from the Meta API, which include page name, disclaimer, ad creative body, ad creative link caption, ad creative link title, and ad creative link description. For Google, we used the ad metadata posted on the Transparency Report webpage to identify videos that were served through YouTube. We then downloaded the closed caption text of the ads that were served as YouTube Videos. We obtain the transcription of scraped ad audio via Google’s speech-to-text API (enhanced “video” model) and the overlaid text to images and videos via the Optical Character Recognition (OCR) with Google Cloud vision API.
Using this textual information, we are able to detect candidate mentions, from which we can calculate national politician mentions and traditional ad tone; we also use the text to classify the goal of the ad along with specific issues. To detect which candidates and national politicians are mentioned, we built a curated knowledge base of candidates and other major figures, including their descriptions, and trained a custom named entity recognition model that identifies political figures from the knowledge base in unseen text. We apply the custom named entity recognition model[5] to each text field of an ad available through the API, as well as its transcript created through automatic speech recognition (ASR).
Ad tone is determined on the basis of who is mentioned or pictured in an ad (excluding the page name and funding entity disclaimer fields and/or the oral approval line in video ads). If an ad mentions or pictures only the sponsoring candidate, it is coded as “Promote.” If it mentions or pictures only their opponent, it is coded as “Attack.” If it mentions or pictures both, it is coded as “Contrast.” Mentions are determined through the earlier step of political entity recognition. Candidate appearances in image or video ads are captured by facial recognition technology (we used the Amazon Rekognition service for image and video analysis[6]). For Meta and Google ads, we supplemented our analysis with a simple keyword search, looking for variations such as ‘kamala’ or ‘kamla’ (generated by ASR) to identify references to Harris.
We infer ad goals from classifiers trained on manually coded 2022 and 2020 Meta election ads.[7] We trained three binary random forest classifiers for three main ad goals: voter persuasion (precision = 0.87, recall = 0.93, F1-score = 0.90), fundraising (precision = 0.97, recall = 0.93, F1-score = 0.95), and get-out-the-vote (precision = 0.78, recall = 0.63, F1-score = 0.70). A primary goal is assigned to each ad based on the ad goal with the highest predicted probability across the three classifiers. We focus on these three goals because other known ad goals, such as polling, gathering voters’ information, event advertising, and merchandise sales are rare based on our exploratory analysis and previous research (Ridout et al. 2024).
Finally, we also generate predictions for 25 issues that might be mentioned in the ad text using a multilabel classification model. This model was trained with PyTorch and Hugging Face’s DistilBERT (Sanh et al. 2020) on manually coded television campaign advertising data, Meta’s general election advertising data, and Google’s general election advertising data in 2022.[8] We selected issues with reasonable F1 scores for analysis.
Among these issues, we focused on those that are prominent in television ads, including generic references to the economy (precision = 0.72, recall = 0.73, F1-score = 0.73), taxes (precision = 0.94, recall = 0.90, F1-score = 0.92), employment and jobs (precision = 0.80, recall = 0.82, F1-score = 0.81), cost of living (precision = 0.81, recall = 0.81, F1-score = 0.81), immigration (precision = 0.88; recall = 0.90, F1-score = 0.89), abortion (precision = 0.91, recall = 0.95, F1-score = 0.93), health care (precision = 0.72, recall = 0.55, F1-score = 0.63) and Medicare (precision = 0.84, recall = 1.00, F1-score = 0.91). For the economy, we combined four issue codes: the general economy, taxes, employment and jobs, and cost of living (and then we do the same for the TV comparison). Similarly, for health care, we consolidated general mentions of healthcare with standalone mentions of Medicare. In addition to the topics in our standard issue battery, we also searched for references to transgender issues, democracy, and Project 2025 – three topics that featured prominently in the general election – using a keywords-based approach.[9]
3 2024 Election Advertising Across Platforms and Campaigns
We start with a broad overview of spending on Meta, Google, and Snapchat for the full cycle and for the general election (defined as July 22 until Election Day in the presidential race and September 3rd to Election Day for congressional races).[10] These totals are shown in Table 1. All told, back to January 2023, we identified over $578 million in candidate and party coordinated spending on Meta, Google, and Snapchat. Notably, these totals exclude spending on behalf of federal candidates by outside groups, but we estimate the $569 million from candidates on Meta and Google comprise 72 % of all federal spending on the two platforms.[11]
Digital spending by Democratic and Republican general election candidates.
| Since Jan ’23 (In Ms) | Since July 22 (for presidential election only) (In Ms) | General election (Sept 3rd to election daya) (In Ms) | ||
|---|---|---|---|---|
| U.S. House | Meta | $23.5 | $9.3 | |
| $30.2 | $22.8 | |||
| Snapchat | $0.192 | $0.063 | ||
| Total | $53.9 | $32.2 | ||
|
|
||||
| U.S. Senate | Meta | $33.9 | $11.0 | |
| $67.0 | $38.3 | |||
| Snapchat | $1.04 | $0.234 | ||
| Total | $102.0 | $49.5 | ||
|
|
||||
| President | Meta | $196.4 | $148.02 | $103.5 |
| $217.5 | $170.1 | $100.8 | ||
| Snapchat | $8.98 | $7.6 | $4.7 | |
| Total | $422.8 | $325.7 | $209.1 | |
|
|
||||
| Total federal | $578.8 | $290.8 | ||
-
Source: Meta Ad Library Report, Google Ads Transparency Center, and Snap Political and Advocacy Ads Library with analysis by the Wesleyan Media Project. aTotals for Meta and Snapchat are through November 5, 2024, and totals for Google are through November 9, 2024.
The bulk of spending on Meta and Google by candidates was in the presidential race, where there was over $420 million in ad spending on the three platforms across the entire election cycle. There was $102 million in candidate spending in Senate races on the three platforms, with $101 million of that on Meta and Google, which is an increase over the $95.8 million identified in the 2022 midterm cycle (Fowler et al. 2023). U.S. House candidate spending was very steady with $53.9 million overall, and the Meta and Google total of $53.8 million in 2024 is the same amount as in the full 2021–2022 cycle (Fowler et al. 2023).
In the presidential race between July 22 and Election Day, there was nearly $326 million in spending on the three platforms, and indeed the bulk of the full cycle spending in the presidential race was after July 22. Finally, the fall, post-Labor Day general election period (the rightmost column in Table 1) featured about half of the congressional and presidential spending for the full cycle ($291 million of $579 million).
Although presidential spending on digital ads was high in 2024, the Trump campaign was less engaged on Meta and Google than in 2020. Trump spent $276 million on these platforms in 2020 (See Table 3 in Ridout, Fowler, and Franz 2021a) but only $89 million in 2024, with the bulk of that on Google. Trump also spent less on Snapchat in 2024 than in 2020: $62,000 versus $200,000 four years prior (Neumann et al. 2020). This may have been the consequence of a shift to other advertising venues, such as ads on streaming platforms, but we also know from other research (Ridout, Fowler, and Franz 2025) that his campaign was far more competitive with the Democrats on broadcast television advertising than he was in 2016 or 2020. While Trump built a reputation after the 2016 campaign of bucking traditional TV ads in favor of tweets and online engagement, his 2024 media campaign relied comparatively more on live television spots, something we discuss in more detail below. Biden spent $212.6 million on Meta and Google in the 2019–2020 cycle, which compares to $325 million spent between Biden and Harris in the 2023–2024 presidential cycle.
Presidential spending by supportive groups (Pro-Harris or Pro-Trump).
| Sponsor | Party lean | Meta (7/22/24–11/05/24) (In Ms) | Google (7/21/24–11/09/24) (In Ms) | Snapchat (7/22/24–11/05/24) (In Ms) |
|---|---|---|---|---|
| FF PAC | Dem | $7.9 | $64.6 | $2.1 |
| Project Freedom LLC | Dem | – | – | – |
| AB PAC | Dem | $2.2 | $4.1 | – |
| Republican Accountability PAC | Dem | $0.164 | $6.0 | – |
| Democracyfirst | Dem | $0.889 | $0.111 | – |
| One for All Committee | Dem | $1.7 | – | – |
| Somos Votantesa | Dem | $0.06 | $0.77 | – |
| Anti-psychopath PAC inc. | Dem | – | $0.007 | – |
| Untd Assoc of Union Plumbers & Pipefitters | Dem | – | – | – |
|
|
||||
| Make America Great Again Inc. | Rep | – | $11.8 | – |
| Preserve America PAC | Rep | $2.0 | $15.2 | – |
| Right for America | Rep | $2.2 | $4.4 | – |
| Restoration PAC | Rep | $0.289 | $0.851 | $0.147 |
| Dan Newlin Injury Attorneys | Rep | $0.020 | – | – |
| RJC Victory Fund | Rep | – | $0.133 | – |
| America PAC | Rep | $4.7 | $2.7 | – |
| MAHA Alliance | Rep | $0.839 | – | – |
| Majority PAC | Rep | – | – | – |
| RBG PAC | Rep | $1.1 | $3.4 | – |
-
Source: Meta Ad Library Report, Google Ads Transparency Center, and Snap Political and Advocacy Ads Library. Included groups are those that spent on television ads supporting Harris or Trump. The only exception is RBG PAC. aWe include Somos PAC and jointly sponsored ads with Priorities USA Action in the Somos Votantes line.
Top 10 Meta and Google candidate spenders in U.S. Senate races.
| Full cycle | Sept to Election Daya | |||||
|---|---|---|---|---|---|---|
| Party | State | Meta (Ms) | Google (Ms) | Meta (Ms) | Google (Ms) | |
| Allred, Colin | Dem | TX | $4.43 | $12.70 | $1.85 | $7.90 |
| Brown, Sherrod | Dem | OH | $3.28 | $7.07 | $0.93 | $3.49 |
| Gallego, Ruben | Dem | AZ | $3.91 | $5.12 | $1.02 | $2.18 |
| Baldwin, Tammy | Dem | WI | $0.77 | $5.79 | $0.27 | $2.79 |
| Schiff, Adam | Dem | CA | $4.10 | $2.26 | $0.21 | $0.02 |
| Tester, R. Jon | Dem | MT | $1.66 | $4.66 | $0.74 | $2.65 |
| Casey, Robert P. Jr. | Dem | PA | $1.19 | $4.58 | $0.79 | $2.70 |
| Slotkin, Elissa | Dem | MI | $2.25 | $2.64 | $0.78 | $1.28 |
| Cruz, Ted | Rep | TX | $1.67 | $2.89 | $0.53 | $2.27 |
| Mucarsel-Powell, Debbie | Dem | FL | $2.42 | $1.75 | $0.86 | $1.18 |
| Rosen, Jacky | Dem | NV | $0.20 | $2.65 | $0.09 | $1.38 |
| Kunce, Lucas | Dem | MO | $2.16 | $0.51 | $0.76 | $0.30 |
-
Source: Meta Ad Library Report and Google Ads Transparency Center.aTotals for Meta are through November 5, 2024, and totals for Google are through November 9, 2024.
Looking across platforms, Snapchat totals are very low in comparison to Google and Meta, but notably $9 million was committed to Snapchat by presidential candidates in the full cycle. Google spending generally exceeded spending on Meta, though much more so for Senate candidates who spent $67 million on Google compared to $33 million on Meta. In comparison, in the fall general election race between Harris and Trump, nearly even amounts (aggregating over both candidates’ spending) were spent on Google and Meta.
How does spending on Meta and Google compare to spending on radio and television, including local broadcast, local cable, national broadcast and cable? Figure 1 shows that Trump spent $260 million on television and radio ads compared to $72 million on Meta and Google during the July 22 to Election Day period. That means Trump devoted 78 % of his ad spending in Figure 1 to television and radio. Harris, by contrast, sponsored $338 million in television and radio ads along with $246 million in Meta/Google ads, meaning 58 % of her media spending went to television and radio.
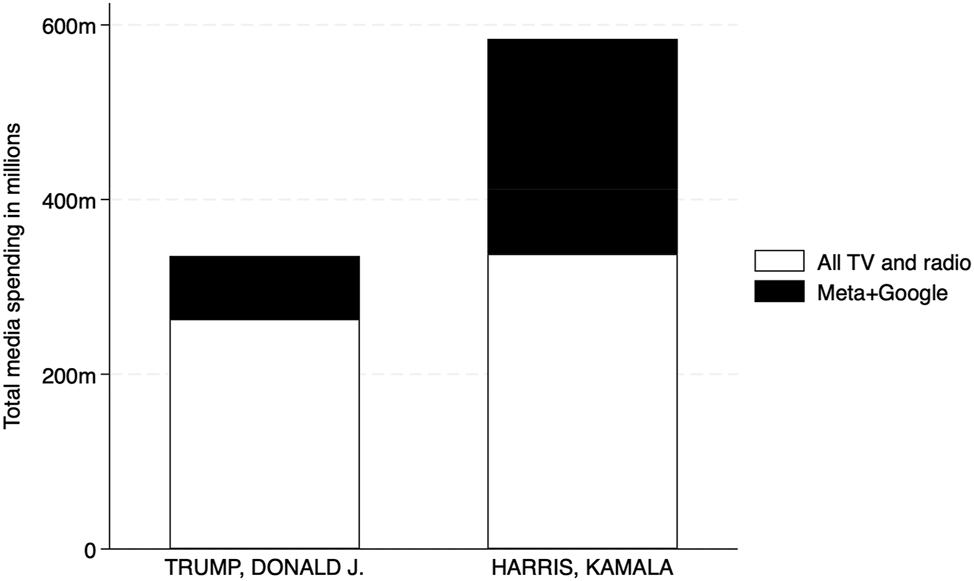
Media spending in Presidential races (July 22 to Election Day). Source: Vivvix/CMAG for TV and radio spending, as well as the Meta Ad Library Report and Google Ads Transparency Center for digital spending. Notes: Only spending from the candidates (or in coordination with party committees) is included.
One challenge in getting a complete picture of federal spending on digital platforms is that the ad libraries do not require outside groups to tag mentions of federal candidates. Knowing that digital ads serve many goals for ad sponsors, including list-building and fund-raising, not every ad by an outside group can be assumed to concern a federal race. Our approach to this problem has been to search for all large television ad sponsors in the online repositories and to apply named entity recognition to a large universe of ads that we believe might be relevant to federal races. This approach is ongoing as of this writing, which limits what we can say about outside group spending in the 2024 election. Nonetheless, we know that many outside groups spent on election-related television ads in support of Harris or Trump (Ridout, Fowler, and Franz 2025). As such, we show in Table 2 the spending on Meta and Google by outside groups that were also active on television with ads supporting or opposing Harris or Trump. We add to this list one group, RBG PAC, even though they did not air any television ads because the group, bankrolled by Elon Musk, was covered in many media reports before the election.
Some of the groups in Table 2 did not appear in the Meta and Google Ad Libraries as sponsoring ads in the period after July 22. These include Project Freedom LLC, the plumbers and pipefitters union, and Majority PAC. Somos Votantes also did not appear; however, Somos PAC ran advertising alone and in coordination with Priorities USA Action, which we include in the table. Project Freedom LLC spent nearly $29 million on TV and radio ads for Harris in the covered time period, and the other three groups each spent about $1 million (Ridout, Fowler, and Franz 2025). The other groups in Table 2, 15 in total, combined to spend over $140 million in digital advertising, including over $74 million from FF PAC (on behalf of Harris) and $17 million from Preserve America PAC (on behalf of Trump).
We next consider spending in congressional races. In Table 3, we show digital ad spending by the top 10 Senate candidate spenders in the full election cycle. (We also show spending in the fall general election period.) Colin Allred spent over $17 million on Meta and Google, the most of any Senate candidate, with significantly greater sums devoted to Google. Of the top 10 candidates in Senate races, nine of them are Democrats. In general, except for a few candidates, such as Adam Schiff in California, spending on Google exceeded spending on Meta.
In Table 4, we show spending by the top 20 House candidates and indicate whether the candidate was running in a competitive race. We define a race as competitive according to the Cook Political Report, particularly those assigned as a “toss-up” or ones that “lean” to the Democrat or Republican. Because digital ads serve many goals, including fund-raising, it is not a surprise to see a candidate like Alexandria Ocasio-Cortez (running in a safe seat) spending significant sums on digital ads. In her case, the reliance on Meta ads over YouTube ads suggests that her ads were likely intended to raise money. As we show below for presidential candidates, Meta ads are far more likely to be fundraising ads than YouTube ads purchased through Google. Of the top 20 candidates, 13 were in competitive races and 7 were not.
Top 20 Meta and Google candidate spenders in U.S. House races.
| Full cycle | Sept to elec daya | ||||||
|---|---|---|---|---|---|---|---|
| Party | District | Meta (Ms) | Google (Ms) | Meta (Ms) | Google (Ms) | Compet race | |
| Vindman, Eugene | Dem | VA-07 | $1.86 | $1.69 | $0.36 | $0.86 | Yes |
| Ocasio-Cortez, Alexandria | Dem | NY-14 | $3.05 | $0.08 | $0.44 | $0.01 | No |
| Tran, Derek | Dem | CA-45 | $0.21 | $1.25 | $0.18 | $1.20 | Yes |
| Tranel, Monica | Dem | MT-01 | $0.95 | $0.38 | $0.28 | $0.28 | Yes |
| Min, Dave | Dem | CA-47 | $0.31 | $1.00 | $0.19 | $0.65 | Yes |
| Omar, Ilhan | Dem | MN-05 | $1.13 | $0.17 | $0.05 | $0.01 | No |
| Frisch, Adam | Dem | CO-03 | $0.61 | $0.63 | $0.05 | $0.53 | No |
| Vargas, Tony | Dem | NE-02 | $0.15 | $1.05 | $0.13 | $0.90 | Yes |
| Rollins, Will | Dem | CA-41 | $0.49 | $0.58 | $0.25 | $0.45 | Yes |
| Liccardo, Sam T. | Dem | CA-09 | $0.18 | $0.73 | $0.10 | $0.63 | No |
| Jeffries, Hakeem | Dem | NY-08 | $0.78 | $0.01 | $0.08 | $0.00 | No |
| Kidd, Greg | Ind | NV-02 | $0.21 | $0.44 | $0.15 | $0.27 | Yes |
| Cooke, Rebecca | Dem | WI-03 | $0.35 | $0.26 | $0.13 | $0.17 | Yes |
| Ryan, Patrick | Dem | NY-18 | $0.21 | $0.38 | $0.19 | $0.38 | Yes |
| Bohannan, Christina | Dem | IA-01 | $0.05 | $0.51 | $0.02 | $0.44 | Yes |
| Gluesenkamp Perez, Marie | Dem | WA-03 | $0.06 | $0.51 | $0.05 | $0.32 | Yes |
| Wild, Susan | Dem | PA-07 | $0.29 | $0.26 | $0.22 | $0.18 | Yes |
| Calvarese, Trisha | Dem | CO-04 | $0.45 | $0.09 | $0.24 | $0.09 | No |
| Peltola, Mary | Dem | AK-01 | $0.25 | $0.28 | $0.14 | $0.21 | Yes |
| Subramanyam, Suhas | Dem | VA-10 | $0.14 | $0.38 | $0.03 | $0.20 | No |
-
Source: Meta Ad Library Report and Google Ads Transparency Center. aTotals for Meta are through November 5, 2024, and totals for Google are through November 9, 2024.
We also considered whether levels of spending on Meta and Google increased or decreased between 2022 and 2024. We examine this in two ways, displayed in Figure 2. First, we show boxplots of spending for the period between early September and Election Day across all identified congressional candidates for Meta and Google. A box plot shows the range of spending between the 25th and 75th percentile of the candidates included in our data. For Google, the interquartile range of spending increased between 2022 and 2024, but it decreased slightly for Meta. Congressional candidates, on average, spent $65,000 on Google in 2022 and $114,000 in 2024. Median spending on Google also increased, from $1,600 in 2022 to $3,350 in 2024. (For candidates spending anything on Google, the median increased from $20,000 to $42,000.) For Meta, the mean declined slightly, from $40,500 in 2022 to $38,700 in 2024, and the median declined from $7,851 to $5,400. This analysis shows that many federal candidates are devoting very small amounts to these platforms, with a subset of candidates spending far larger sums, as we demonstrated in our tables above.
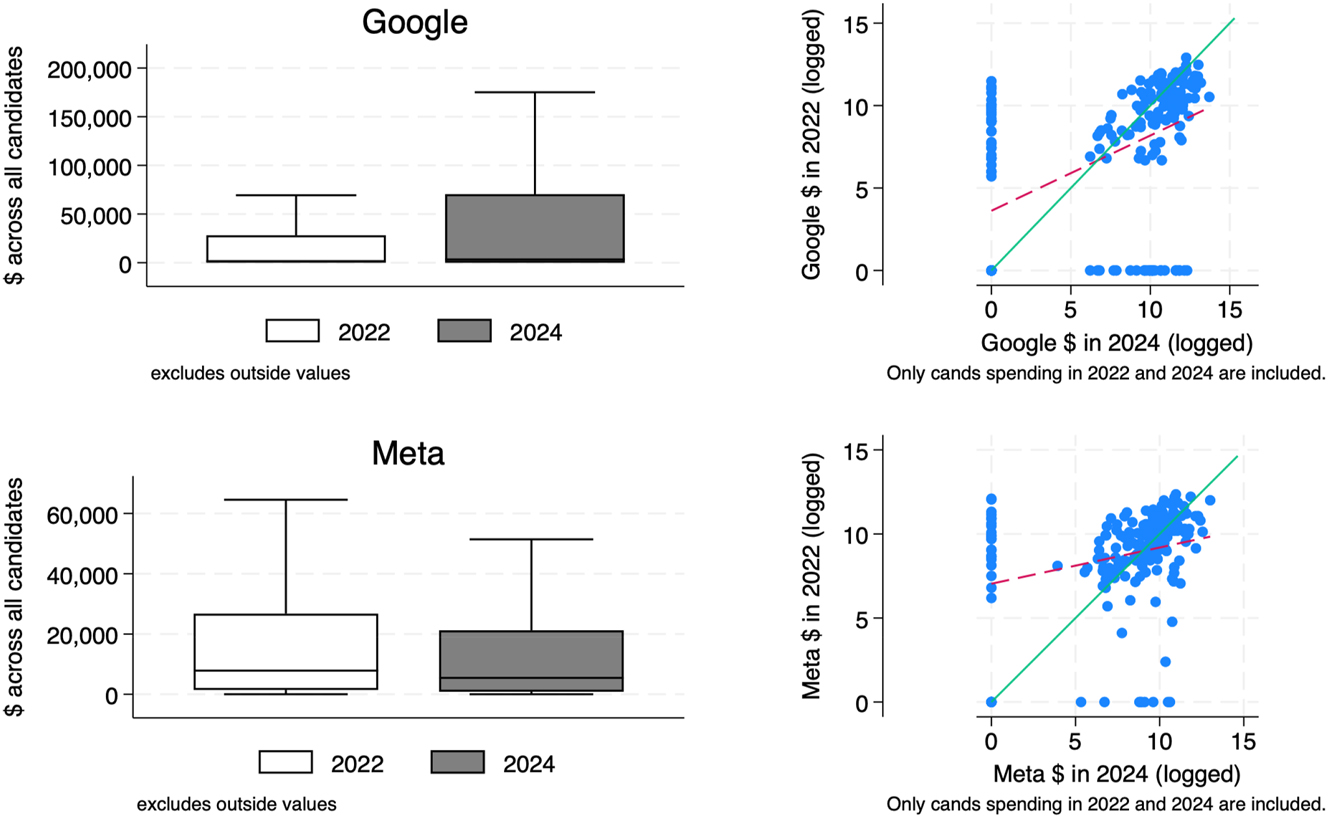
Spending on Meta and Google in 2022 and 2024 (All congressional candidates). Source: Meta Ad Library Report and Google Ads Transparency Center. Notes: For the period between September 3 and election day. Totals for Meta are through November 5, 2024, and totals for Google are through November 9, 2024. Only spending from the candidates (or in coordination with party committees) is included. For the analysis of the relationship between spending in 2022 and 2024 on the right panel, red dashed lines represent the bivariate regression’s fit, and solid green lines represent the line of y = x.
A second way to examine change is to look within-candidate, by comparing spending for candidates active in both years. This is generally for winning candidates in 2022 and is largely restricted to House candidates given that Senate candidates, with their six-year terms, are rarely active in successive cycles. These spending comparisons are shown in the right two panels of Figure 2. We log-transform spending to make the comparisons more visible across an otherwise heavily skewed distribution of spending. For both Google and Meta, there is a strong positive relationship between spending in 2022 and spending in 2024, though a fair number of candidates spent larger sums in one cycle. Moreover, because the intercept passes above 0 on the fitted bivariate regression line and the slope inclines towards 2024 spending, we know that candidates, on average, spent more in 2024 than they did in the previous cycle.
In prior work on digital spending in congressional races in 2022, we showed that Democratic candidates spent more than Republicans in the fall general election period (Fowler et al. 2023). This appears to be the case also in 2024, given the tables above that showed digital ad spending by the top Senate and House candidates. Both lists were dominated by Democrats. For a more systematic assessment, though, we compare Democratic versus Republican spending by race in 2024 in Figures 3 and 4. The first comparison is for Senate candidates, and as in 2022, Democrats vastly outspent Republicans, especially in some of the most competitive races, such as in Ohio, Montana, Pennsylvania, and Wisconsin.
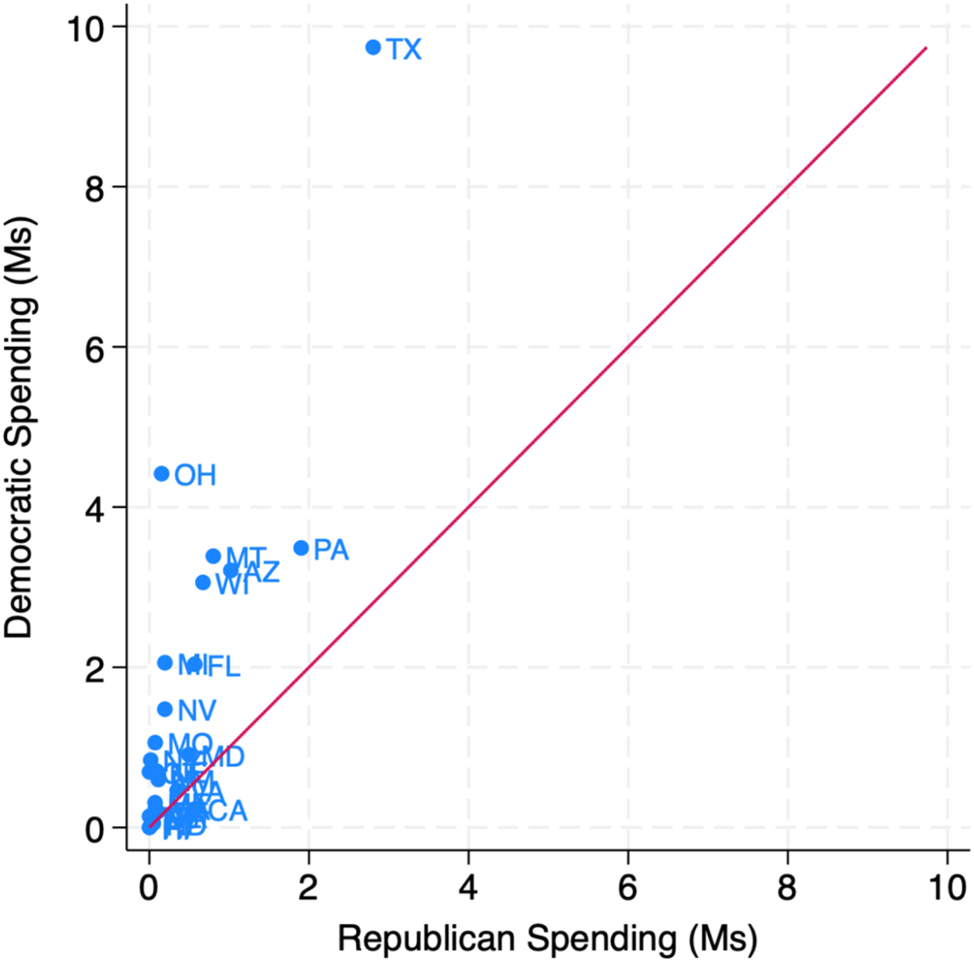
Spending on Meta and Google in U.S. Senate races by Democratic and Republican candidates (General election candidates only). Source: The Meta Ad Library Report and Google Ads Transparency Center. Notes: Figures are from the period between September 3 and Election Day. Only spending from the candidates (or in coordination with party committees) is included.
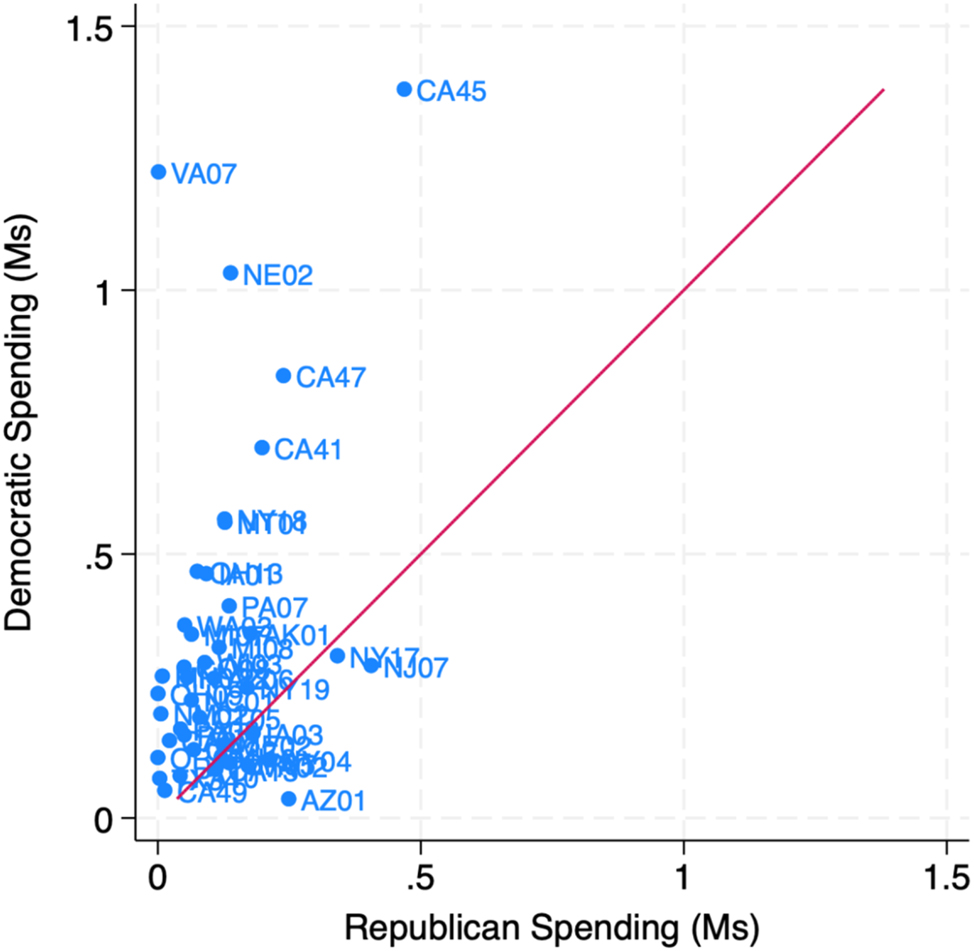
Spending on Meta and Google in competitive U.S. House races by Democratic and Republican candidates (General election candidates only). Source: The Meta Ad Library Report and Google Ads Transparency Center. Notes: Figures are from the period between September 3 and Election Day. Only spending from the candidates (or in coordination with party committees) is included, for seats rated by Cook Political Report as “toss-up” or “lean Democrat” or “lean Republican”.
In Figure 4, we look at U.S. House races, focusing on the most competitive races, particularly (as above) those rated by Cook Political Report as “toss-up” or those that “lean” to the Democrat or Republican. Here, too, nearly all of the high-spending races featured more digital spending from Democrats than from Republicans.
As with our analysis of Harris and Trump spending, we also considered all general election candidates in Senate races and in competitive House races, totaling ad spending on Meta and Google along with ad spending for television and radio ads. In Figures 5 and 6, we rank the candidates by total ad spending and shade the amount devoted to Meta and Google ads. By and large, TV and radio spending dominate. Even Senate candidate Colin Allred spent over $24 million for TV and radio ads, a necessity to reach voters across the large state of Texas. As a general matter, TV ads are more expensive, and the price per impression is surely lower for digital ads. As such, comparing dollars for TV versus digital is partially apples-to-oranges. Nonetheless, it is notable that traditional advertising continues to be incredibly important to congressional campaigns. It is also worth re-stating, in light of these findings, the importance Kamala Harris placed on digital ads, as it made up 42 % of her media spending; see Figure 1.
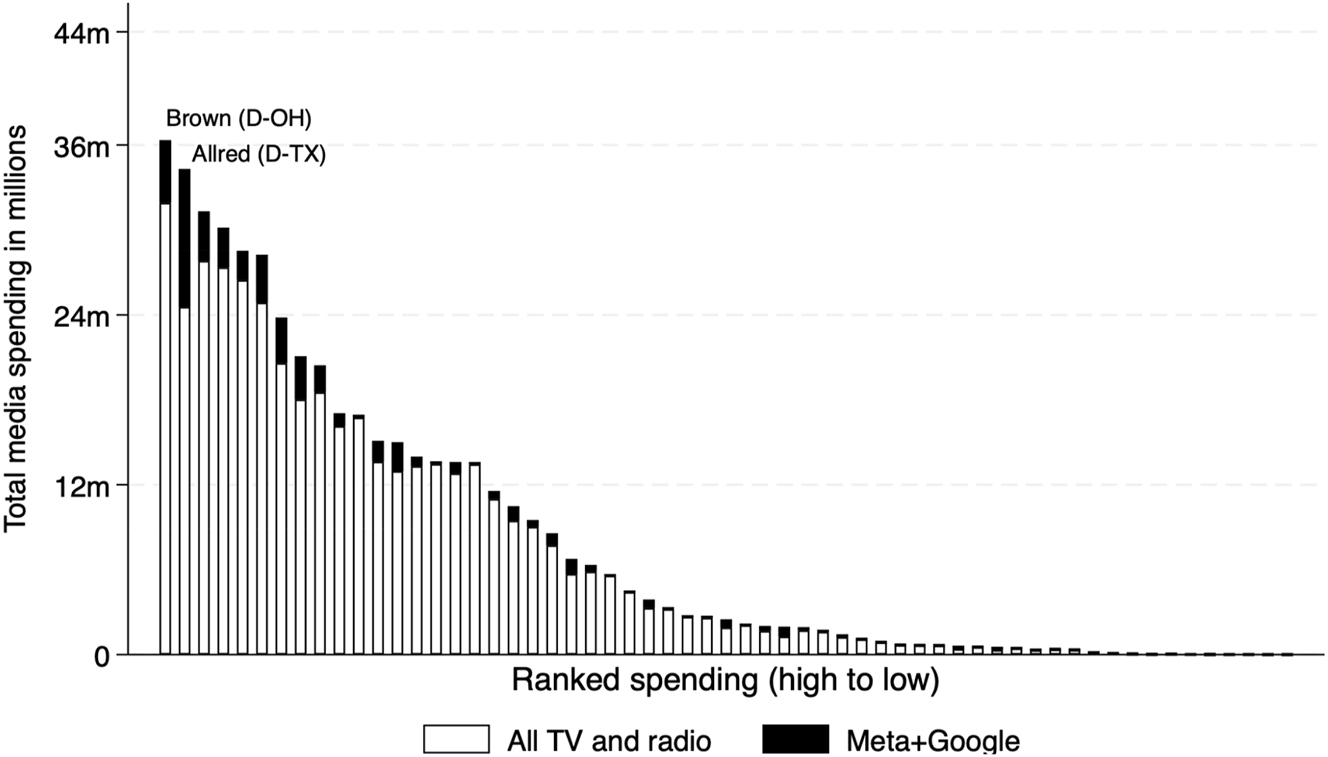
Media spending in U.S. Senate races (General election candidates only). Source: Vivvix/CMAG for TV and radio spending, and the Meta Ad Library Report and Google Ads Transparency Center for digital spending. Notes: Figures are from the period between September 3 and Election Day. Only spending from the candidates (or in coordination with party committees) is included.
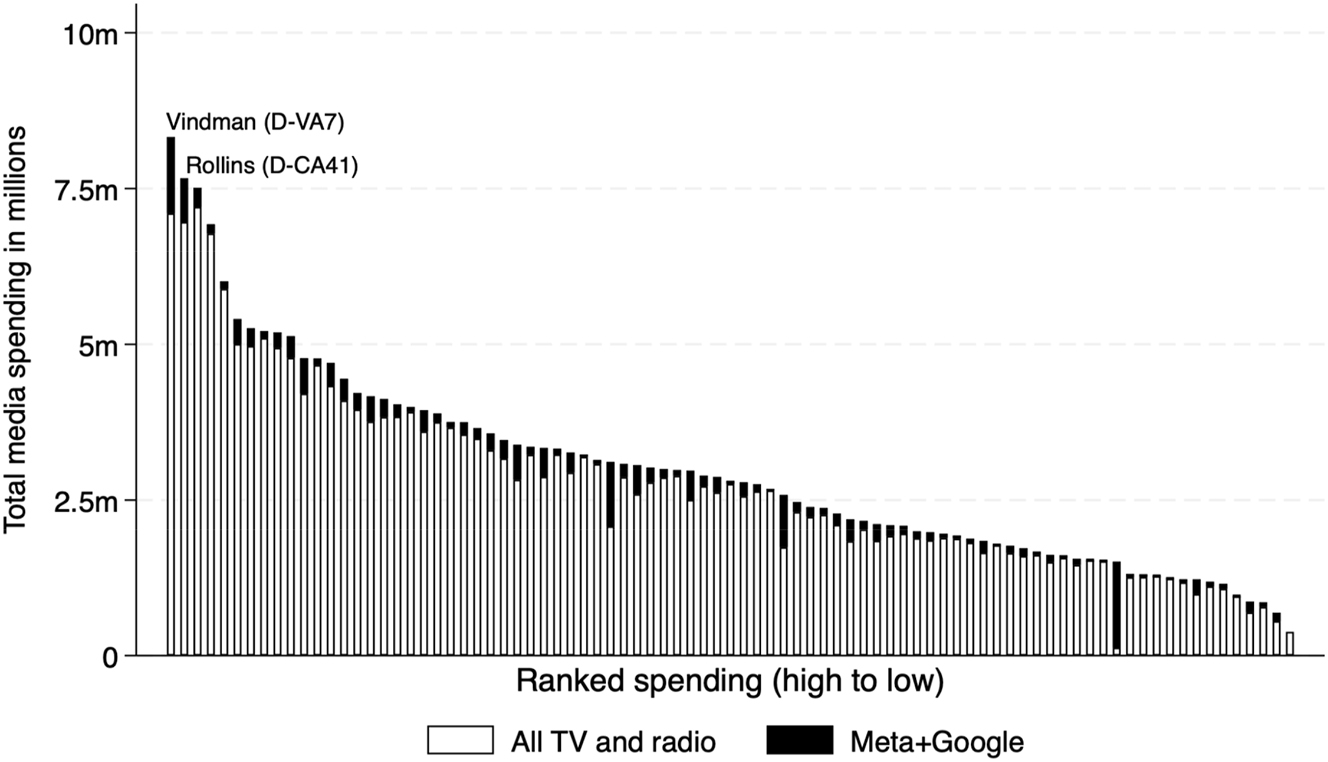
Media spending in competitive U.S. House races (General election candidates only). Source: Vivvix/CMAG for TV and radio spending, and the Meta Ad Library Report and Google Ads Transparency Center for digital spending. Notes: Figures are from the period between September 3 and Election Day. Only spending from the candidates (or in coordination with party committees) is included, for seats rated by Cook Political Report as “toss-up” or “lean Democrat” or “lean Republican”. Each bar is a candidate.
The same is true for competitive House candidates (Figure 6). Non-trivial spending on Meta and Google is apparent for many candidates, but here too TV and radio dominate. One notable exception is a House candidate on the right side of the bar plot. That candidate is Derek Tran in CA-45. He (and in coordination with Dems) spent $125 K on broadcast and satellite TV ads, but $1.4 million on Meta/Google ads.
4 Fundraising, Persuasion, and the Goals of Political Ads
Political advertising on television traditionally focuses on voter persuasion (Fowler, Franz, and Ridout 2021a, 2021b). The versatility of digital platforms, including their targeting capabilities and diverse formats, allows campaigns to pursue a wider range of goals. Beyond voter persuasion, digital political campaigns are utilized for fundraising, base mobilization, campaign recruitment, polling and soliciting information from voters (Ballard, Hillygus, and Konitzer 2016; Ridout, Fowler, and Franz 2021b; Ridout et al. 2024). Fundraising is a particularly common appeal for online political advertising (Ballard, Hillygus, and Konitzer 2016; Ridout et al. 2024).
The presidential campaign on Meta’s platforms during the 2024 general election offers further evidence of this pattern. Kamala Harris and Donald Trump both dedicated a substantial portion of their digital campaigns to fundraising on Meta’s platforms (see Table 5). The Trump campaign prioritized mobilizing his base in the ramp-up stage, with the leading share spent on get-out-the-vote (GOTV) efforts. However, both campaigns prioritized persuasion on YouTube. This makes sense given that YouTube, as a video sharing platform, shares more similarities with television as an advertising medium.
Percentage of digital ad spending on voter persuasion, fundraising and GOTV in presidential race.
| Voter persuasion % | Fundraising % | GOTV % | ||
|---|---|---|---|---|
| Meta Facebook & Instagram | Kamala Harris | 46.5 | 41.0 | 12.6 |
| Donald Trump | 13.0 | 38.4 | 48.6 | |
| Google video (primarily YouTube) | Kamala Harris | 90.3 | 0.8 | 8.9 |
| Donald Trump | 97.6 | 2.1 | 0.3 |
-
Source: Meta Ad Library and Google Ads Transparency Center with analysis by the Wesleyan Media Project. Percentages are weighted by spending on Meta platforms (Facebook and Instagram) and video ad spending on Google (we exclude other Google advertising for assessing content). Only ads active from September 3 through Election Day are analyzed.
The ability of campaigns to geographically target their digital political ads enables campaigns to tailor their goals across regions. In 2022, there was an inverse relationship between spending on in-state ads and fundraising ads among the highest spending candidates; as a candidate’s proportion of in-state spending increased, the proportion of their fundraising ads decreased (Fowler et al. 2023). This implies congressional candidates who focus on running digital fundraising campaigns primarily appeal to potential out-of-state donors. The pattern is also evident in 2024. (To be clear, this analysis does not look at ads on Google, which – if we expect them to be disproportionately more focused on persuasion – should be highly targeted to in-state viewers.) Figure 7 displays the percentages of in-state and fundraising ads among the top 20 U.S. Senate candidates during the general election period of 2024, sorted by the percentage of spending on in-state ads focused on constituents of the senator rather than out-of-state audiences. The gray triangles represent the percentage of ads seen by in-state audiences, weighted by spending. The salmon-colored scatters represent the percentage of ads focused on fundraising in each candidate’s campaign. The column on the right denotes each candidate’s total spending on Meta’s platforms (Facebook and Instagram).
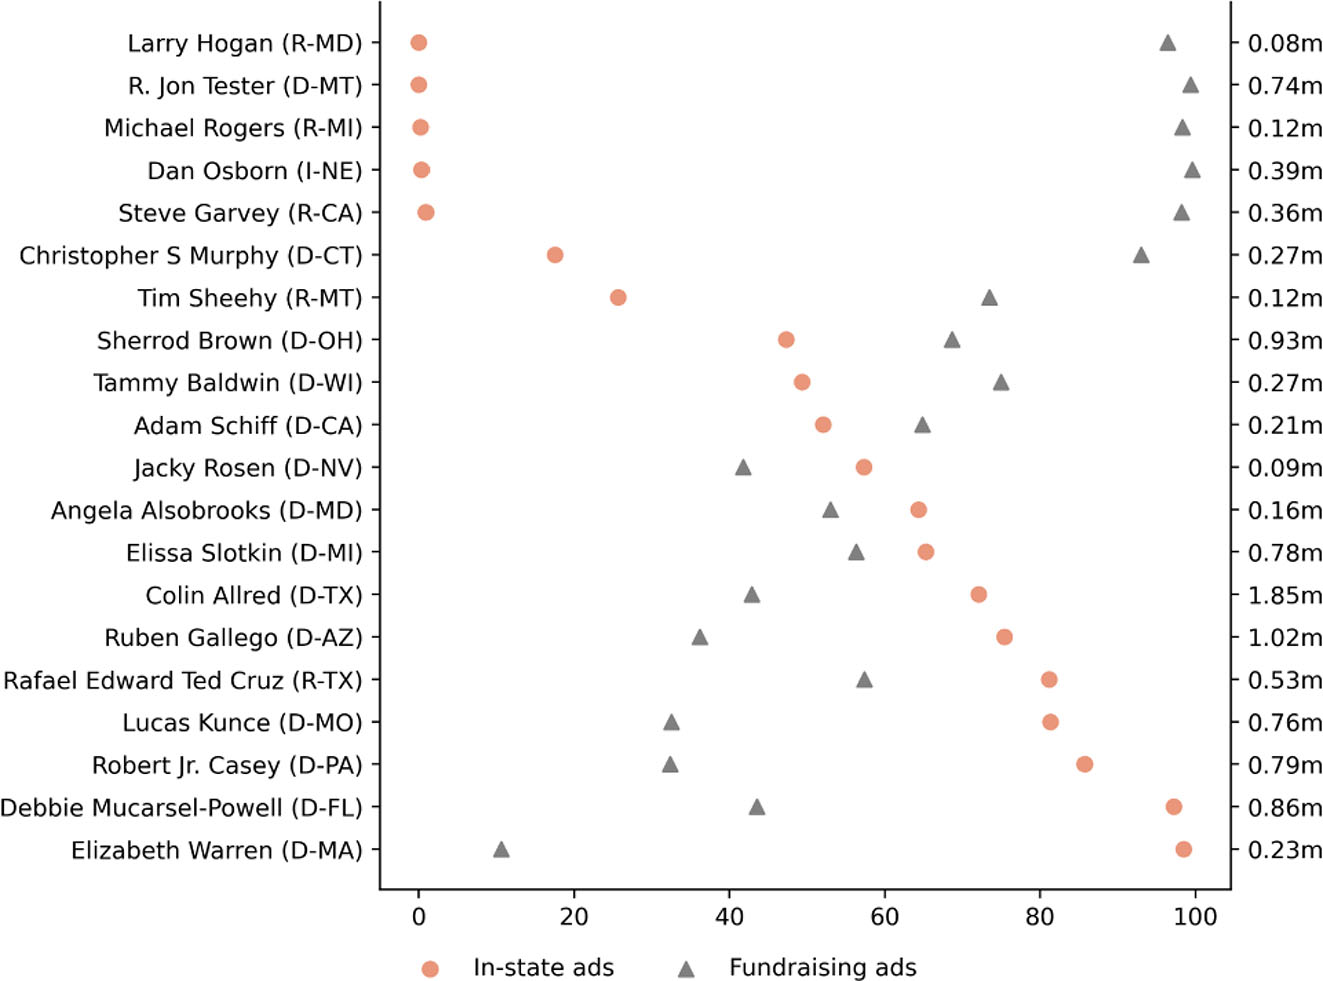
Percentage of fundraising and in-state ads for Top 20 U.S. Senate candidates on Meta. Source: Meta Ad Library with analysis by the Wesleyan Media Project. Notes: The x-axis displays the percentage of ads viewed by in-state audiences (represented by salmon-colored circle dots) and the of ads devoted to fundraising (depicted by gray triangles) for each candidate. Percentages are weighted by spending, calculated on ads active on Meta’s platforms (Facebook and Instagram) from September 3 through Election Day.
First-time Senate candidates such as Larry Hogan in Maryland, Mike Rogers in Michigan and Dan Osborn in Nebraska (who ran a surprisingly tight race as an Independent[12]) devoted their campaigns on Meta to fundraising almost entirely and appealed to potential donors nationwide. Long-sitting Senators, such as Elizabeth Warren of Massachusetts, focused on speaking to in-state voters. But there are also exceptions to this rule, such as Democratic challenger Lucas Kunce in Missouri and Democratic challenger in Florida Debbie Mucarsel-Powell, who focused their spending on in-state ads. Sitting Texas Senator Ted Cruz, who has a significant number of Texas donors,[13] ran a campaign with relatively high proportions of both in-state and fundraising ads, standing out as an exception to the negative relationship between in-state and fundraising campaigning focus.
5 Tone and Issue Appeals
Table 6 speaks to the tone of advertising on Meta and Google platforms in the presidential, House and Senate races, compared to the tone on television for candidate-sponsored (including coordinated) airings. Data cover the general election period (September 3 to Election Day), and we only show data for the most competitive U.S. House races. A few things stand out. First, there was generally a greater percentage of positive ads on digital than on television, though this does not hold in Senate races. For instance, in the presidential race, 53.6 % of ad spending on Meta was positive and 28.2 % on Google was positive; that is, it only mentioned a favored candidate. That compares to just 17.9 % of television ad airings. Second, attack ads are more common on television than digital.
Tone in federal candidate advertising on digital (Meta and Google video) versus TV by race.
| Attack % | Contrast % | Promote % | |||
|---|---|---|---|---|---|
| House | Digital | Meta | 12.8 | 21.6 | 65.6 |
| Google video | 2.2 | 42.7 | 55.1 | ||
| TV | 18.5 | 28.1 | 53.4 | ||
|
|
|||||
| Senate | Digital | Meta | 7.3 | 48.2 | 44.5 |
| Google video | 6.7 | 50.5 | 42.8 | ||
| TV | 28.4 | 25.6 | 46.0 | ||
|
|
|||||
| President | Digital | Meta | 7.1 | 39.3 | 53.6 |
| Google video | 1.9 | 69.9 | 28.2 | ||
| TV | 25.5 | 56.6 | 17.9 | ||
-
Source: Meta Ad Library, Google Ads Transparency Center, CMAG with analysis by the Wesleyan Media Project. Dates include September 3 to Election Day. House numbers calculated only for those races rated “tossup” or “lean” by the Cook Political Report. Percentages based on spending on Meta platforms (Facebook and Instagram) and video ad spending on Google (we exclude other Google advertising for assessing content) and based on airings on television (WMP coding for president and Vivvix/CMAG for House and Senate).
Table 7 speaks to the issue content of digital advertising in comparison to television advertising in the presidential race. The analysis focuses on the period between September 3 and Election Day. The first thing to notice is that – with few exceptions – television ads were more likely to mention several of the top issues than were digital ads, particularly Meta ads, which were more commonly “issueless.” While YouTube often fit the pattern of lower attention to many issues as compared to television, the difference between the two modes was closer, and there were some notable topics for which YouTube attention outstripped television.
Issue mentions in candidate-sponsored presidential advertising on Meta and YouTube versus TV by Party.
| Kamala Harris | Donald Trump | |||||
|---|---|---|---|---|---|---|
| TV | Meta | YouTube | TV | Meta | YouTube | |
| Economic issues % | 53.4 | 14.4 | 21.4 | 78.8 | 9.9 | 63.0 |
| Immigration % | 0.8 | 1.2 | 0.2 | 33.6 | 8.0 | 44.3 |
| Abortion % | 32.7 | 11.9 | 15.7 | – | <0.0 | - |
| Health care % | 19.5 | 3.6 | 4.7 | 25.2 | <0.0 | 4.1 |
| Medicare % | 13.7 | 0.6 | 2.3 | 8.2 | <0.0 | 2.4 |
| Transgender policies % | – | – | – | 21.1 | 0.1 | 13.3 |
| Democracy % | 4.0 | 2.7 | 0.5 | – | 0.6 | – |
| Project 2025 % | 18.9 | 8.6 | 21.9 | – | – | – |
-
Source: Vivvix/CMAG with Wesleyan Media Project coding; Meta Ad Library and Google Ads Transparency Center with analysis by the Wesleyan Media Project. Dates include September 3 through Election Day, and coordinated party advertising is combined with candidates for these totals. Notably, a single ad can include mentions of multiple issues. For TV ads, percentages are based on airings, and economy (inclusive of general economy, taxes, employment/jobs, and cost of living), immigration, abortion, health care (including Medicare), Medicare and transgender policies come from CMAG classifications while democracy and Project 2025 were identified through keywords-based searching of automated speech recognition of the audio files. For Meta and Google video ads, percentages are weighted by spending, and economy (inclusive of general economy, taxes, employment/jobs, and cost of living), immigration, abortion, and health care (including Medicare) were detected using a multilabel DistilBERT issue classifier. Transgender policies, democracy, and Project 2025 were identified using a keywords-based approach.
More specifically, Harris’ Google video spots were more likely to discuss Project 2025, and Trump’s Google video ads were more likely to mention immigration than his TV spots. Second, there is some degree of correspondence between each campaign’s top issues online and on television. For instance, two top issues for Harris online were the economy and abortion, which were her top two issues on television. Similarly, Trump’s top two issues on digital (the economy and immigration) were his top two issues on television. Third, it is sometimes notable what the candidates did not talk about. For instance, while Trump’s television ads put some emphasis on policies concerning transgender people, his YouTube ads reflected some of this attention while his Meta ads during the same time barely mentioned this issue, likely a result of his focus on mobilization and fundraising on Meta’s platforms. And while Trump mentioned economic issues (to include taxes, cost of living and jobs as well) in more than three-quarters of the television ads he aired, these issues appeared in 60 % of his Google video ads and only 10 % of his Meta ads. Another example: while Medicare mentions were frequent in Harris’ online advertising, they were almost nonexistent in her Meta and Google video advertising.
Table 8 shows the incidence of issue mentions on digital platforms and on television among U.S. House and Senate candidates for the September 3 through Election Day period. Only competitive House candidates are included in the analysis. Again, the frequency of issue mentions is less on Google video and especially less on Meta than it is on television. Issue priorities also vary across party, with Republicans putting relatively more emphasis on immigration and policies that affect transgender people and Democrats putting relatively more emphasis on abortion and healthcare.
Issue mentions in the U.S. House and U.S. Senate Candidate Advertising on Meta and Google video versus TV by Party.
| Democrat | Republican | |||||
|---|---|---|---|---|---|---|
| TV | Meta | Google video | TV | Meta | Google video | |
| Economic issues % | 32.4 | 10.7 | 22.1 | 49.9 | 25.3 | 40.6 |
| Immigration % | 17.5 | 5.2 | 15.8 | 39.6 | 18.4 | 35.2 |
| Abortion % | 31.4 | 14.5 | 30.6 | 5.8 | 8.1 | 3.7 |
| Health care % | 31.9 | 6.8 | 13.5 | 14.4 | 3.9 | 4.3 |
| Medicare % | 10.4 | 4.1 | 8.1 | 4.8 | 1.7 | 2.6 |
| Transgender policies % | 2.9 | 0.2 | 2.8 | 10.6 | 2.3 | 14.3 |
| Democracy % | 1.5 | 4.0 | 0.7 | 0.1 | 0.3 | 0.5 |
| Project 2025 % | 2.0 | 1.5 | 2.2 | – | < 0.0 | – |
-
Source: Vivvix/CMAG, Meta Ad Library, and Google Ads Transparency Center with analysis by the Wesleyan Media Project. Dates include September 3 to Election Day, 2024. Notably, a single ad can include mentions of multiple issues. For TV ads, percentages are based on airings, and economy (inclusive of general economy, taxes, and employment/jobs), immigration, abortion, health care (including Medicare), Medicare and transgender policies come from CMAG classifications while democracy and Project 2025 were identified through keywords-based searching of automated speech recognition of the audio files. For Meta and Google video ads, percentages are based on spending, and economy (inclusive of general economy, taxes, employment/jobs, and cost of living), immigration, abortion, and health care (including Medicare) were detected using a multilabel DistilBERT issue classifier. Transgender policies, democracy, and Project 2025 were identified using a keywords-based approach.
There are also some differences between the issue emphases of congressional candidates and the presidential candidates of their party. For instance, while Harris placed considerable emphasis on Project 2025, Democratic House and Senate candidates largely ignored the issue; it appeared in only 2.0 % of television ads, 1.5 % of Meta ads and 2.2 % of Google video ads. Similar to Fowler et al. (2021a, 2021b), we find that attention to core issues on television is lower on Meta in 2024 (and this pattern holds for Google video in congressional contests but to a lesser extent); however, Democratic ads on Facebook and Instagram talked more about democracy and the threat of an authoritarian dictator more on Meta than they did in their television advertising. On the other hand, transgender policies emerged as a salient issue in the presidential campaign and among Republicans in the 2024 general election cycle. Similar to the Trump campaign, congressional Republican ads frequently highlighted transgender policies on television and digital platforms, replicating the rhetoric of biological boys competing in girls’ sports or using the girls’ bathroom and locker room.
6 Conclusions
Digital political advertising remained important in federal races in the 2023–2024 election cycle in the United States. Our same-candidate comparisons showed growth in the use of advertising on Google, while growth in advertising on Facebook and Instagram was less prevalent. Donald Trump did not embrace digital advertising on Google and Meta platforms to the extent he did in 2020 (his advertising may have gone to other digital platforms that do not provide the same level of transparency), but Harris spent just under a quarter of a billion dollars on Facebook and Google.
In contests for U.S. Congress, there was less spending on digital ads than in the presidential race, but candidates spent over $150 million on digital advertising in the 2024 cycle, and that does not include the spending by groups that were trying to influence these races. The extent to which candidates embraced digital spending, of course, varied, with some devoting almost all of their spending to television and others spending a substantial chunk of the advertising funds on the Meta and Google platforms. Factors such as the efficiency of television advertising – the extent to which media markets correspond with a district’s boundaries – may help to explain this variation.
Importantly, digital advertising in 2024 included more than just persuasion and fundraising in the presidential race. While both presidential candidates spent time on persuasion, fundraising and get-out-the-vote (GOTV) efforts, they employed different strategies across the platforms and different strategies from each other. On Facebook and Instagram, Harris ads were split between persuasion and fundraising, but more than one out of every ten dollars was devoted to GOTV. Although Trump spent much less than Harris on Meta properties, the time he did spend was split between fundraising and GOTV, with more dollars devoted to the latter and a little more than one out of every ten dollars devoted to persuasion. Both campaigns utilized Google video (primarily YouTube) for persuasion, which is another clear sign that the platform is most similar to TV (Ridout et al. 2024); however, the Harris campaign did spend nearly one out of every ten dollars on GOTV on that platform as well. In short, even in our preliminary look at the 2024 cross-platform activity, we find continued confirmation that different platforms are used for different purposes.
Not dissimilar from our analyses of the 2022 election (Fowler et al. 2023), we also find a lot of variation in the goals of digital advertising for U.S. Senate candidates. Some Senate candidates seemed to look at digital as, by and large, a way to raise money – largely from out-of-state donors that would, in all likelihood, pay for more television ads. Others, however, mixed their audiences between their constituents and out-of-state residents and had a lower proportion of fundraising activity.
Digital advertising in general tends to be more positive than television, perhaps in part because the goals of online advertising are more varied than on television. Television advertising is generally also more likely to feature pure attack advertising. However, we also find in U.S. Senate advertising roughly equal proportions of promotional advertising across Meta, Google video and television.
In terms of issue content, we found that Meta ads are more likely to be silent when it comes to policy issues compared to television ads, with Google video (primarily YouTube) advertising in general being between the two. The lower issue content online may owe to the fact that some of the goals pursued with digital political ads, such as fundraising or acquiring a voter’s contact information, may not require an issue appeal. Oftentimes these ads will feature a “bad guy” from the other party in order to get audiences to act. Although issue content is less common online, in many ways the issue agenda was similar to television in the presidential race, with some exceptions. For instance, Trump’s discussion of Medicare and policies that affect transgender people were seen in the fall television campaign but were barely visible in the ads that the campaign placed on Meta. We can only speculate why this is the case, but it may have had to do with the audiences sought – it is conventional wisdom that swing voters are more likely to be found on television, for instance – or it could stem from the campaign dividing up the issue space with supportive groups, such as MAGA, Inc.
The issue emphasis in digital ads also varied by party in the congressional races, with Democrats emphasizing abortion rights and Republicans emphasizing immigration. Although Democrats did not ignore the economy, it was much more frequently mentioned in Republican candidate ads. Transgender policies also received a nontrivial amount of attention in Republican advertising, and Google video ads were even more likely to feature the topic than television advertising.
What is the future of digital advertising in American politics? It is clear that the media environment has fragmented, and broadcast television is not as dominant as it once was. But it is also clear that campaigns’ investments in digital advertising are not skyrocketing each election cycle. Television ad budgets are not being moved in full over to Facebook, Instagram and YouTube. Instead, smart campaigns seem to be distributing their advertising monies over a variety of platforms and channels, some old and some new. And while hard numbers are difficult to come by, it appears that campaigns are spending considerable resources on new forms of advertising that sit in between television and digital advertising, such as ads on connected television. These ads, purchased from Hulu, Paramount+ and other streaming services and connected TV devices, can be seen both on smart TVs and on Internet-connected devices, such as phones, tablets and gaming consoles.
Funding source: National Science Foundation
Award Identifier / Grant number: 2235006, 2235007, and 2235008
Funding source: John S. and James L. Knight Foundation
Award Identifier / Grant number: GR-2023-68459
Acknowledgements
We thank the entire Wesleyan Media Project (WMP) team for their time and effort in making our tracking and analysis of election advertising possible. In particular, we thank our student coding supervisors, Saul Ferholt-Kahn, Akhil Joondeph, Emmett Perry, and Cecilia Smith. We also thank our human coding team, especially Justin Biemann, Helen Xie, and Nathan Weisbrod, and our Delta Lab computational team. We also thank Markus Neumann, Jielu Yao, and Furkan Cakmak for their contributions to the digital analysis pipelines. The Wesleyan Media Project partners with OpenSecrets to assess different sponsors of advertising activity, particularly outside groups, and gratefully acknowledges support from the John S. and James L. Knight Foundation and Wesleyan University. Analyses of the 2024 election cycle builds upon WMP work conducted for the 2022 midterms that was supported in part by National Science Foundation under grants 2235006, 2235007, and 2235008. Any opinions, findings, conclusions, or recommendations expressed in this material are those of the authors and do not necessarily reflect the views of the Knight Foundation or the National Science Foundation.
-
Research funding: This work was funded in part by John S. and James L. Knight Foundation (Award No.: GR-2023-68459). Analyses of the 2024 election cycle builds upon WMP work conducted for the 2022 midterms that was supported in part by the National Science Foundation under grants 2235006, 2235007, and 2235008.
References
Ballard, Andrew O., D. Sunshine Hillygus, and Tobias Konitzer. 2016. “Campaigning Online: Web Display Ads in the 2012 Presidential Campaign.” PS: Political Science & Politics 49 (3): 414–9. https://doi.org/10.1017/S1049096516000780.Search in Google Scholar
Fowler, Erika Franklin, Michael M. Franz, Gregory J. Martin, Zachary Peskowitz, and Travis N. Ridout. 2021a. “Political Advertising Online and Offline.” American Political Science Review 115 (1): 130–49. https://doi.org/10.1017/S0003055420000696.Search in Google Scholar
Fowler, Erika Franklin, Michael M. Franz, Markus Neumann, Travis N. Ridout, and Jielu Yao. 2023. “Digital Advertising in the 2022 Midterms.” The Forum 21 (1): 53–73. https://doi.org/10.1515/for-2023-2006.Search in Google Scholar
Fowler, Erika Franklin, Michael Franz, and Travis Ridout. 2021b. Political Advertising In the United States, 2nd ed. New York: Routledge.10.4324/9781003165712Search in Google Scholar
Friedman, Wayne. 2024. “Political Ad Spending Estimated to Climb to $10.7B: Analyst.” MediaPost. https://www.mediapost.com/publications/article/397381/political-ad-spending-estimated-to-climb-to-107b.html.Search in Google Scholar
Goldmacher, Shane.“How Trump Targeted Undecided Voters without Breaking the Bank.” New York Times. https://www.nytimes.com/2024/12/05/us/politics/trump-streaming-ads-strategy.html (May 12, 2024).Search in Google Scholar
Neumann, Markus, Jielu Yao, Spencer Dean, and Erika Franklin Fowler. 2020. A Banner Year for Advertising and a Look at Differences across Platforms. https://www.electionanalysis.ws/us/president2020/section-5-social-media/a-banner-year-for-advertising-and-a-look-at-differences-across-platforms/.Search in Google Scholar
Ridout, Travis N., Erika Franklin Fowler, and Michael M. Franz. 2021a. “Spending Fast and Furious: Political Advertising in 2020.” The Forum 18 (4): 465–92. https://doi.org/10.1515/for-2020-2109.Search in Google Scholar
Ridout, Travis N., Erika Franklin Fowler, and Michael M. Franz. 2021b. “The Influence of Goals and Timing: How Campaigns Deploy Ads on Facebook.” Journal of Information Technology & Politics 18 (3): 293–309. https://doi.org/10.1080/19331681.2021.1874585.Search in Google Scholar
Ridout, Travis N., Markus Neumann, Jielu Yao, Laura Baum, Michael M. Franz, Pavel Oleinikov, and Erika Franklin Fowler. 2024. “Platform Convergence or Divergence? Comparing Political Ad Content across Digital and Social Media Platforms.” Social Science Computer Review 42 (5): 1181–203. https://doi.org/10.1177/08944393241258767.Search in Google Scholar
Ridout, Travis, Erika Franklin Fowler, and Michael Franz. 2025. “Understanding the Message(s): Spending and Content of Political Advertising on Television in 2024.” The Forum, https://www.degruyterbrill.com/document/doi/10.1515/for-2025-2002/html.10.1515/for-2025-2002Search in Google Scholar
Ronzhyn, Alexander, Ana Sofia Cardenal, and Albert Batlle Rubio. 2023. “Defining Affordances in Social Media Research: A Literature Review.” New Media & Society 25 (11): 3165–88. https://doi.org/10.1177/14614448221135187.Search in Google Scholar
Sanh, Victor, Lysandre Debut, Julien Chaumond, and Thomas Wolf. 2020. “DistilBERT, a Distilled Version of BERT: Smaller, Faster, Cheaper and Lighter.” arXiv. https://doi.org/10.48550/arXiv.1910.01108.Search in Google Scholar
Sheingate, Adam, James Scharf, and Conner Delahanty. 2022. “Digital Advertising in US Federal Elections, 2004-2020.” Journal of Quantitative Description: Digital Media 2, https://doi.org/10.51685/jqd.2022.026.Search in Google Scholar
© 2025 the author(s), published by De Gruyter, Berlin/Boston
This work is licensed under the Creative Commons Attribution 4.0 International License.
Articles in the same Issue
- Frontmatter
- Articles
- Prologue to 2024
- Electability and Party Power Across Party Lines
- Understanding the Message(s): Spending and Content of Political Advertising on Television in 2024
- Election Advertising on Meta, Google, and Snapchat in 2024
- From the Podium to the Press: Coverage of Kamala Harris’s 2024 Convention Address
- Pocketbook Voting in a Polarized Era: Economic Vulnerability and Anti-incumbent Voting in Presidential Elections
- The 2024 U.S. Presidential Election: Public Opinion on the Economy and Immigration Helped Return Trump to the White House, but with No Clear Policy Mandate
- The 2024 Presidential Election Through Latino Lenses: Priorities and Vote Choice
- Less White than Ever? Using Ecological Inference to Probe the Trump Coalition’s Diversity in Louisiana
- The Trump Effect: Nationalized Narratives and Congressional Outcomes in the 2024 Elections