Understanding the Message(s): Spending and Content of Political Advertising on Television in 2024
-
Travis N. Ridout
 ,
Erika Franklin Fowler
,
Erika Franklin Fowler
 and
Michael M. Franz
and
Michael M. Franz

Abstract
This paper leverages comprehensive data on political advertising on television sponsored by candidates, parties and outside groups in the 2024 election. We show, for one, that the presidential race between Kamala Harris and Donald Trump was extremely close in terms of the volume of advertising. Second, Harris and Trump focused their ads on bread-and-butter issues like the economy and taxes, though Harris focused more on abortion and women’s rights and Trump pivoted for a brief period to attacks on Harris and her prior statements on transgender issues. We also examine the scale and scope of advertising in congressional races. Democrats heavily out-spent Republicans on the air in the fall of 2024, despite losing ground in the Senate and falling short of reclaiming control of the House. This research represents a first-cut look at the campaign information environment on television ads in the 2024 campaign.
1 Introduction
By some metrics, the 2024 presidential election was a close one. Although Donald Trump scored a decisive victory in the Electoral College, his wins in Wisconsin, Michigan and Pennsylvania were 0.92 %, 1.4 % and 1.8 %, respectively. Had Trump lost those states, Kamala Harris would have won the election. Given the relative closeness of the presidential race, it is tempting to look at the campaign itself in order to diagnose why Trump won or why Harris lost. Indeed, many commentators have already done so, ascribing importance to Harris’ colossal–but, in their view, misspent–campaign budget and Harris’ alleged focus on “woke” cultural issues. Democrats also sustained losses in Senate races and fell short of bigger gains in House races, suggesting that either Harris had negative coattails on down-ballot campaigns or broader, structural forces worked to the disadvantage of Democrats.
In this research, we leverage data on political advertising sponsored by candidates, parties and outside groups to shed some light on the shape of the campaign. We, of course, are not able to draw causal conclusions about the effect of messages on outcomes, but we are able to address some of the narratives that have already appeared. We show, for one, that the presidential race was extremely close in terms of the volume of advertising. The idea that Harris used her considerable funds to dominate on broadcast television is just not true, though she did spend more on some venues like local cable and radio. In fact, in many media markets in swing states, there were more pro-Trump ads on broadcast television stations than pro-Harris ads. Indeed, the Trump campaign was far more competitive on broadcast television than it was in the 2016 and 2020 campaigns (Fowler, Ridout, and Franz 2016; Ridout, Fowler, and Franz 2021).
Second, the media’s issue agenda did not necessarily match the candidates’ issue agenda for much of the campaign. A lot of the time, Harris and Trump were talking about bread-and-butter issues like the economy and taxes, though Harris focused more on abortion and women’s rights. Trump focused for a brief period on policies related to transgender people, and in part because those airings were high-profile (airing during prime-time sports, including the World Series), they received a lot of media attention. On the other hand, those ads did not seem targeted to particular markets or states and were his focus for only a few weeks in early October. Still, the issue was prominent in some congressional races, such as the Senate races in Ohio and Texas, and it may have featured more in digital messaging. Beyond that issue, though, Trump spent more time than Harris on macro-economic factors, which may have contributed to voters’ sense that Harris was not that different from Biden on economic issues.
We also focus on advertising in congressional races. Here, Democrats did not get the results they had hoped for despite heavily out-spending Republicans on the air in the fall of 2024. Democrats focused on issues like abortion and health care, while Republicans spent more time on immigration and public safety. Economic issues were less central to the messaging of both parties.
At the end of the day, political advertising is the primary way by which candidates and their allies make a case to voters, emphasizing some policy messages over others and framing the solutions to big problems. The impact of these messages on how voters cast ballots has long been an open question, and in this cycle many candidates who spent more than their opponents lost. When candidates win despite spending less or airing fewer ads, it could mean that that the winning candidate’s message was simply better (quality over quantity) or that broader macroeconomic and structural forces were at work to advantage one type of candidate over another. It is certainly possible that both factors lined up to help Republicans this cycle.
1.1 Tracking the Ad Campaign
We use a variety of data sources to track the ad campaign. First, we rely on data from the Wesleyan Media Project (WMP), which acquires commercial ad tracking data from Vivvix/CMAG, a media intelligence firm. These data provide a record of each ad airing on broadcast television in all 210 media markets in the United States. The data also include any ads that air nationally on network stations or cable channels. Details include the date and time of each airing and the television station on which it ran along with the media market in which it aired.
Vivvix/CMAG also provides spending amounts for local broadcast and national spots, as well as spending totals for local cable television, satellite television and radio. These totals are based on files submitted to the Federal Communications Commission by television and radio stations–the so-called “public inspection” files.[1] The Vivvix/CMAG data do not include the frequency of ads on local cable, satellite TV or radio.
The WMP supplements the local broadcast data with its own coding of several attributes of each advertisement, including the issues mentioned, the ad’s tone, and whether the ad focused primarily on policy issues or the personal characteristics of the candidates. Our coding as of this writing is ongoing and subject to some revisions, but we have coded each of the unique ad creatives in the full presidential election cycle.[2]
1.2 The Big Picture: Ad Spending
Today’s media environment is extremely fragmented, and for the first time less than half of television watching is on broadcast or cable television (Valinsky 2023). Thus, it is important to examine political advertising on as many platforms and channels as possible. We begin with an overview of spending on television and radio advertising in the 2024 election. We focus on presidential, congressional, and gubernatorial campaigns and total ad spending on local broadcast (e.g. ABC and NBC affiliates in media markets) and national cable, addressable television (wherein ads are customized on set-top boxes), satellite television, and radio (AM, FM, and satellite). Not included in these totals are ads on digital platforms such as Meta and Google (or ads appearing on other websites), as well as ads on streaming television applications such as Hulu and Paramount+. These latter channels are often referred to as Connected Television, or CTV. Digital totals are discussed in a separate article (Fowler et al. 2024), but a complete picture of digital ad spending in federal and gubernatorial campaigns is not yet available, in part because it is difficult to track and assign relevant spending by outside groups to their intended office targets.[3] There is also no comprehensive way to track CTV ads, though one report suggested CTV ads for political campaigns might have totaled $1.5 billion for races up and down the ballot in the 2023-24 election cycle (Friedman 2024).
For comparison purposes, we also show in Figure 1 totals from 2020, though in many ways that cycle is not an apples-to-apples comparison. The COVID-19 pandemic limited in-person campaigning, compelling many candidates and supportive outside groups to boost their ad spending relative to their ground game. Additionally, Michael Bloomberg and Tom Steyer ran brief but intense campaigns for the 2020 Democratic presidential nomination, together spending over $1 billion in political ads on radio and television. We include their spending but It's not shaded in the figure but in white shade their combined totals in the figure to allow for a comparison without them.
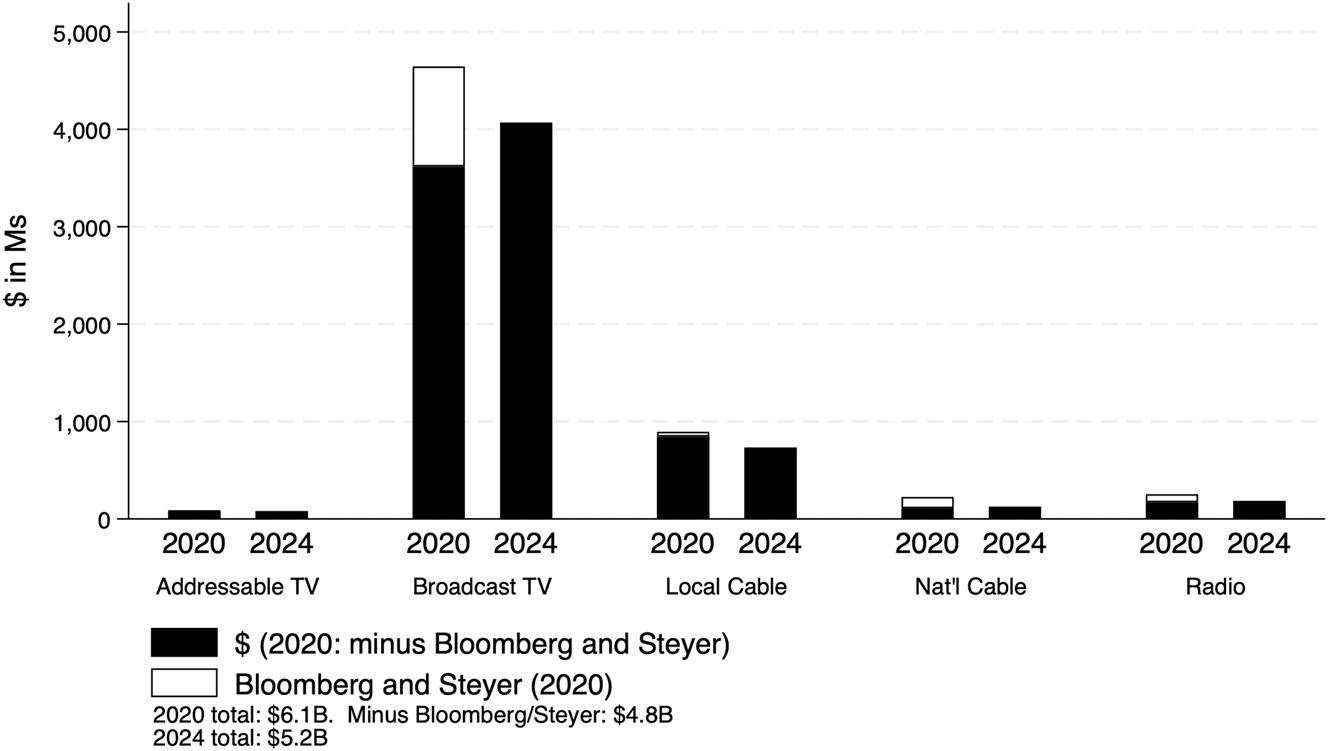
Spending on TV and radio ads (federal races and gubernatorial campaigns). Source: Vivvix/CMAG.
All told, broadcast television spending reached $4 billion in 2024, which was more than the 2020 total if one excludes Bloomberg and Steyer. Figure 1 makes clear that live spots on local broadcast stations are still important to races at the top of the ticket.[4] Indeed, they accounted for 78 % of the spending included in Figure 1 in 2024 and 76 % of the total spending included in 2020. Local cable spending lagged a bit behind the 2020 totals ($732 million compared to $844 million in 2020, excluding Bloomberg and Steyer), but radio and national cable spots were comparable across cycles. In total, ad sponsors committed about $5.2 billion to television and radio ads in the 2024 cycle. This compares to $4.8 billion in 2020 when one excludes Bloomberg and Steyer and $6.1 billion when one includes them.
The total cost of federal elections can be hard to calculate given that some spending by outside groups is not required to be reported to the Federal Election Commission (FEC), but OpenSecrets calculates the cost given all available information.[5] For 2024, they estimate total federal spending to be about $16 billion.[6] In 2020, the total was over $15 billion (in 2020 dollars). If we exclude gubernatorial spending from Figure 1 and use federal ad spending as the numerator, the money devoted to buying ad time on television and radio accounted for 30.6 % of federal spending in 2024 and 38 % in 2020.[7] Notably, this excludes digital and CTV, along with additional spending to create and film the ad and consultant fees to place and focus group the ads.
1.3 Ad Volume in Federal Races
Beyond spending, we have data on broadcast ad volumes for several past election cycles in both the presidential race and congressional races. In Figure 2, we show the number of ad airings in each presidential election between 2008 and 2024. These include local broadcast spots as well as any national network or cable buys. They exclude local cable spots. In one respect, 2024 was not particularly note-worthy. There were fewer total spots than in 2020 (even when excluding Bloomberg and Steyer) and 2012, but more than in 2008 and 2016. As we show later, Trump in 2024 did not air many television spots in the spring and early summer compared to candidates in previous years, and there were comparatively few ads in the Republican nomination campaign earlier in the year.[8] As such, the bulk of the ad airings in 2024 was for the general election campaign period, after Joe Biden dropped out in mid-July.

Presidential ad airings on local broadcast stations and national channels, 2008–2024. Source: Vivvix/CMAG.
In Figure 3, we show House and Senate ad volume between 2012 and 2024. Ad airings reached a record for U.S. House races in 2024, though that total just edged out prior cycles back to 2018. More generally, the number of ad spots in the 2018 to 2024 period far exceeded the number of ad spots in the 2012 to 2016 period. This, in part, reflects the close balance between Republicans and Democrats in the House in more recent years. Democrats won a majority in 2018 but lost it in 2022, and control in 2024 was predicted to come down to the wire.[9]
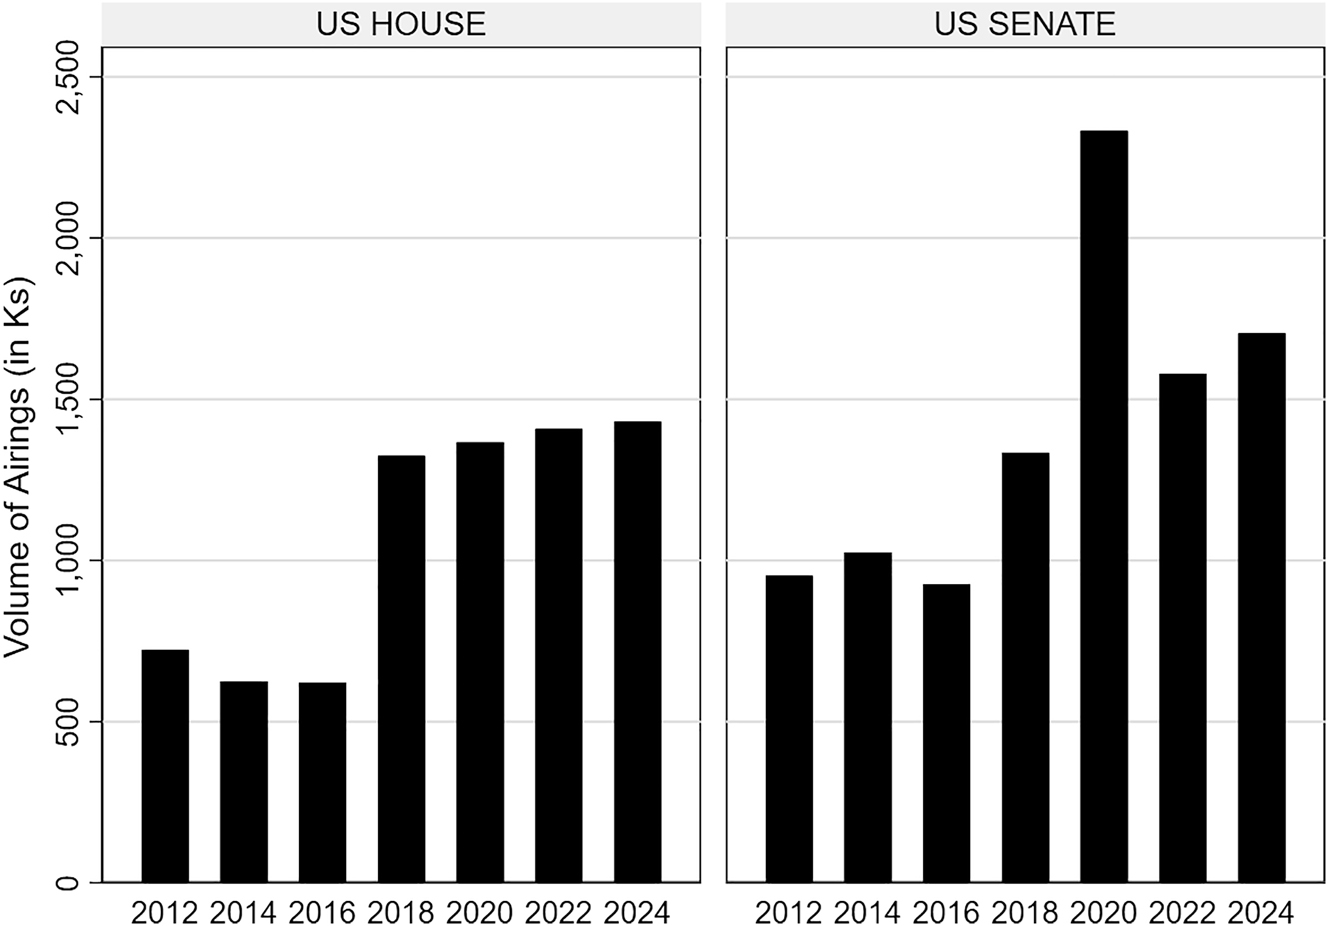
Congressional ad airings on local broadcast stations, 2012–2024. Source: Vivvix/CMAG.
For U.S. Senate races, ad totals have also generally been on the rise since 2018, though 2020 stands out as the high point in the time series. In that year, the campaign in Montana featured over 270,000 spots in the full election cycle, and there were two campaigns in Georgia that drew in total over 236,000 spots. Even the Senate campaign in Iowa featured over 227,000 ad airings. There were eight Senate elections that cycle, in addition to those in Montana, Georgia, and Iowa, that featured over 100,000 spots. In some sense, this was clearly a COVID-19 effect, with limited opportunities for in-person campaign events and door-to-door mobilization and persuasion efforts, along with a number of highly competitive campaigns that resulted in a 50-50 party split in the U.S. Senate going into January 2021.
The 2024 cycle featured the second highest number of Senate ads since 2012, and more than in the comparable prior cycles of 2018 and 2012, years in which the same seats were up for election. The Senate campaigns with the most ads in the full 2024 cycle included Montana (with 370,000 total ad airings), Ohio (270,000), Wisconsin (144,000), Pennsylvania (134,000), Texas (130,000), and Michigan (98,500).
1.4 Balanced Presidential Ad Environment
The 2024 ad campaign is somewhat remarkable for how evenly matched the presidential candidates were in terms of the volume of advertising. All told, Kamala Harris and group allies aired 482,000 ads on broadcast television between July 22 and Election Day compared to 480,000 ads for Donald Trump and his allies (Table 1). Estimated spending on broadcast advertising by the two campaigns was also fairly close, with Harris and supporting groups spending an estimated $589 million compared to $557 million from Trump and supporting groups. All told, then, Harris and allies were paying slightly more for each ad airing, perhaps because they were buying relatively more ads in more expensive media markets and in more expensive time slots. There were also more pro-Harris ads aired nationally than pro-Trump ads (as we show below). These national ads tend to be quite expensive because they are shown across the country.
Broadcast TV ad spending in presidential race, in millions (July 22 to Election Day).
| Sponsor | Party | Ad Counts | Ad Cost (in Ms) |
|---|---|---|---|
| Harris, Kamala | Dem | 327,287 | $254.43 |
| FF PAC (and various allies) | Dem | 130,120 | $273.88 |
| Trump, Donald | Rep | 309,233 | $216.65 |
| Make America Geat Again Inc | Rep | 118,676 | $190.64 |
| Preserve America PAC | Rep | 31,558 | $65.36 |
| All pro-Harris | 481,900 | $588.55 | |
| All pro-Trump | 479,648 | $556.83 |
-
Totals include local broadcast, national cable and national network spending. Groups that spent small amounts in the presidential races are not shown in the table, but their advertising is included in the totals. Source: Vivvix/CMAG.
Although pro-Harris and pro-Trump ads on broadcast television were almost even in number across the general election campaign, that was not true for each week of the campaign, as Figure 4 shows. Pro-Trump ads outnumbered pro-Harris ads during the three weeks following Harris’ entry into the race. After those three weeks, both sides ramped up their advertising, and pro-Harris ads were at a level of about 6,000 per day (excluding weekends) for the next eight weeks. In mid-August, pro-Trump ads jumped in number as well but then declined in September to about 4,000 per day (excluding weekends). Pro-Harris ads dipped in early October before ramping up to Election Day, but for much of October, pro-Trump ads were greater in number.

Daily airings in 2024 presidential general election. Source: Vivvix/CMAG. Note: Ads from candidates, parties, and outside groups included in totals.
In addition, the distribution of pro-Harris and pro-Trump ads varied somewhat across media markets, as Figure 5 shows. By and large, the number of ads from each side was similar in each market, but pro-Harris ad advantages were more common in markets that saw more advertising, such as Philadelphia and Phoenix, while pro-Trump ad advantages were more common in markets that saw less advertising, perhaps reflecting a focus by the Trump campaign on more rural areas and a focus by the Harris campaign on more urban areas. Harris’ ad advantage is also visible on national network television and national cable television, though the absolute number of ads shown in each of these venues was relatively small.[10]

Media market totals in presidential general election, 2024. Source: Vivvix/CMAG. Note: Ads from candidates, parties, and outside groups included in totals. For ads airing between July 22 and Election Day.
We have affirmed that “balanced” is the best descriptor of pro-Harris and pro-Trump broadcast advertising for the entire general election period, which has some obvious implications for identifying ad effects, as the two sides effectively cancelled each other out on air (Zaller 1996), but when we dig into other types of advertising, some of that balance disappears. Table 2 shows spending by sponsor on different types of television advertising, including local cable, national cable and addressable television (such as DirectTV), and advertising on radio. We see, for instance, that there was $116 million worth of advertising for pro-Harris ads on local cable compared to $68 million in pro-Trump advertising on local cable. Spending on pro-Harris ads on national cable more than doubled spending on pro-Trump ads: $42 million versus $20 million. Pro-Harris ads also dominated radio, with $53 million in spending compared to $12 million in pro-Trump ad spending on radio.
All TV and radio ad spending in presidential race, in millions (July 22 to Election Day).
| Sponsor | Party lean | All TV/radio | Local cable | Nat’l cable | Radio | Addressable TV |
|---|---|---|---|---|---|---|
| Harris, Kamala | Dem | $337.44 | $56.80 | $19.40 | $23.39 | $2.85 |
| FF PAC (and allies) | Dem | $343.80 | $44.07 | $21.05 | $23.11 | $2.74 |
| Project Freedom LLC | Dem | $28.75 | $8.06 | $1.11 | ||
| AB PAC | Dem | $21.99 | $1.86 | $2.46 | ||
| Republican Accountability PAC | Dem | $14.78 | $2.53 | $0.49 | ||
| Democracyfirst | Dem | $2.73 | $0.71 | $0.17 | ||
| One for All Committee | Dem | $2.48 | ||||
| Somos Votantes | Dem | $1.32 | $0.05 | |||
| Anti-Psychopath PAC Inc. | Dem | $1.04 | $0.71 | $0.33 | ||
| Untd Assoc of Union Plumbers & Pipefitters | Dem | $1.00 | ||||
| All pro-Harris | $762.90 | $115.69 | $42.00 | $52.79 | $5.85 | |
|
|
||||||
| Trump, Donald | Rep | $263.21 | $30.90 | $13.70 | $2.06 | $13.60 |
| Make America Great Again Inc. | Rep | $209.09 | $15.30 | $0.62 | $0.58 | $2.52 |
| Preserve America PAC | Rep | $76.04 | $8.87 | $0.20 | $1.82 | |
| Right for America | Rep | $54.03 | $6.51 | $0.45 | $5.15 | $0.61 |
| Restoration PAC | Rep | $27.19 | $1.91 | $2.89 | ||
| Dan Newlin Injury Attorneys | Rep | $7.84 | $0.38 | |||
| RJC Victory Fund | Rep | $7.36 | $0.33 | $2.24 | ||
| Americas PAC | Rep | $2.17 | $2.17 | |||
| Maha Alliance | Rep | $1.95 | ||||
| Majority PAC | Rep | $1.19 | $1.09 | |||
| All pro-Trump | $654.61 | $67.53 | $20.39 | $11.65 | $18.54 | |
-
Sponsors included if their total exceeded $1 million. The first column of spending includes ads for local broadcast channels and national network spots. Source: Vivvix/CMAG.
All told, then, we find $763 million in ad spending on television and radio that advanced Harris’ candidacy compared to $655 million that advanced Trump’s candidacy. That’s a gap of over $100 million, but considering that over $1.4 billion was spent on television and radio ads in the presidential election race during the general election period, that difference does not look all that large. Still, the $1.4 billion figure does not include ads on digital and social media where Harris did hold a considerable advantage in spending (Fowler et al. 2024).
1.5 A Negative, Policy-Focused Race in Advertising
Few would be surprised to learn that advertising in the presidential race was largely negative. Figure 6 shows (in the top panels), the number of ads by week and by favored candidate that were positive (mentioning solely the favored candidate), attack (mentioning solely the targeted candidate except for the “paid for by” line), and contrast (mentioning both the favored and the targeted candidates). The bottom panels show the percentage of pro-Biden/Harris and pro-Trump ads that fell into each of these categories. If we focus on late-July and early August right after Harris became the presumptive Democratic Party nominee, we see that many pro-Harris ads were positive. Many of these ads focused on introducing (or re-introducing) Harris to the American voter, but the proportion of pro-Harris ads that were positive declined over time, constituting a very small percentage in the final weeks of the campaign. The plurality of pro-Harris ads were contrast.

Ad tone in presidential race by week, 2024. Source: Vivvix/CMAG. Note: Ads from candidates, parties, and outside groups included in totals.
On the other side of the aisle, the Trump campaign and allies went almost all negative after Harris’ entry into the presidential race, airing almost exclusively attack ads. (Notably, the volume of pro-Trump ads in the period between April and late July was very small.) Trump advertising then became a mix of attack and contrast for the rest of the campaign, with a mere smattering of positive ads. Indeed, less than one half of one percent of pro-Trump ad airings during the general election campaign were positive.
A negative race, however, does not imply a contest lacking in policy substance. Figure 7 shows the percentage of ad airings, among those favoring the Democratic or Republican presidential nominee since 2008, that were primarily focused on policy (light grey), were primarily focused on the personal characteristics of the candidates (black), were focused on both (dark grey) or neither (white).[11] Watching news coverage on television or reading the candidates’ social media posts, one might have felt like the campaign was all about the candidates’ personal characteristics, but ads in the presidential race were quite substantive. Over 70 % of pro-Harris advertising was focused on policy (her campaign and allies ran a sizable number of biographical ads introducing her that focused on personal characteristics and then she also ran some ads that attacked Trump personally, but these were a minority of airings), and over 90 % of pro-Trump advertising was focused on policy.
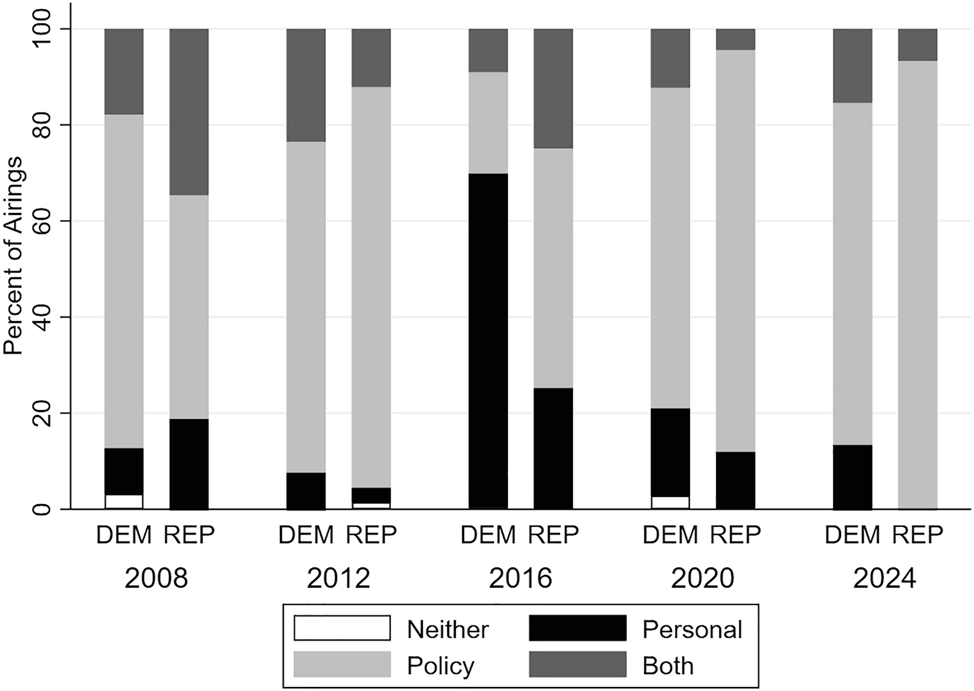
Policy versus personal focus of presidential ads, 2008–2024. Source: Vivvix/CMAG, with ad coding from Wesleyan Media Project. Note: Ads from candidates, parties, and outside groups included in totals.
Indeed, the ad campaign supporting Trump in 2024 was the most policy-focused of any presidential ad campaign since 2008. Having said that, it is also true that personal characteristics sometimes intruded into policy-focused advertising. For instance, one Trump campaign ad that focused on immigration, the border with Mexico, and terrorism also featured two short clips of Kamala Harris dancing at an outdoor gathering. While the ad itself was clearly focused on the Vice President’s record in office, the use of these particular images was likely intended to poke fun at her personally even if they were not the primary focus of the ad. Still, direct attacks on her racial identity, speaking style, and so on were not clear goals of Trump’s broadcast ads.
What issue were the candidates talking about? We coded each ad that aired on broadcast channels or national networks on a large battery of issues. Table 3 shows the top 10 issues by both the Harris campaign and the Trump campaign (excluding group allies). Economic issues were important to both campaigns, with Harris mentioning taxes in 40 % of her ad airings, the cost of living in 39 %, and housing (generally framed in terms of affordability) in 37 % of her ads. Trump mentioned the cost of living in fully three-quarters of his spots, taxes in 59 %, and the economy in 30 %.
Issue focus of the Harris and Trump campaigns.
| Harris | Trump | ||
|---|---|---|---|
| Taxes | 40.3 % | Cost of living | 75.0 % |
| Cost of living | 39.3 % | Taxes | 58.7 % |
| Housing | 37.3 % | Immigration | 35.1 % |
| Courts/Supreme Court/Judiciary | 27.3 % | Economy | 30.3 % |
| Abortion | 23.1 % | Energy | 24.5 % |
| Crime | 21.3 % | Crime | 24.0 % |
| Domestic Violence/Sexual Assault | 16.8 % | Incarceration/Sentencing | 19.2 % |
| Business | 16.7 % | Jobs | 18.7 % |
| Jobs | 16.3 % | LGBTQ/Trans issues | 15.7 % |
| Social Security | 14.8 % | Welfare | 13.6 % |
-
Source: Vivvix/CMAG, with issue coding from Wesleyan Media Project. Ads from Harris and Trump campaigns only. July 22 to Election Day, 2024.
But the campaigns did depart from each other in their issue focus in a couple of areas. Harris, for instance, mentioned abortion in 23 % of her ads, but abortion was not in Trump’s top 10; indeed, he did not mention it a single time in his general election campaign advertising. Trump mentioned immigration in 35 % of his ad airings, an issue that Harris mentioned in just 13 % of her spots. Finally, while 16 % of Trump ads mentioned policies concerning LGBTQ people (generally transgender, in Trump’s case), not a single Harris ad mentioned this topic.
It is also important to focus on the timing of issue mentions by the Trump and Harris campaigns, and thus we calculate the percentage of airings that focus on each issue during each week of the general election campaign. In Figure 8, we show mentions of several economic-related issues. In Figure 9, we show mentions for a collection of other issues with non-trivial mentions by one of the two candidates.

Focus on economic issues by presidential candidates, 2024. Source: Vivvix/CMAG, with issue coding from Wesleyan Media Project. Note: Ads from Harris and Trump campaigns only.

Focus on other issues by presidential candidates, 2024. Source: Vivvix/CMAG, with issue coding from Wesleyan Media Project. Note: Ads from Harris and Trump campaigns only.
For economic issues, by and large, Trump had a disproportionately higher focus on the cost of living (i.e. inflation), which was a prominent feature of his ads throughout the general election, taxes (especially in the closing weeks), minimum wage, jobs, and more general references to the economy. Harris focused more on housing issues early in the general election campaign, but Trump put disproportionate focus on the issue in late September and early October.
For other issues (Figure 9), we see clear disparities between the campaigns. Harris closed out the campaign in the final three weeks with a blitz of ads on abortion (featured in 40–60 % of her spots in that period) and Social Security (appearing in 40 % of her airings in the final two weeks). Her mentions of a large number of other issues, however, bottomed out at the end of the campaign, though at various points in the closing weeks she pivoted to mentions of the military and veterans (largely highlighting former Trump officials and military leaders concerned about his leadership as Commander in Chief) as well as domestic violence, crime (in the final week), and Medicare.
Trump, on the other hand, closed the campaign with a renewed focus on immigration (which was his focus in the early part of the general election) and a blitz of ads on the military. For a brief period in early October, he highlighted crime, incarceration, and issues related to transgender people. This cluster of issues largely reflected a brief but intense ad buy criticizing Harris for prior statements about rights for transgender prisoners that included a tagline stating that “Kamala Harris is for they/them. Donald Trump is for you.” Many prognosticators suggested these ads were likely very persuasive. Still, the ads did not appear in high volume on broadcast television for more than a few weeks. (We show below, also, that the issue appeared in a number of Senate races, and we know that it also appeared in digital ads.).
Moreover, we looked for evidence that Trump focused on the issue of transgender rights in particular markets. This did not appear to be the case. In media markets where he did mention the issue (87 in total), the issue appeared in between 10 and 20 % of his total ad spots in that market. (In three markets it was featured in 40 % of his airings, but these were markets with small ad volumes overall.) Nor is there evidence that Trump used the ads in disproportionate amounts in his national buys. Of all his national network and national cable spots, he mentioned Harris relative to transgender rights in just 12 % of them.
One issue that does not appear in our issue battery is the concept of democracy. Many of Harris’ ads suggested that Donald Trump was a possible threat to democracy (e.g. the ad highlighting former Trump officials characterized him as unfit to hold office), though these concerns were expressed more often in the form of policy-based attacks on Trump as opposed to explicit references to the health and future of American democracy in a second Trump administration. We used Automatic Speech Recognition to extract the text of each unique presidential ad, and we searched the transcripts for mentions of the words democracy, fascist (and fascism), authoritarian, and dictator. We did not find high rates of explicit mentions of these concepts in the general election. Across all pro-Harris ads, only 2.7 % of ad airings mentioned these concepts. One notable difference we did find, however, was between Harris ads and Biden-sponsored ads earlier in the cycle. Biden used the word dictator in 26 % of his ad airings, compared to just 2.5 % of spots from the Harris campaign.
Another topic that does not appear in our issue battery is discussion of Project 2025. One in ten (10.6 %) pro-Harris ads during the general election contained a reference to Project 2025 and its implications. The focus on Project 2025 came nearly exclusively from the Harris campaign itself, which sponsored 50,656 of the 50,851 total airings mentioning it (195 airings were sponsored by AB PAC). In fact, discussions of what Project 2025 policy implications would mean for the average American comprised 15.5 % of the ads sponsored by the Harris campaign, with the majority of mentions coming in two periods (late August/early September and again in the final 10 days of October).
1.6 An (Early) Estimate of Ad Effects
An obvious question about the scale of advertising in the presidential race is its likely effect on the outcome of the election. All told, Vice President Harris spent more money than Donald Trump on television and radio advertising, an advantage that grows when you include known digital spending, but she lost the election, including the popular vote. Teasing out the causal effects of spending on television, radio, digital platforms, and connected television apps, plus printed mail, email, and the in-person ground game is difficult. We can, however, utilize the incongruence between media markets and state boundaries to isolate the effect of broadcast ads from other forms of campaigning (Huber and Arceneaux 2007; Krasno and Green 2008). Indeed, many local media markets cross state boundaries, such as the Philadelphia market reaching into New Jersey and the Boston media market reaching into New Hampshire. As such, some counties in non-battleground states are in battleground media markets, meaning residents in those counties “accidentally” receive significant numbers of broadcast ads. The assumption is that presidential campaigns do not target voters in non-battleground states, making the spillover of broadcast spots the most significant exposure those non-battleground voters get to the campaign.
We take that approach here, though rely on a fairly limited model given that we lack data on presidential visits to media markets and data on the location of field offices. Presidential visits to media markets (e.g. Harris visits to Philadelphia) might influence local news coverage of those candidates (and television news stations broadcast to all counties in the media market), which, in turn, might also influence how non-battleground counties experience the campaign. Field offices have been shown to be helpful to campaigns in getting out the vote (Darr and Levendusky 2014). Despite these omissions, we do control for county demographics and education, as well as for the county’s prior support for President Biden in 2020, and we estimate the models with state-level fixed effects. We run the model with two different measures of the air war: 1) Harris ads minus Trump ads in the general election period between July 22 and Election Day; and 2) Harris ads minus Trump ads from October 1 to Election Day, knowing from prior work that ad effects are somewhat short-lived (Gerber et al. 2011). We show the results of both models in Table 4, excluding the seven consensus battleground states: Arizona, Georgia, Michigan, Nevada, North Carolina, Pennsylvania, and Wisconsin.
County-level effects of ad volume in presidential election (Non-battleground states).
| DV: Harris ‘24 % minus Biden ‘20 % | Coeff | t-score | Coeff | t-score |
|---|---|---|---|---|
| Harris ads minus Trump ads (000s) (7/22 to Elect day) | 0.0823 | 2.02 | ||
| Harris ads minus Trump ads (000s) (10/1 to Elect day) | −0.0253 | −0.22 | ||
| Biden % in 2020 (0–100) | −0.0227 | −6.35 | −0.0222 | −6.20 |
| White % of population (0–100) | 0.0159 | 3.73 | 0.0162 | 3.81 |
| Black % of population (0–100) | 0.0125 | 2.66 | 0.0127 | 2.69 |
| Hispanic % of population (0–100) | −0.0428 | −9.73 | −0.0425 | −9.67 |
| % With College degree or higher (0–100) | 0.0656 | 16.75 | 0.0652 | 16.65 |
| Constant | −2.7227 | −6.39 | −2.7571 | −6.47 |
| State-level fixed effects | Yes | Yes |
-
Data on county-level demographics are from the 2020 Census. Vote results are from Dave Leip’s Political Atlas. Ad data are from Wesleyan Media Project.
The results suggest no significant effect for ad spots in the final four weeks of the campaign, but a significant effect of ads in the full general election period. Our dependent variable in the model is Harris’ percentage of the vote minus Biden’s percentage in 2020. An additional 1,000 ad airings for Harris, holding Trump’s totals constant, improves the vote for Harris by 0.08 % points. The ad advantage measure has a standard deviation of 1,350 ads. A one standard deviation increase in Harris’ ad advantage in the full general election period improves her vote by 0.104 points, which is about 9 % of the decline in her vote share compared to Biden in 2020 in the average county (−1.1 points). This is a small effect, but it suggests that in places where Harris out-aired Trump, she performed better.
The null effect for the October buys suggests that late efforts from Harris and Trump were less effective in moving the vote. Moreover, the correlation of Trump and Harris ads by market in the full general election period was 0.98, identical to the correlation between Harris and Trump ads in the October period (We showed this in Figure 5 above. The two campaigns were generally both in the same markets with comparable ad totals.). However, the correlation of the Harris ad advantage by market in the full general election with her advantage in October is 0.67, meaning that each candidate out-aired the other at different levels and in slightly different places across the two time periods. It was the total cumulative advantage in the market that was statistically related to the outcome.
1.7 Congressional Races
In the U.S. Senate, Republicans picked up four seats. Three of those were in very red states (West Virginia, Montana and Ohio), with the other one in the perennial swing state of Pennsylvania. In the U.S. House, Democrats netted one seat. It’s difficult to quantify the role of advertising in all of these races, but we can get some sense of which party’s candidates had an ad advantage in specific races.
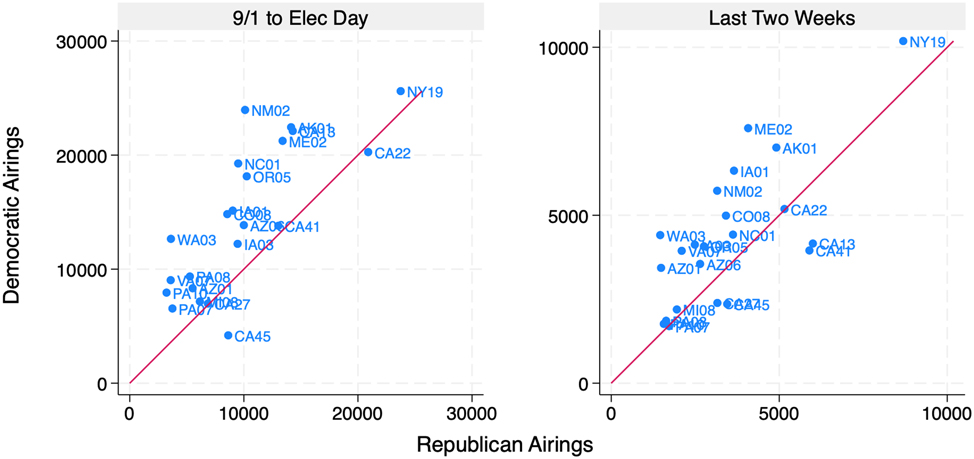
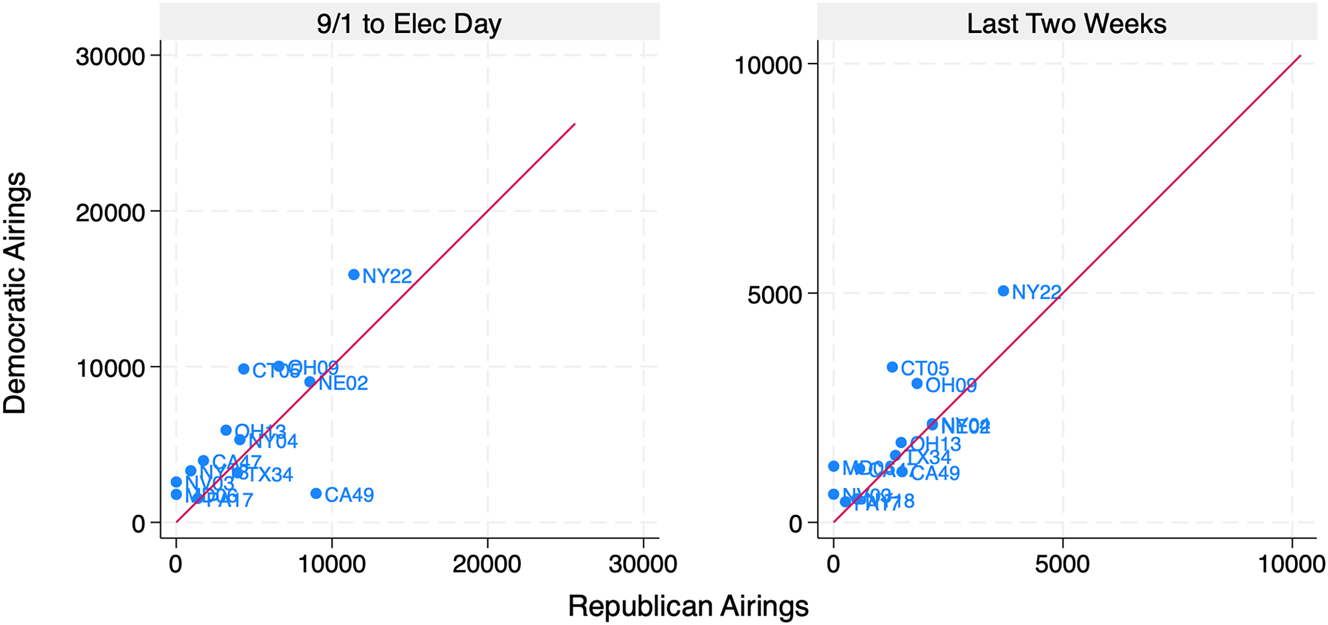
Figure 10 speaks to Senate races, showing the number of pro-Republican airings on the x-axis and the number of pro-Democratic airings on the y-axis. The left panel shows these figures from September 1 to Election Day, while the right panel shows these figures for the last two weeks of the campaign. By and large, there were more pro-Democratic ads in each of the most intense races, including Texas, Ohio, Montana, Michigan, Nevada and Arizona. The two exceptions to this rule are Wisconsin and Pennsylvania.

Ad volumes in Senate races. Source: Vivvix/CMAG. Note: Ads from candidates, parties, and outside groups included in totals. Ad spots by the independent candidate in Nebraska are included here as pro-Democratic ads.
In Wisconsin, Democratic incumbent Tammy Baldwin won by about 1 percentage point in spite of having fewer ads on the air in the final two weeks of the campaign. In Pennsylvania, Republican Dave McCormack defeated Democrat Bob Casey by 0.2 percentage points. McCormack had a slight ad advantage during the fall campaign, and the candidates benefitted from almost the same number of ads in the final two weeks of the election.
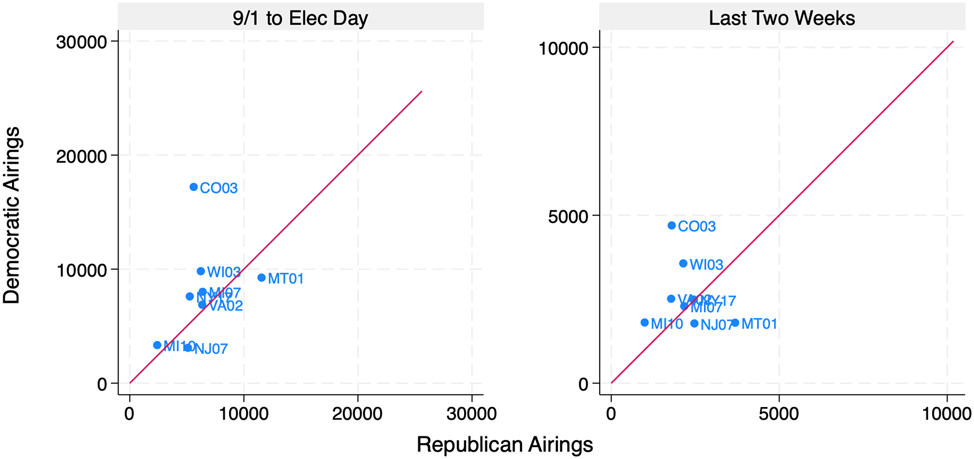
Figure 11 shows the same data for U.S. House races rated as “toss up,” using The Cook Political Report and its final pre-election race ratings. The story here is one of a Democratic advantage in nearly every highly competitive race, especially in the September 1 to Election Day period. All told, Democrats were able to hold their own in the House despite a Trump victory. That may owe, at least in part, to their ability to get their message out to voters. Still, even with an ad spot advantage in the vast bulk of competitive races, they lost 11 of the 22 campaigns included in Figure 11.
Ad volumes in “toss-up” House races. Source: Vivvix/CMAG. Note: Ads from candidates, parties, and outside groups included in totals. Ratings are from Cook Political Report in their final pre-election ratings.
We also show the pro-Democratic and pro-Republican totals for the next most competitive set of House seats, those rated as leaning toward the Democrat or the Republican (Figures 12 and 13). Democratic advantages were less pronounced in these races, though Democrats tended to air more than Republicans in races with a higher volume of ads.
Ad volumes in “Lean Democratic” House races. Source: Vivvix/CMAG. Note: Ads from candidates, parties, and outside groups included in totals. Ratings are from Cook Political Report in their final pre-election ratings.
Ad volumes in “Lean Republican” House races. Source: Vivvix/CMAG. Note: Ads from candidates, parties, and outside groups included in totals. Ratings are from Cook Political Report in their final pre-election ratings.
1.8 Tone and Content of Congressional Ads
Message volume is clearly important, but so is the content of those ads. Figure 14 shows the tone of advertising in U.S. Senate races for both the full election cycle (starting January 1 of the off-year) and the fall general election (starting September 3) for elections back to 2012.

Tone of U.S. Senate ads, 2012–2024. Source: Vivvix/CMAG, with ad tone coding from Wesleyan Media Project. Note: Ads from candidates, parties, and outside groups included in totals.
For Senate races in 2024, the fall campaign was the most negative in the time series, though by only a few points. As noted earlier, we define attack ads to be those solely about the opposing candidate; promotional (positive) ads to be those mentioning or featuring only the favored candidate; and contrast ads to be those that feature both candidates. In 2024, about 80 % of the ads aired in the fall in Senate races were either attack or contrast ads, with attack ads making up the majority of spots. For the full election cycle, the breakdown of tone was very comparable to prior cycles, though 2024 was slightly more negative than the 2018 to 2022 period. Still, the rate of negative ads in Senate races was not appreciably higher than in prior campaigns over the last decade.
We show the same breakdowns for House races in Figure 15. In general, negativity was less prevalent than in Senate races, a trend consistent across cycles. In the fall campaign period back to 2012, over 60 % of spots in House races were attack or contrast, and in 2024 negativity lagged just a bit behind 2022. The 2018 campaign featured slightly higher rates of contrast ads compared to other cycles, but the breakdowns have been fairly consistent back to 2012.

Tone of U.S. House ads, 2012–2024. Source: Vivvix/CMAG, with ad tone coding from Wesleyan Media Project. Note: Ads from candidates, parties, and outside groups included in totals.
In the Appendix, we break out pro-Democratic and pro-Republican messages by week (Figures A1 and A2) for the period between September 1 and Election Day. For ads in House races, negativity was more common as Election Day approached. For Republicans especially, positive ads declined from about 80 % of their spots in the first week of September to around 20 % in the final week of the campaign. In Senate races, attack spots for Democrats remained roughly consistent over the fall, but promotional spots declined in favor of contrast ads. For Republicans, negativity was much more common early in the fall but declined (from 70 % of pro-Republican spots through September to about 40 % in the final week of the election) in favor of contrast ads.
Beyond tone, we also looked at the top 10 issues by party for House and Senate races in the period between September 1 and Election Day. These are shown in Table 5, and they include all sponsors across all campaigns. Issue emphasis varies a lot across states and congressional districts, but we get a general sense of party priorities by collapsing across election campaigns. The data reveal a somewhat diffuse set of issue priorities. The top issue for House Democrats was abortion, featuring in 38 % of the over 550,000 spots that aired on behalf of Democrats. This is followed by health care (35 %), public safety (31 %), and prescription drugs (29 %). The federal budget and taxes were a much lower priority, and inflation did not crack the top 10 issues, appearing in only 8 % of pro-Democratic ads in House races. The pattern of issue priorities is similar among Senate Democrats, with abortion and health care the clear top issues.
Top 10 issue mentions by party in House and Senate ads (9/1 to Election Day).
| Issue | Percent | Issue | Percent | ||
|---|---|---|---|---|---|
| House | Abortion | 38.4 % | House | Public safety | 39.7 % |
| Pro-Dem | Health care | 35.4 % | Pro-Rep | Immigration | 33.3 % |
| (553,146 | Public safety | 31.1 % | (375,377 | Govt’ budget | 27.0 % |
| Airings) | Prescription drugs | 28.6 % | Airings) | Taxes | 24.9 % |
| Gov't budget | 15.1 % | Economy | 22.7 % | ||
| Taxes | 13.5 % | Inflation | 20.4 % | ||
| Immigration | 12.5 % | Oil and gas prices | 14.7 % | ||
| Social Security | 12.2 % | Drug problems | 14.7 % | ||
| Women’s rights | 11.5 % | Food policy | 12.8 % | ||
| Medicare | 11.2 % | Prescription drugs | 12.3 % | ||
|
|
|||||
| Senate | Health care | 38.6 % | Senate | Immigration | 46.4 % |
| Pro-Dem | Abortion | 35.8 % | Pro-Rep | Taxes | 33.3 % |
| (536,520 | Prescription drugs | 21.0 % | (429,463 | Gov't budget | 32.2 % |
| Airings) | Immigration | 14.9 % | Airings) | Economy | 27.1 % |
| Women’s rights | 14.4 % | Health care | 25.6 % | ||
| Social security | 13.1 % | Trans-issues | 25.4 % | ||
| Economy | 11.8 % | Public safety | 25.2 % | ||
| Medicare | 11.6 % | Inflation | 25.0 % | ||
| Taxes | 10.5 % | Social security | 15.9 % | ||
| Jobs | 9.8 % | Oil and gas prices | 15.1 % | ||
-
Source: Issue coding by Vivvix/CMAG. Totals include ads from candidates, parties, and outside groups. The numbers in bold are the total number of ad airings that fall into each category.
For Republicans, House ads were disproportionately concerned with public safety (40 %) and immigration (33 %). The budget, taxes, and the economy (as a general matter) were each a topic in about 1 in every 4 pro-Republican ad spots. Immigration was an even bigger concern for Senate Republicans. It appeared in 46 % of the 429,000 pro-Republican spots. Taxes and the federal budget were a topic in 1 in 3 ad airings. The issue of policies affecting transgender people was a topic in nearly as many spots on behalf of Senate Republicans (25 %) as were the topics of health care, the economy, public safety, and inflation.
This focus by Senate Republicans on policies related to transgender people is worth a deeper look. In Table 6, we show the list of ad sponsors mentioning the issue. It appeared in 109,000 pro-Republican ad airings between September 1 and Election Day. Of the sponsors listed in Table 6, policies affecting transgender people were a topic in 60 % of their airings. By volume, the sponsors with the biggest buys on this topic were Ted Cruz in Texas and the Senate Leadership Fund (in Ohio, Montana, Pennsylvania, and Wisconsin). The group sponsored 31,000 spots in the Ohio Senate race, for example, and every one of the spots (across 10 unique ads) featured the topic. For example, in one ad that aired in the second half of September, Senate Leadership Fund accused incumbent Sherrod Brown of “allowing men in women’s locker rooms” and forcing women’s domestic violence centers to “accept transgender biological men.”[12]
Senate Republican sponsors of ads on trans-gender issues (9/1 to Election Day).
| Sponsor | State | Ads from sponsor on issue | Total ads from sponsor in race | Total pro-GOP ads in race | % from sponsor on issue | % of pro-GOP ads in race |
|---|---|---|---|---|---|---|
| American Crossroads | PA | 178 | 2,733 | 44,545 | 6.5 % | 0.4 % |
| Brown, Sam | NV | 970 | 2,634 | 18,559 | 36.8 % | 5.2 % |
| Brown, Sam & Nevada Victory Committee | NV | 816 | 3,347 | 18,559 | 24.4 % | 4.4 % |
| Cruz, Ted | TX | 17,357 | 20,919 | 39,761 | 83.0 % | 43.7 % |
| Cruz, Ted & Republican Party of Texas | TX | 3,563 | 3,563 | 39,761 | 100.0 % | 9.0 % |
| Fix Washington PAC | WI | 3,121 | 4,130 | 39,875 | 75.6 % | 7.8 % |
| Frontiers of Freedom Action | AZ | 6 | 6 | 11,978 | 100.0 % | 0.1 % |
| GLFC, Inc. | MI | 430 | 3,792 | 29,696 | 11.3 % | 1.4 % |
| Hawley, Josh | MO | 3,148 | 5,898 | 6,594 | 53.4 % | 47.7 % |
| Hovde, Eric | WI | 66 | 7,333 | 39,875 | 0.9 % | 0.2 % |
| Hovde, Eric & NRSC | WI | 5,234 | 14,341 | 39,875 | 36.5 % | 13.1 % |
| Rogers, Mike & Michigan Victory Committee | MI | 2,091 | 9,609 | 29,696 | 21.8 % | 7.0 % |
| Rogers, Mike & NRSC | MI | 1,302 | 4,867 | 29,696 | 26.8 % | 4.4 % |
| Senate Leadership Fund | OH | 31,132 | 31,132 | 79,032 | 100.0 % | 39.4 % |
| Senate Leadership Fund | MT | 12,915 | 24,268 | 78,201 | 53.2 % | 16.5 % |
| Senate Leadership Fund | PA | 7,142 | 16,620 | 44,545 | 43.0 % | 16.0 % |
| Senate Leadership Fund | WI | 4,607 | 4,607 | 39,875 | 100.0 % | 11.6 % |
| Senate Leadership Fund | NV | 893 | 893 | 18,559 | 100.0 % | 4.8 % |
| Sheehy Victory Committee | MT | 2,804 | 2,804 | 78,201 | 100.0 % | 3.6 % |
| Truth and Courage PAC | TX | 6,512 | 6,512 | 39,761 | 100.0 % | 16.4 % |
| Win It Back PAC | TX | 4,542 | 5,496 | 39,761 | 82.6 % | 11.4 % |
| Win It Back PAC | AZ | 468 | 5,451 | 11,978 | 8.6 % | 3.9 % |
| Total | 109,297 | 180,955 | 348,241a | 60.4 % | 31.4%a |
-
aTotal pro-GOP ads in Senate races included above. Percent in the final column is total ads on issue from pro-Republican sponsors divided by total pro-GOP ads in Senate races included above. Source: Vivvix/CMAG.
All told, the issue of policies related to transgender people was most prominent in the Senate campaigns in Texas, Wisconsin, and Ohio. If we combine the sponsor percentages in Table 6 in those states (the far right column in the table), the issue appeared in 39 % of pro-GOP ads in Ohio (all from Senate Leadership Fund), 33 % in Wisconsin, and 80 % of Republican spots in the Texas race. Across all of the Senate races where the issue appeared, nine states in total, the issue was mentioned in 31 % of pro-GOP spots.
1.9 Outside Groups
Ad sponsorship is another big component of a broad overview of political advertising. Ever since the Citizens United Supreme Court decision in 2010, outside groups have grown in importance as ad sponsors. In Figure 16 we show the percentage of ads from outside groups in the full cycle for all federal races, including for president.

Outside group ads in federal races, 2000–2024. Source: Vivvix/CMAG. Note: Party totals do not include coordinated ads with candidates. Presidential ads are included during presidential election cycle years.
Before 2010, outside groups aired between 5 and 10 % of federal spots. These investments in advertising (back to the 1990s, before comparable ad frequency data were available) were the subject of much scrutiny, inspiring the McCain-Feingold reforms in 2002 and inducing concern after those reforms about loopholes for some types of groups, namely, so-called “527s” (Franz 2008; Skinner 2005). However, since Citizens United the pace of outside group spending has expanded significantly, to nearly 30 % of all federal ads between 2012 and 2020 and exceeding 33 % of federal ads in 2022 and 2024.
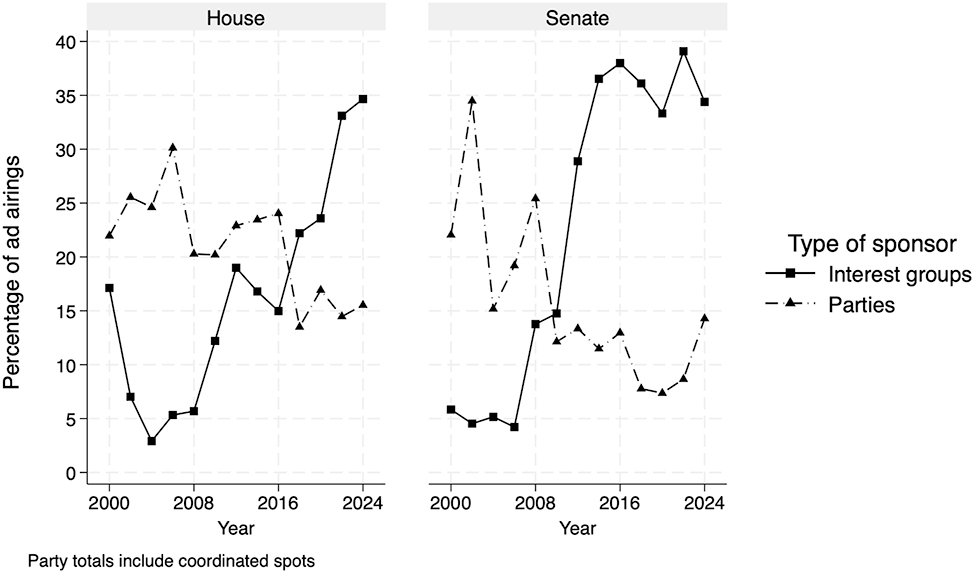
In the Appendix, we break out these totals by House and Senate, showing that groups sponsored 35 % of U.S. House ads in 2024, an all-time high, and they sponsored a similar proportion in Senate races, though below the high point in the time series in 2022 (39 %). For Senate races, outside groups have sponsored over 1 in every 3 Senate ads in each cycle since 2014. Before 2022, the previous high for House races was about 23 % in 2020.
The aggregate figures that we report include (in the denominator) all House and Senate ads in all races for the full election cycle. If we limit the analysis to ads aired between September 1 and Election Day, and look at ad totals by competitiveness, it is clear that group investments are higher in closer races. We rely on The Cook Political Report for ratings, using their final pre-election assessment. In “toss-up” races for the U.S. House, outside groups sponsored 39 % of all broadcast spots between September 1 and Election Day. They sponsored 30 % of ads in “Lean Republican” races and 29 % in “Lean Democratic” seats. In “toss-up” U.S. Senate races, groups aired 48 % of broadcast spots, and they sponsored 37 % of ads in races leaning to the Democratic or Republican parties.[13]
We also show in Figure 16 the rate of ad sponsorship by formal party organizations such as the Democratic National Committee, the Democratic Congressional Campaign Committee, and the National Republican Senatorial Committee. The totals shown in the graph are for independent expenditures only.[14] In 2024, party sponsorship of ads bottomed out at around 3 % of all federal ads in the cycle. This represents a steep drop from the nearly 30 % of ads they sponsored in 2000, when parties were able to use “soft money” funds.
In the Appendix (Figure A3), we provide a more complete picture of party advertising by combining party independent and coordinated expenditures for the House and Senate. In 2024, parties either jointly with candidates or independent of them sponsored about 15 % of ads in House and Senate races. Combining these with group-sponsored ads means 50 % of the ads in congressional races in 2023-24 were funded in full or in part by entities other than candidates. This has generally been the rate of non-candidate spending in Senate races back to 2014 (based on the Figure A3 in the Appendix), but the combined party and group totals in House races in 2024 represents an all-time high.
American politics is often considered a “candidate-centered” system, in that candidates are understood as the primary drivers of campaign messaging and strategy (Arbour 2014; Barker, Lawrence, and Tavits 2006; Wattenberg 2013), with parties considered more “in service” to candidates. The presence of outside groups, however, and their capacity to influence the dialogue in campaigns, complicates this general understanding.[15] Also, as we note below, many outside groups are closely linked to party elites, elevating their role in campaigns beyond what is suggested by looking solely at the formal party organizations.
To that point, outside groups come in many different types, from traditional political action committees (PACs) to Super PACs, non-profit 501c groups, 527s, and the more recent Carey PAC.[16] A Carey PAC is sometimes referred to as a Hybrid PAC, in that the committee can maintain both a traditional PAC and a parallel Super PAC, though the group must run these accounts separately.[17] We partnered with OpenSecrets to label each group that sponsored broadcast television ads in federal races back to 2000. The breakdown of group type by ads aired in each cycle is shown in Figure 17.
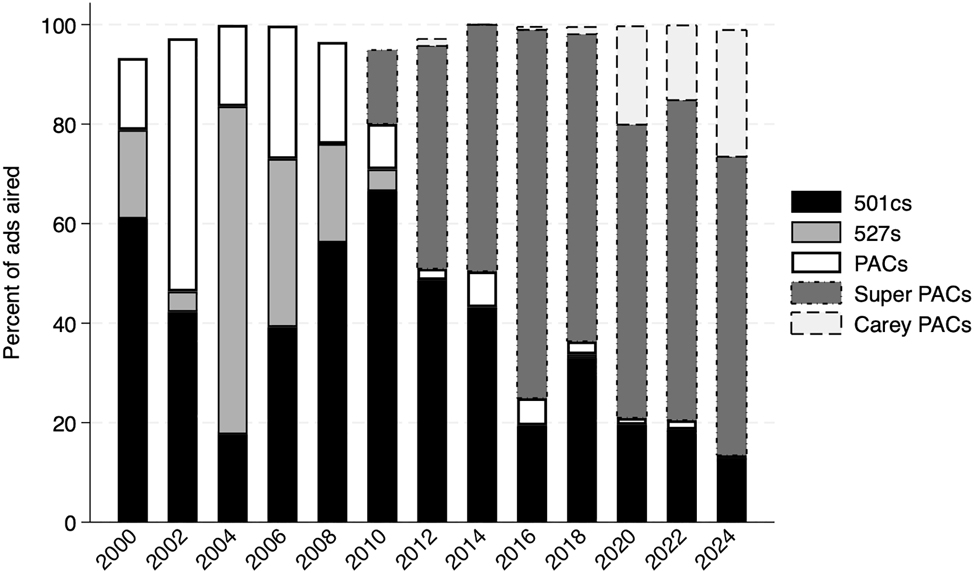
Outside group ads by type in federal races, 2000–2024. Source: Ad airings are from Vivvix/CMAG; group classifications provided by OpenSecrets.
A few key findings stand out. First, Carey PACs have grown in relevance in recent cycles. They accounted for about 25 % of group-sponsored ads in 2024. Second, Super PACs remain the biggest sponsor of group ads. Traditional PACs and 527s–both relevant between 2000 and 2008–are no longer significant ad sponsors in federal races. Finally, 501c groups, often referred to as “dark money” groups, sponsored just 12 % of group ads in 2024, their lowest share in the full time series back to 2000. Indeed, they act more as funders of Super PACs and Carey PACs than as ad sponsors directly.
Additionally, and as noted, a hardline distinction between outside groups and party committees is not really fair. Many of the largest outside groups are in effect (if not in fact) extensions of the Democratic and Republican parties given their leadership and close affiliation with party insiders. We show in Table 7 the top 20 outside groups active in federal and gubernatorial campaigns between September 1 and Election Day. We label their group type, and also whether they fully or partially disclose their donors. Partial disclosure groups are those that accept significant sums from dark money groups.
Top 20 groups in federal and gubernatorial campaigns (9/1 to Election Day).
| Sponsor | Party lean | Group type | Disclose donors | Races | Ad airings |
|---|---|---|---|---|---|
| WinSenate | Dem | Super PAC | Partial | Sen-AZ, Sen-MD, Sen-MI, Sen-MT, Sen-NV, Sen-OH, Sen-PA, Sen-TX, Sen-WI | 121,116 |
| Congressional Leadership Fund | Rep | Carey | Partial | AK01, AZ01, AZ06, CA13, CA22, CA27, CA41, CA45, CO08, IA01, IA03, ME02, MI07, MI08, MI10, NC01, NE02, NJ07, NM02, NY04, NY17, NY19, NY22, OH09, OH13, OR05, PA07, PA08, PA10, TX34, VA02, VA07, WI03 | 113,661 |
| House Majority PAC | Dem | Carey | Partial | AZ01, AZ06, CA13, CA22, CA27, CA41, CA45, CA47, CA49, CO08, CT05, IA01, IA03, KS03, ME02, MI07, MI08, MI10, MN02, MT01, NC01, NE02, NJ07, NM02, NY04, NY17, NY18, NY19, NY22, OH09, OH13, OR04, OR05, PA07, PA08, PA10, TX15, TX34, VA02, VA07, WA03, WI03 | 104,117 |
| Senate Leadership Fund | Rep | Super PAC | Partial | Sen-MI, Sen-MT, Sen-NE, Sen-NV, Sen-OH, Sen-PA, Sen-WI | 84,847 |
| FF PAC | Dem | Carey | Partial | Pres | 82,978 |
| Make America Great Again Inc. | Rep | Super PAC | Yes | Pres | 57,465 |
| American Crossroads | Rep | Super PAC | Partial | Sen-MT, Sen-OH, Sen-PA | 34,553 |
| Last Best Place PAC | Dem | Super PAC | No | Sen-MT | 17,390 |
| Fairshake | Dem & Rep | Super PAC | Yes | AK01, AZ06, CA22, CA27, CA40, CA45, CO08, IA03, IL13, IL17, MN02, NC01, NV04, NY03, NY18, OR05, TX15, WI01 | 17,323 |
| Preserve America PAC | Rep | Super PAC | Yes | Pres | 15,976 |
| Defend American Jobs | Rep | Super PAC | Yes | Sen-OH | 13,169 |
| Retire Career Politicians PAC | Ind | Super PAC | Partial | Sen-NE | 12,812 |
| Win it Back PAC | Rep | Super PAC | Partial | FL13, PA10, Sen-AZ, Sen-NV, Sen-TX | 12,380 |
| Keystone Renewal PAC | Rep | Super PAC | Partial | Sen-PA | 12,179 |
| Maryland’s Future | Rep | Super PAC | Partial | Sen-MD | 10,315 |
| Climate Power Action & FF PAC | Dem | Super PAC | Partial | Pres | 10,245 |
| Right for America | Rep | Super PAC | Yes | Pres | 8,225 |
| Protect Progress | Dem | Super PAC | Yes | Sen-AZ, Sen-MI | 7,439 |
| Vote Alaska before Party | Dem | Super PAC | Partial | AK01 | 7,185 |
| Project Freedom LLC | Dem | Corp | No | Pres | 7,042 |
| Total top 20 | 750,417 | ||||
| Total all groups | 875,268 |
-
Source: Vivvix/CMAG; group classifications provided by OpenSecrets.
The most active group in the fall of 2024 was WinSenate, which aired ads in nine Senate races supporting Democratic candidates. It is labeled as partial disclosure because it accepted all of its funds from Senate Majority PAC, which itself received substantial funds from Majority Forward, a 501c group that does not disclose its donor base. The top 6 groups in Table 7 are closely affiliated with either party leaders or the presidential candidates they supported.
2 Conclusions
This research represents a first-cut look at the scale and scope of the campaign information environment on television in the 2024 campaign. A few key findings stand out. First, Harris did spend more than Trump on TV and radio, but the two campaigns were very evenly matched in broadcast television spots. Second, pro-Trump ads focused on policies (by and large avoiding personal attacks on Harris), and they spent disproportionately more time on economic issues than did Harris’ ads. Trump’s focus on policies affecting transgender people was brief but intense, and Harris did not spend any time on the issue, with only brief mentions of issues related to the police. She did, however, devote significant resources to abortion rights. Voters in national exit polling indicated that democracy and the economy were their top concerns (2024). At the end of the day, Trump’s economic focus and his competitive investments on broadcast television might have helped cancel out any effects from Harris’ ads and her focus on threats from and policy consequences of a second Trump term.
Third, Democrats hammered Republicans on the air in congressional races, but what they got from that ad advantage was a mixed result. Democrats picked up one seat in the House, and while Republicans picked up four Senate seats, three of those were in very red states–and Republicans ended up losing several Senate races in states that Trump won, including Michigan, Wisconsin, Nevada and Arizona. In terms of messaging, Democrats spent more time on health care than on economic issues, and Republicans spent more time on immigration and public safety than on economic issues. Yet it remains unclear whether a different mix of messages from either party would have affected the overall outcome, say, moving a few more House races to the Democratic column and giving the party control of that chamber, or moving a few more of the closely decided Senate races into the Republican column, giving them an even more secure hold on that chamber.
Funding source: John S. and James L. Knight Foundation
Award Identifier / Grant number: GR-2023-68459
Acknowledgements
We thank the entire Wesleyan Media Project team for their time and effort in making our tracking and analysis of election advertising possible. In particular, we are indebted to Breeze Floyd who led all team efforts and to our student coding supervisors, Saul Ferholt-Kahn, Akhil Joondeph, Emmett Perry, and Cecilia Smith. We also thank our human coding team and our Delta Lab computational team. The Wesleyan Media Project partners with OpenSecrets to assess different sponsors of advertising activity, particularly outside groups and gratefully acknowledges support from the John S. and James L. Knight Foundation and Wesleyan University. The views presented here are solely those of the authors, as are any errors.
-
Research funding: This work was funded in part by John S. and James L. Knight Foundation (Award No.: GR-2023-68459).
see Figures A1–A3

Tone of U.S. House ads by week, 2024.

Tone of U.S. Senate ads by week, 2024.
Ads by outside groups and parties in congressional races, 2000-2024.
References
Arbour, Brian. 2014. Candidate-Centered Campaigns: Political Messages, Winning Personalities, and Personal Appeals. New York: Palgrave MacMillan.Search in Google Scholar
Barker, David C., Adam B. Lawrence, and Margit Tavits. 2006. “Partisanship and the Dynamics of ‘Candidate Centered Politics’ in American Presidential Nominations.” Electoral Studies 25 (3): 599–610. https://doi.org/10.1016/j.electstud.2005.09.001.Search in Google Scholar
Darr, Joshua P., and Matthew S. Levendusky. 2014. “Relying on the Ground Game: The Placement and Effect of Campaign Field Offices.” American Politics Research 42 (3): 529–48. https://doi.org/10.1177/1532673X13500520.Search in Google Scholar
Fowler, Erika Franklin, Breeze Floyd, Meiqing Zhang, Yujin Kim, Travis N. Ridout, and Michael M. Franz. 2024. “Election Advertising on Meta, Google, and Snapchat in 2024.” 22(2–3): 283–307.10.1515/for-2025-2011Search in Google Scholar
Fowler, Erika Franklin, Travis N. Ridout, and Michael M. Franz. 2016. “Political Advertising in 2016: The Presidential Election as Outlier?” The Forum 14 (4): 445–69. https://doi.org/10.1515/for-2016-0040.Search in Google Scholar
Franz, Michael M. 2008. Choices and Changes: Interest Groups in the Electoral Process, Illustrated edition. Philadelphia: Temple University Press.Search in Google Scholar
Franz, Michael M., Erika Franklin Fowler, and Travis N. Ridout. 2016. “Loose Cannons or Loyal Foot Soldiers? toward a More Complex Theory of Interest Group Advertising Strategies.” American Journal of Political Science 60 (3): 738–51. https://doi.org/10.1111/ajps.12241.Search in Google Scholar
Friedman, Wayne. 2024. “Political Ad Spending Estimated to Climb to $10.” MediaPost, https://www.mediapost.com/publications/article/397381/political-ad-spending-estimated-to-climb-to-107b.html.Search in Google Scholar
Gerber, Alan S., James G. Gimpel, Donald P. Green, and Daron R. Shaw. 2011. “How Large and Long-Lasting Are the Persuasive Effects of Televised Campaign Ads? Results from a Randomized Field Experiment.” American Political Science Review 105 (1): 135–50. https://doi.org/10.1017/s000305541000047x.Search in Google Scholar
Huber, Gregory A., and Kevin Arceneaux. 2007. “Identifying the Persuasive Effects of Presidential Advertising.” American Journal of Political Science 51 (4): 957–77. https://doi.org/10.1111/j.1540-5907.2007.00291.x.Search in Google Scholar
Krasno, Jonathan S., and Donald P. Green. 2008. “Do Televised Presidential Ads Increase Voter Turnout? Evidence from a Natural Experiment.” The Journal of Politics 70 (1): 245–61. https://doi.org/10.1017/s0022381607080176.Search in Google Scholar
NBC News. 2024. Exit Polls. https://www.nbcnews.com/politics/2024-elections/exit-polls.Search in Google Scholar
Ridout, Travis N., Erika Franklin Fowler, and Michael M. Franz. 2021. “Spending Fast and Furious: Political Advertising in 2020.” The Forum 18 (4): 465–92. https://doi.org/10.1515/for-2020-2109.Search in Google Scholar
Skinner, Richard M. 2005. “Do 527’s Add up to a Party? Thinking about the ‘Shadows’ of Politics.” The Forum 3 (3). https://doi.org/10.2202/1540-8884.1098.Search in Google Scholar
Valinsky, Jordan. 2023. For the First Time, Cable and Broadcast Makes up Less than Half of TV Viewing. CNN. https://www.cnn.com/2023/08/15/media/cable-broadcast-tv-decline-nielsen-report/index.html?utm_source=substack&utm_medium=email.Search in Google Scholar
Wattenberg, Martin P. 2013. The Rise of Candidate-Centered Politics: Presidential Elections of the 1980s. Cambridge, MA: Harvard University Press.Search in Google Scholar
Zaller, John. 1996. “The Myth of Massive Media Impact Revived: New Support for a Discredited Idea.” In Political Persuasion and Attitude Change, edited by Diana C. Mutz, Paul M. Sinderman, and Richard A. Brody, 17–78. Ann Arbor, MI: University of Michigan Press.Search in Google Scholar
© 2025 the author(s), published by De Gruyter, Berlin/Boston
This work is licensed under the Creative Commons Attribution 4.0 International License.
Articles in the same Issue
- Frontmatter
- Articles
- Prologue to 2024
- Electability and Party Power Across Party Lines
- Understanding the Message(s): Spending and Content of Political Advertising on Television in 2024
- Election Advertising on Meta, Google, and Snapchat in 2024
- From the Podium to the Press: Coverage of Kamala Harris’s 2024 Convention Address
- Pocketbook Voting in a Polarized Era: Economic Vulnerability and Anti-incumbent Voting in Presidential Elections
- The 2024 U.S. Presidential Election: Public Opinion on the Economy and Immigration Helped Return Trump to the White House, but with No Clear Policy Mandate
- The 2024 Presidential Election Through Latino Lenses: Priorities and Vote Choice
- Less White than Ever? Using Ecological Inference to Probe the Trump Coalition’s Diversity in Louisiana
- The Trump Effect: Nationalized Narratives and Congressional Outcomes in the 2024 Elections