Polypropylene/basalt thick film composites: structural, mechanical and dielectric properties
-
Ümit Alkan
 ,
Zeynep Güven Özdemir
,
Zeynep Güven Özdemir

Abstract
In this work, polypropylene/volcanic basalt rock (PP/VBR) thick film composites with different VBR powder mass ratio varying from 0.5 wt.% to 20.0 wt.% were prepared by using the hot press technique. The effects of VBR powder doping on mechanical, structural and dielectric properties of PP were investigated by stress-strain measurements, Fourier transform infrared analysis, thermal gravimetric analysis, scanning electron microscopy and dielectric spectroscopy methods. The highest tensile strength, percentage strain and energy at break were achieved for 0.5 wt.% VBR powder doped PP composite. According to the stress-percentage strain curves of the samples, it was observed that 0.5 wt.% VBR powder doping increases the mechanical performance of PP polymer. In addition, regardless of the doping concentration level of basalt powder, the real part of complex dielectric function (ε′) of all PP composites display approximately frequency independent behavior between 100 Hz and 1 MHz. On the other hand, 0.5 wt.% VBR powder doped PP composite has also the lowest dielectric constant at the vicinity of 2.7 between 100 Hz and 1 MHz. The composite also has considerably low dielectric loss which has a crucial importance for technological applications. For these reasons, PP/0.5 wt.% VBR composite with the highest tensile strength can be considered as a suitable candidate for microelectronic devices. Furthermore, the alternative current conductivity mechanism was determined as nearly constant loss due to approximately constant dielectric loss between 10 Hz and 1 MHz.
1 Introduction
Most polymers are electrical insulators and their electrical properties can be controlled by doping themselves with conductive or non-conductive particles. Especially, in recent years, many scientists have focused on developing dielectric properties of insulating polymers and obtaining new polymer matrix composites with high dielectric constant and low dielectric loss (1). On the other hand, the materials with low dielectric constant are considered as an important component of microelectronic devices. As is known, the next generation electronic devices require both the decrease in the dimension of circuits and reducing resistance-capacitance time delay, cross talk noise and power dissipation of the interconnect structure (2). Especially low dielectric materials optimize two important problems that occurred in the related circuits: (a) to prevent the leakage between wiring element of the circuitry, (b) to reduce time delay losses which arise from effective resistive-capacitive coupling (3), (4). The time delay in these integrated circuits can be decreased by reducing both the dielectric constant value of the material and wire resistivity. In addition, lowering the dielectric constant of the dielectric materials also helps in reducing electric field penetration depth, achieving faster switching speeds, reducing cross talk noise, etc. (5). From this point of view, the development of new low dielectric materials is important because of the possibility of assuming the role of silicon dioxide in electronic circuits. For this purpose, in the present work, low dielectric polymer/natural substance composites were prepared. Their structural, thermal and dielectric properties were also investigated for determining their suitability for microelectronic circuit applications.
In this context, polypropylene (PP), which is a kind of thermoplastic polymer resin, was chosen as the low dielectric polymer material. As is known, PP has been extensively utilized in consumer goods and in industry as a fiber and a structural plastic (6) due to its easy processability, great chemical and mechanical attributes (7). However, there is an expanding desire for reinforcing PP’s thermal stability, mechanical performance and dielectric properties by preparing various PP-based polymer matrix composites. For example, Dang et al. succeeded in increasing the dielectric constant of pure PP by using Bi2S3 nano rods as fillers. They obtained the highest ε′ values for an 8% Bi2S3 doped PP nano composite. For the higher Bi2S3 doped PP based nano composites, the ε′ values decreases (8). Very recently, Courderc et al. fabricated PP/Silica nano composites and investigated their thermal and dielectric properties. According to their TGA results, the temperature at which the mass reduction reaches 5% increases with increasing the silica content. On the other hand, they showed that dielectric constant of the composites increases for higher silica doping rates (9).
For the last 20 years, natural fibers have been extensively utilized as an alternative filler material for polymer composites (10), (11). Among natural fillers, basalt, which is a natural substance found in volcanic regions, has remarkable properties such a low cost, sustainability, high mechanical strength, excellent sound and thermal insulation, is non-flammable and has biologically stability, etc. (12), (13). For instance, Zhanga et al. showed that basalt fibers play an important role on the improvement of the mechanical properties of poly(butylene succinate) (PBS) composites. They managed to enhance the tensile and flexural properties of the PBS matrix resin by increasing the fiber loading in the composites (13). For to this reason, as it is a natural dopant material for PP-based composites, volcanic basalt rock (VBR) powder was selected in this work.
In this context, this work was devoted to both decrease the dielectric constant of pure PP by doping natural basalt powder and to achieve high mechanical stability. For this purpose, PP/VBR thick film composites were prepared by using different weight percentages of basalt powder.
2 Materials and methods
2.1 Materials
PP was supplied from Petkim Industry (Turkey). The melting temperature of PP is 165°C and the density is 0.905 g/cm3.
VBR was collected from Van City in Turkey. The chemical analyses of the VBR powder was already been identified by X-ray fluorescence (XRF) measurements performed by the equipment model X-123SDD from AMPTEK (Bedford, MA, USA) in our previous work (8). The chemical content of the VBR powder is given in Figure 1. According to Figure 1, the sample contains 41.668% SiO2 and 6.998% (Na2O+K2O).
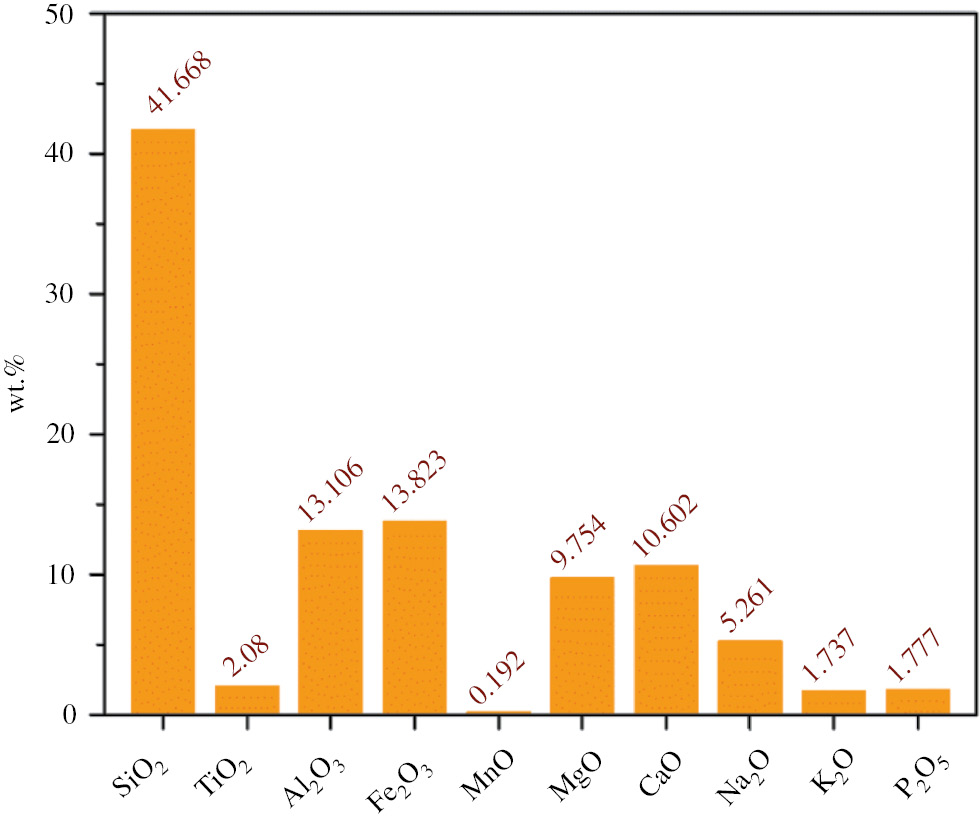
Chemical composition of the samples.
As is known, the classification of rocks is largely based on two diagrams: quartz, alkali-feldspar, plagioclase, and foids (QAPF) diagram for plutonic rocks and the total alcali silica (TAS) diagram for volcanic rocks. According to the TAS classification of the volcanic rocks, if the rock contains SiO2 between 41% and 45% and has (Na2O+K2O) content less than 7% (w/w), the sample is considered as “tephrite basanite”. From this point of view, the VBR powder used in this work was determined as “tephrite basanite”.
The particle size distribution of VBR, 10% of the particles’ size is smaller than 1.905 μm, 50% of the particles’ size is smaller than 17.378 μm, and 90% of the particles’ size is smaller than 60.256 μm (measured by a Mastersizer, Malvern Hydro 2000MU, Malvern Instruments, UK).
2.2 Preparation of PP/VBR thick film composites
VBR was mechanically doped to PP with different weight percentages (varying from 0.5 wt.% to 20 wt.%) to obtain the PP/VBR mixtures. Then the mixtures were ground with IKA A11 in a basic analytical mill with the rotational speed of 10,000 rpm. The process of grinding was performed in a chamber with a volume of 250 ml by using 30 mm steel balls. The mixing time per sample was 15 min. After the grinding process, each mixture becomes a homogeneous powder form with the maximum grain size of 10 mm. The powder forms of the composites were compressed by an electrical heated press. The hot press procedure included two steps. The first step was the pre-heating of the samples at 438 K for 20 min. The second step was the compression of the samples at 438 K for 10 min under 15 MPa pressure. The thickness of the samples prepared were between 71 μm and 100 μm. Finally, the thick films of pure PP, PP/0.5 wt.% VBR, PP/1.0 wt.% VBR, PP/5.0 wt.% VBR, PP/10.0 wt.% VBR, PP/20.0 wt.% VBR were cooled in a flow of cold water. The preparation process of the thick film composites are given schematically in Figure 2.
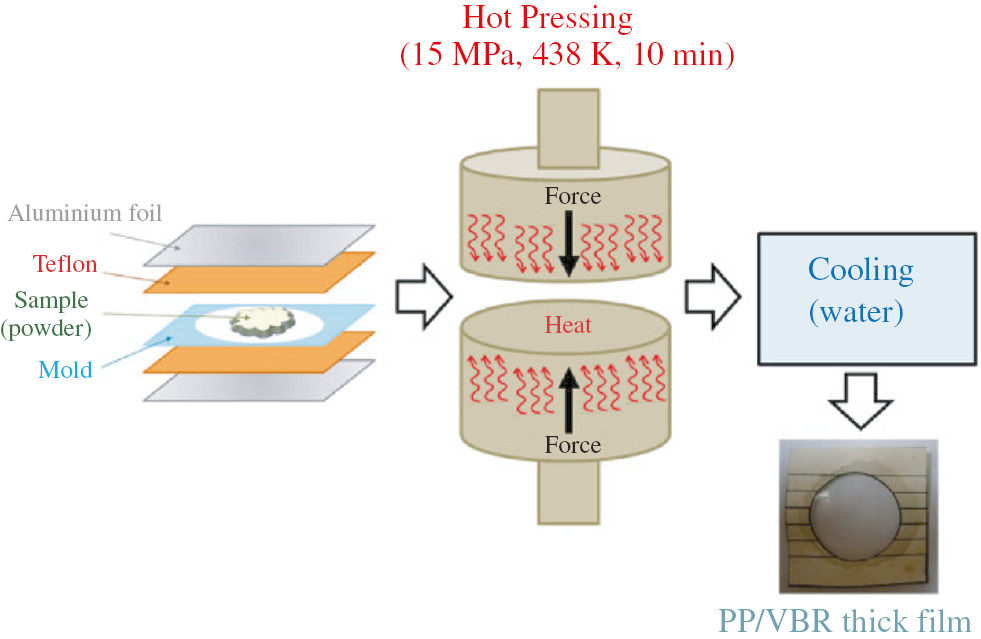
Schematic representation of the preparation process of PP/VBR thick film composites.
2.3 Fourier-transformation infrared (FT-IR) spectroscopy measurements
Fourier-transform infrared (FTIR) spectroscopy analyses of the PP/VBR thick film composites were performed using a Perkin Elmer Spectrum 400 FTIR spectrometer. All spectra of the samples were taken between 4000 and 400 cm−1 wave number, with a resolution of 2 cm−1 after four scans. The FTIR measurements were performed in the transmittance mode.
2.4 Thermogravimetric measurements
The thermogravimetric analyses of PP/VBR thick film composites were performed using a Perkin-Elmer Pyris Diamond thermogravimetric-dynamic temperature analyzer (TG-DTA) with programmed heating at 10°C/min from 30°C to 700°C. TG thermograms of the samples were also recorded under nitrogen atmosphere.
2.5 Scanning electron microscope (SEM) measurements
The surface morphologies of the PP/VBR composite thick film samples were determined using a Zeiss-EVO® LS 10 model scanning electron microscope (SEM).
2.6 Mechanical measurements
The mechanical properties of PP/VBR composites were evaluated using a Lloyd Instruments LF Plus Single Column Universal Materials Testing Machine according to ASTM D638-10 standard. To determine Young’s modulus, tensile strength, percentage strain, energy at the break and stiffness the crosshead speed was 50 mm/min at 23°C±3°C temperature. The thickness of PP/VBR composite films was measured using a Mitutoyo micrometer.
2.7 Dielectric measurements
Thick film composites were placed between two gold electrodes whose surfaces wholly overlapped the faces of the samples. The diameter of the cylindrical electrodes was 20 mm. Dielectric measurements were performed using an HP 4194A Impedance Analyzer between 100 Hz and 15 MHz at room temperature with a high accuracy (0.17% typ.) The results were transferred to computer with GPIB data cable and simultaneously recorded using a computer.
3 Results and discussion
3.1 Structural analysis
The typical FTIR spectra of pure PP and VBR powder are shown in Figure 3A. The assignment for transmittance bands for pure PP are listed in Table 1. As shown in Figure 3A, the characteristic VBR peaks were also observed between 600 and 1200 cm−1. The wide peak observed at around 1000 cm−1 for VBR is attributed to an asymmetric stretching of Si-O which generally occurs between 900 and 1200 cm−1 (17). The second main peak observed at 700cm−1 also corresponds to the Fe-O bonds (18). The other peaks determined at 595, 656cm−1 and 715cm−1 can be assigned to the Al-O stretching mode and symmetric bending of Al-O-H, respectively (19).
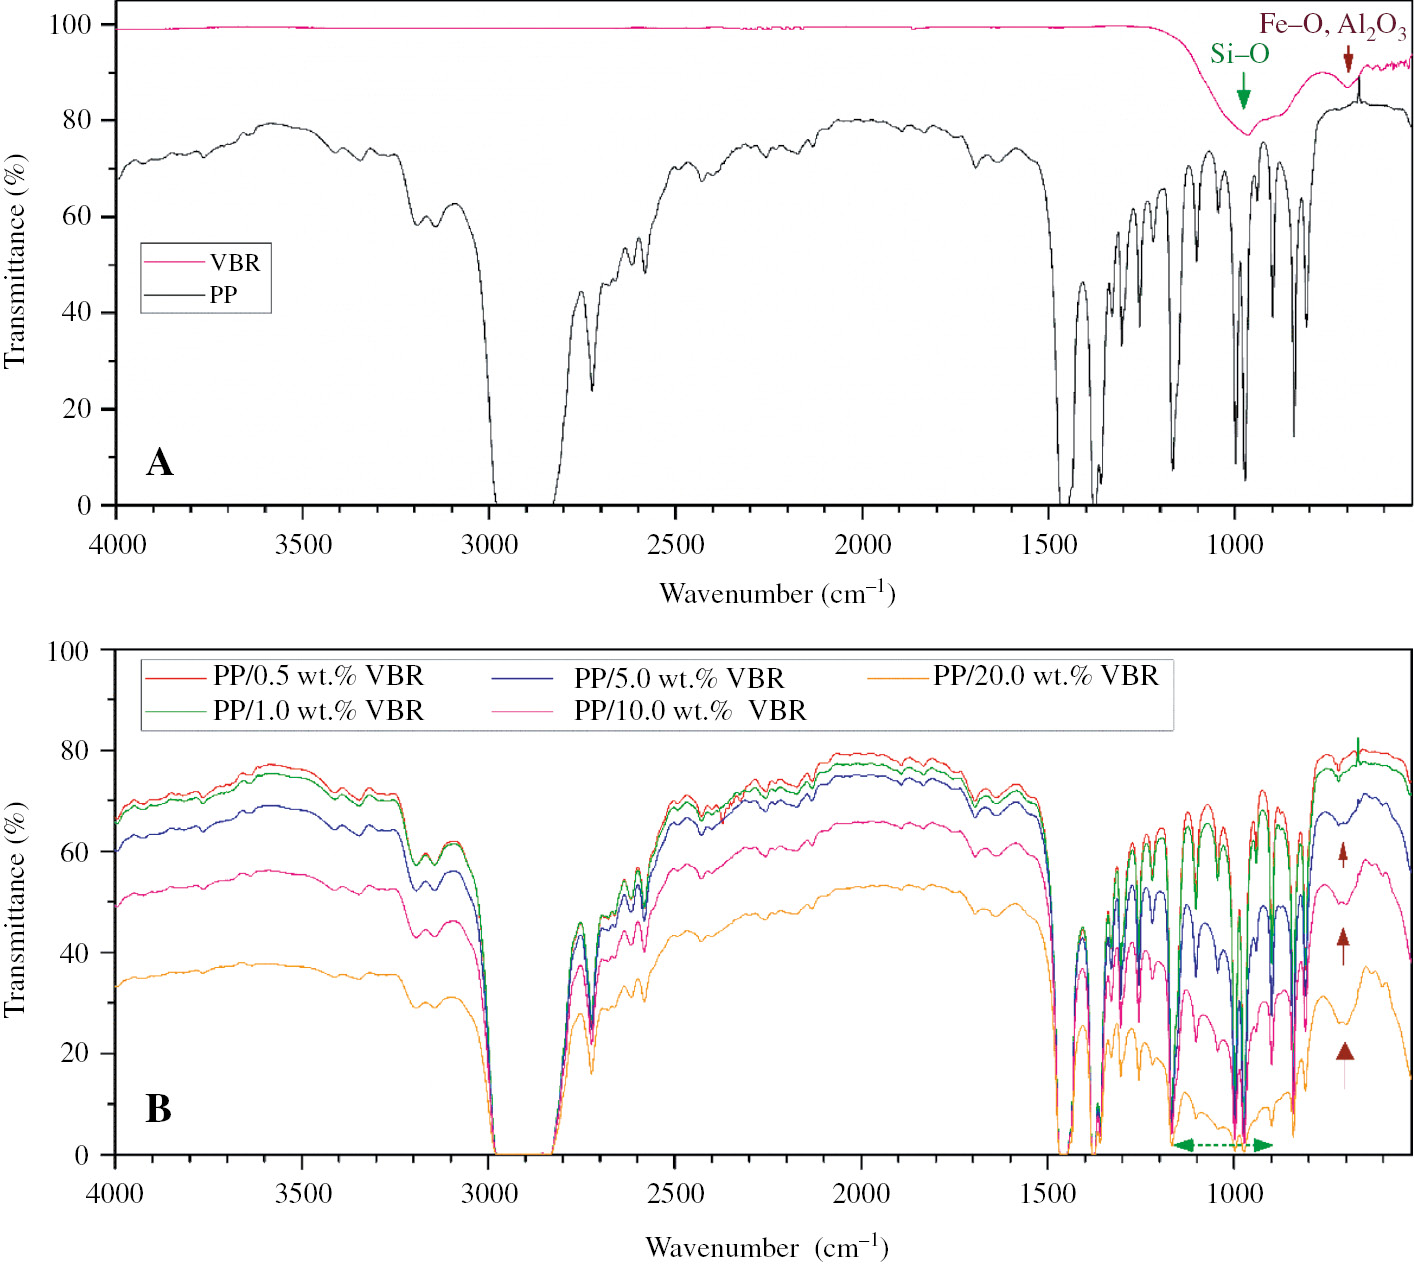
FT-IR graphics of (A) pure PP and VBR (B) PP/VBR thick film composites.
| Wavenumber (cm−1) | Type of vibration |
|---|---|
| 2959 | Asymmetric CH3 stretching |
| 2959 | Asymmetric CH2 stretching |
| 2870 | Symmetric CH3 stretching |
| 1460 | Asymmetric bending deformation CH3 |
| 1377 | CH3 Symmetric bending, CH2 wagging |
| 1168 | C-C chain stretching, CH bending, CH3 rocking |
| 998 | CH3 rocking, CH2 wagging, CH bending |
| 973 | C-C chain stretching, CH3 rocking |
| 841, 810 | CH2 rocking, C-CH3 stretching |
The FTIR spectra of PP/VBR thick film composites are shown in Figure 3B. It was observed that the characteristic peaks which identify PP between 900 and 1200 cm−1 become wider with increasing basalt doping. This effect is mainly due to increasing the SiO2 content of the composites with basalt doping. Moreover, a new peak, which was not observed for pure PP, was determined for PP/VBR composites between 650 and 750 cm−1 due to basalt additive. This new peak can be attributed to Al2O3 (715 cm−1) and Fe2O3 (700 cm−1) which are the other two components with high concentration in VBR.
3.2 Thermal analysis
The TG results of the samples are given in Figure 4. As shown in Figure 4, a one-step pattern of thermal degradation occurred for each sample approximately between 300°C and 500°C.
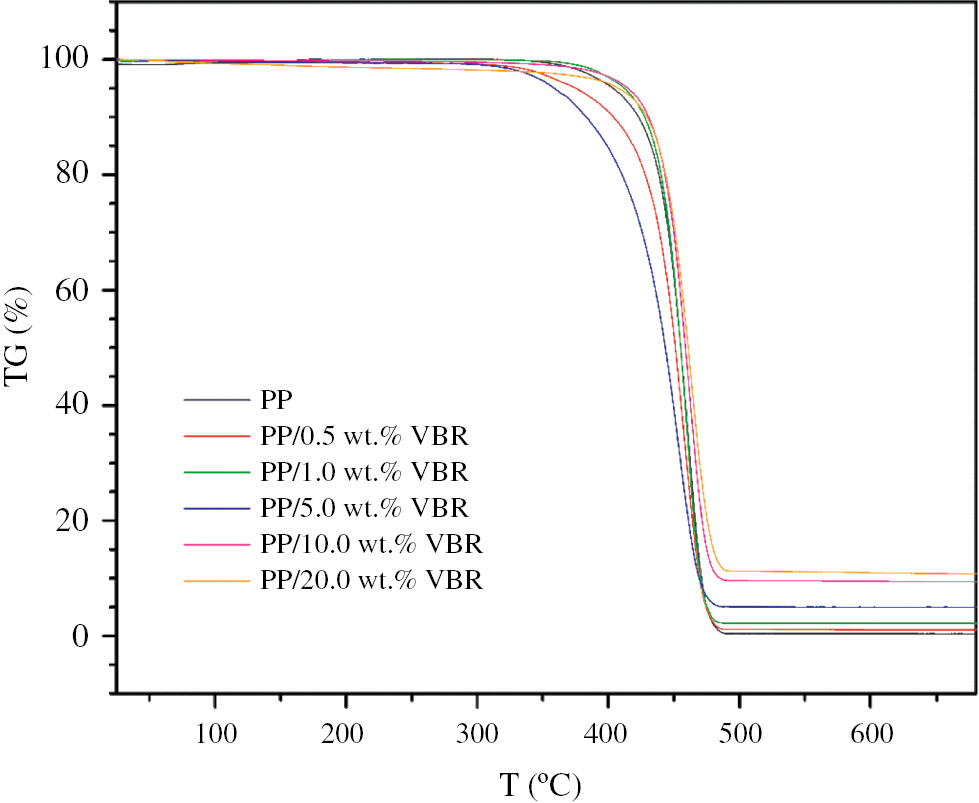
TG graphics of PP/VBR thick film composites.
According to TG results, the pure PP sample loses almost all its weight at 480°C. On the other hand, the PP/VBR composites have lower mass loss depending on the basalt content of the samples which results in the higher residue weight percentages (see Table 2). The increasing mass residue with increasing basalt content at the temperatures higher than 480°C can be explained by the fact that except for K2O and P2O5, all oxides in the basalt have very high melting temperatures (>1100°C) (see Table 3).
Residue in wt.% of pure PP and PP/VBR composites determined from Figure 4 for 480°C.
| Sample | Residue (wt.%) |
|---|---|
| PP | 1.76 |
| PP/0.5 wt.% VBR | 2.36 |
| PP/1.0 wt.% VBR | 2.87 |
| PP/5.0 wt.% VBR | 5.60 |
| PP/10.0 wt.% VBR | 11.34 |
| PP/20.0 wt.% VBR | 15.13 |
The melting points of oxides in basalt.
| Compound | SiO2 | TiO2 | Al2O3 | Fe2O3 | MnO | MgO | CaO | Na2O | K2O | P2O5 | PP |
|---|---|---|---|---|---|---|---|---|---|---|---|
| Melting point (°C) | 1600 | 1843 | 2072 | 1566 | 1945 | 2852 | 2613 | 1132 | 350 | 340 | 165 |
3.3 Morphological analysis
The SEM images of the composites are given in Figure 5. The VBR is shown in Figure 5A and PP is shown in Figure 5B while Figure 5C–G shows the PP/VBR composites. As shown in Figure 5B, pure PP with a thick film form has an almost smooth surface. It has been clearly observed that VBR powder grains are not homogenously distributed on the pure PP. This results in a surface roughness for VBR additive concentration which is higher than 1%. However, it has been determined that 0.5% VBR doping does not noticeably affect the surface morphology of pure PP. The apparent increase in surface roughness observed for the PP/VBR composites, which have a VBR content higher than 1%, causes a degradation in the mechanical properties. This prediction was also confirmed by our mechanical results.
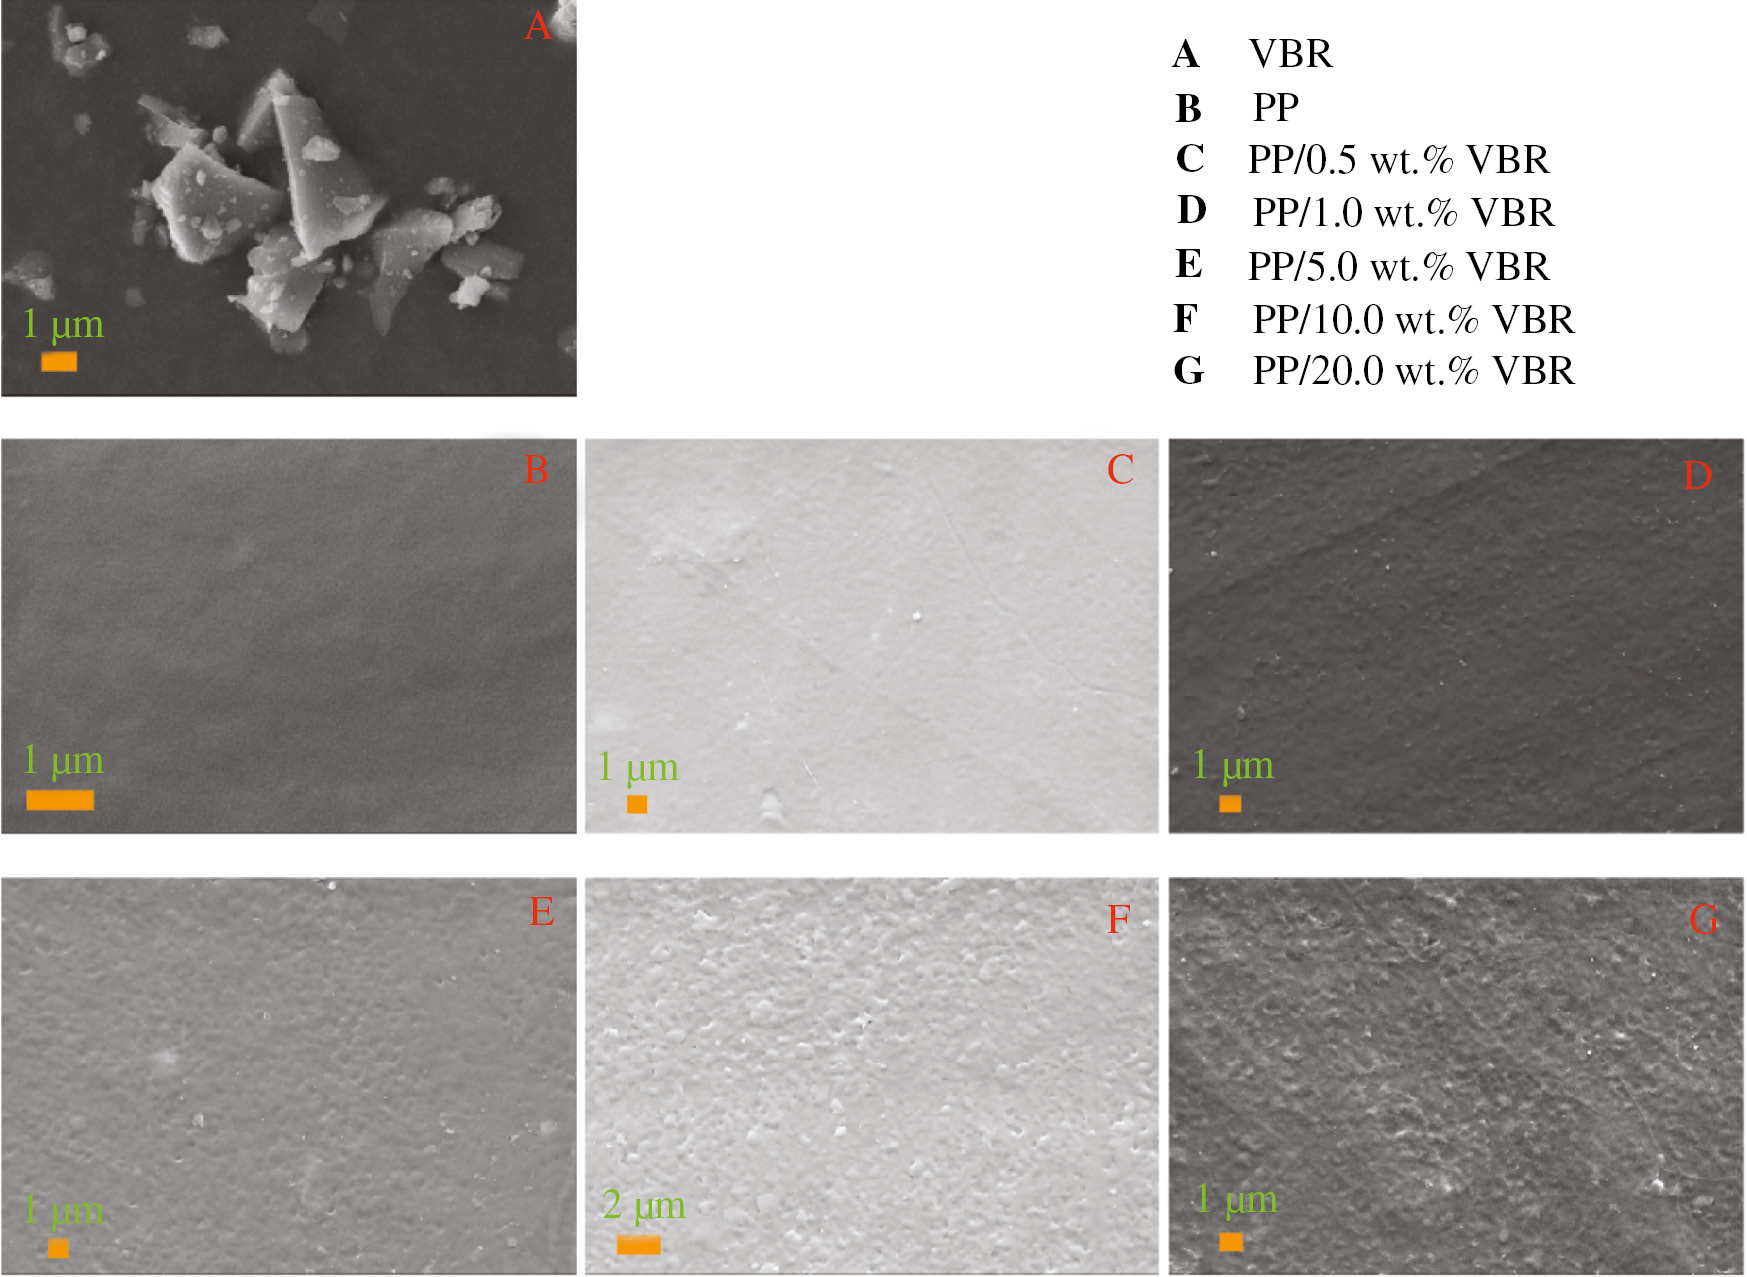
SEM images of VBR, PP and PP/VBR thick film samples.
3.4 Mechanical analysis
Stress-percentage strain curves of pure PP and PP/VBR composites are given in Figure 6. According to the initial slope of the tensile curves, Young’s modulus are calculated and summarized in Table 4.
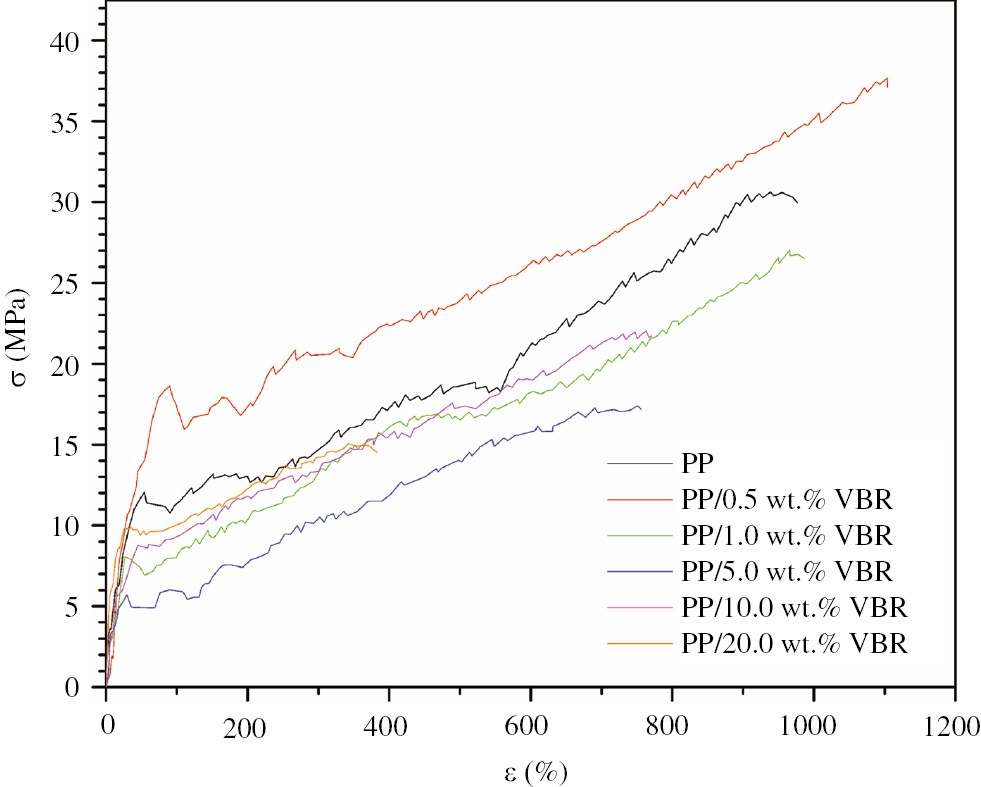
Stress-percentage strain curve of PP and PP/VBR thick films.
Variation of mechanical characteristics of PP/VBR thick films.
| Samples | Tensile strength (MPa) | Young’s modulus (MPa) | Percentage strain at break | Energy to break (mJ) | Stiffness (N/m) |
|---|---|---|---|---|---|
| PP | 30.62±1.53 | 120.68±9.02 | 976.06±58.56 | 38.28±2.32 | 6145.82±133.17 |
| PP/0.5 wt.% VBR | 37.67±2.26 | 71.74±4.71 | 1103.85±72.37 | 51.21±4.34 | 3314.60±76.25 |
| PP/1.0 wt.% VBR | 27.04±1.08 | 75.35±5.05 | 986.87±63.17 | 30.01±2.71 | 3480.99±63.54 |
| PP/5.0 wt.% VBR | 17.40±0.93 | 92.09±7.36 | 755.91±51.05 | 14.43±1.15 | 3867.64±85.71 |
| PP/10.0 wt.% VBR | 22.04±1.32 | 124.07±11.44 | 770.65±34.01 | 24.45±1.79 | 6578.69±147.08 |
| PP/20.0 wt.% VBR | 15.06±1.01 | 141.84±13.66 | 382.42±26.37 | 7.83±0.43 | 6106.27±174.57 |
The other mechanical properties including tensile strength, percentage strain and energy at break and stiffness were also determined from Figure 6 and are given in Table 4.
According to Table 4, it was determined that the mechanical properties of PP polymer is improved by 0.5 wt.% VBR doping. In other words, the highest tensile strength, percentage strain and energy at break were achieved for PP/0.5 wt.% VBR composite. Moreover, the higher than 0.5 wt.% VBR content makes the mechanical properties of PP polymer worse. In this respect, it was determined that PP/0.5 wt.% VBR composite has the optimum mechanical properties for applications. The optimum concentration percentage of VBR for achieving maximum mechanical performance for PP is also in good agreement with the general opinion for inorganic additives proposed by Boydağ et al. (20), (21), (22).
3.5 Dielectric analysis
The complex dielectric function is defined by the real and imaginary components dielectric constant:
The relation between the real and imaginary component of complex dielectric function is given by the loss factor:
The frequency dependences of the real part of complex dielectric function of thick film composites are given in Figure 7.
According to Figure 7, regardless of the VBR doping percentage, all samples exhibit almost frequency independent behavior between 100 Hz and 1 MHz. This behavior is also agreement with the scientific literature for dielectric properties of pure PP (9). It was observed that VBR doping lowers the magnitude of the real part of dielectric constant up to a critical doping percentage of 20.0 wt.% VBR. Especially, 0.5 wt.% VBR doping results in the lowest ε′ values. From this point of view, PP/0.5 wt.% VBR composite may be suggested as a low dielectric constant material for next generation of microelectronic devices. As is known, a choice of suitable low dielectric material has a crucial role on both device’s performance and lifetime (23).
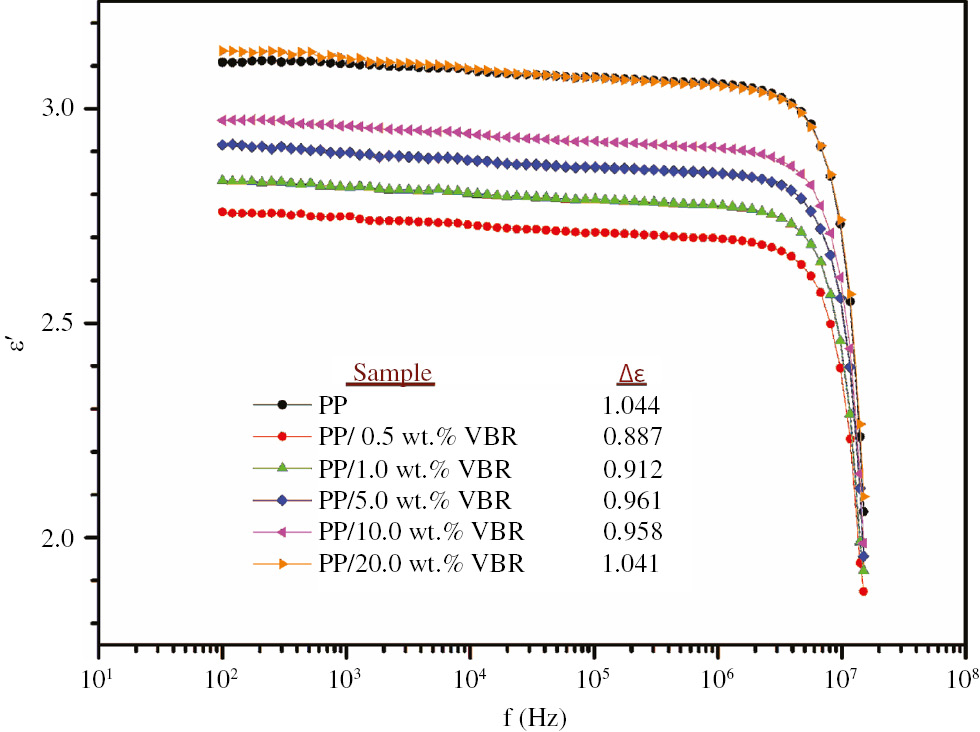
The variation of the real component of complex dielectric function of the PP based samples.
In Figure 7, the variation of dielectric strength with respect to VBR doping rate is shown in the table. The dielectric strength, Δε was calculated by Eq. [3]
where εs and ε∞ are the limiting low and high frequency dielectric constants, respectively. As shown in Figure 6, dielectric strength first decreases with increasing VBR doping and reaches its minimum value for 0.5 wt.% VBR doping concentration and then starts to increase with increasing VBR doping rate. The decrease in the value of dielectric strength for 0.5 wt.% VBR doping can be interpreted as the fact that the molecular alignment is getting easier relative to other PP thick film composites.
Figure 8 also shows the frequency dependence of the imaginary component of complex dielectric function of pure PP and PP/VBR thick film composites. According to Figure 8, the samples have considerably low dielectric loss and a relaxation peak observed at high frequency region. The relaxation frequency, fc, of pure PP at which a maximum dielectric loss was observed, shifts to higher frequencies up to 1.0 wt.% VBR doping and then fc decreases to lower frequencies with increasing VBR doping percentages (see Table in Figure 8). In addition, a sharp relaxation peak observed at 10.626 MHz for PP/1.0 wt.% VBR composite can be attributed to the occurrence of vibrational relaxation process in the material.
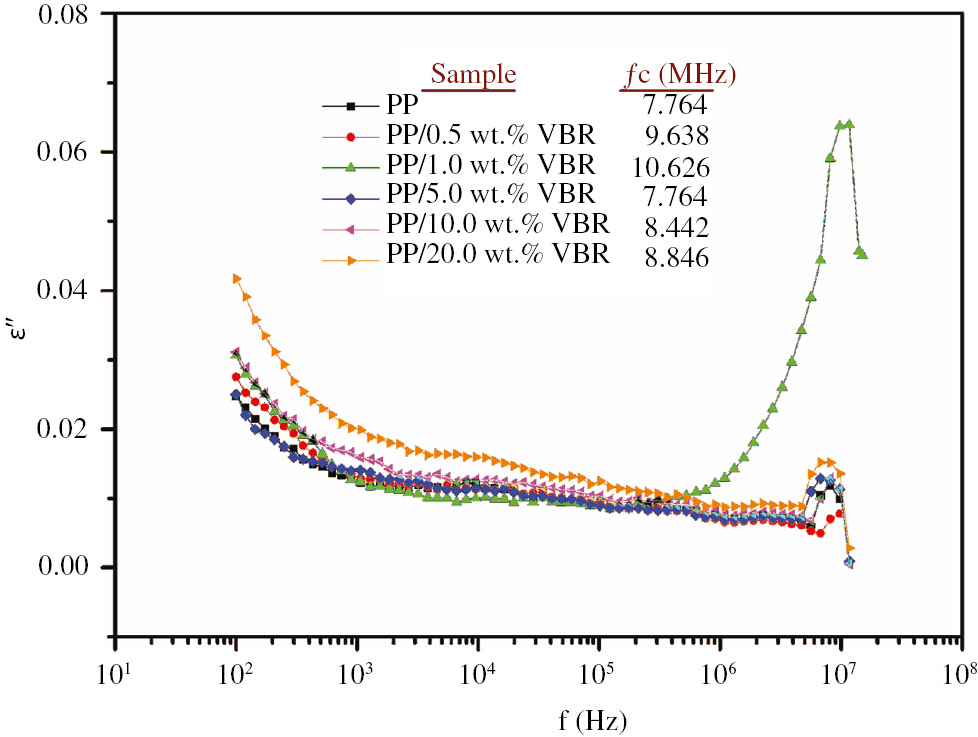
The variation of the imaginary component of complex dielectric function of the samples.
3.6 Analysis of alternative current conductivity
The frequency dependence of alternative current (ac) conductivity was investigated in terms of Jonscher’s power law defined by Eq. [4]:
where σdc corresponds to conductivity at ω=0, A is pre-exponential constant, ω is the angular frequency and s is frequency exponent which varies between 0 and 1 (24), (25), (26). “Joncher’s Power Law” was used for analysis to determine ac conduction mechanisms of wide variety of materials including solid electrolytes, amorphous solids, molten ion conductors, molecular materials, etc. (27).
The angular frequency dependences of ac conductivity of the thick film samples in natural logarithmic scale are given in Figure 9. As shown in Figure 9, σac(ω) curves of all samples show a linear increase with increasing angular frequency in ln-ln scale but no significant change on the value of ac conductivity was observed due to VBR powder doping.
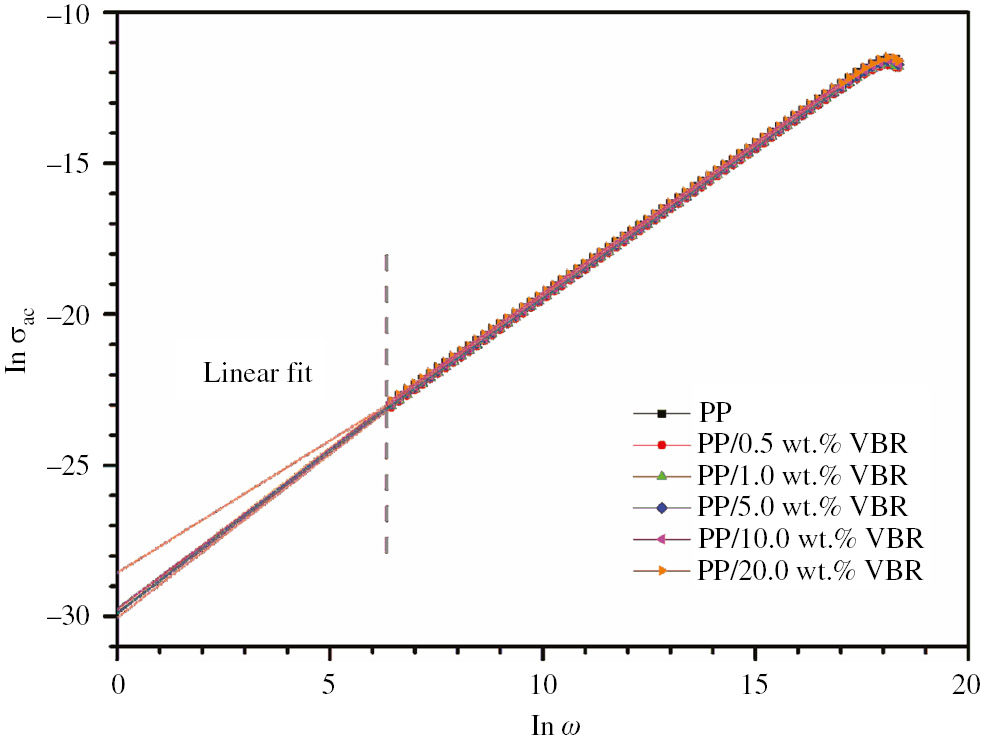
The lnσac versus frequency curves of thick film composites.
The frequency exponent value, s, was calculated by the slope of the curves given in Figure 9. The σdc values for each sample were also calculated using a linear fit performed with Origin Lab 2015. The related conductivity parameters are listed in Table 5.
Frequency exponent values of ac conductivity of the samples.
| Sample | R2 | s parameter | σdc (S/cm) |
|---|---|---|---|
| PP | 0.99995 | 0.99343 | 1.980×10⁻¹³ |
| PP/0.5 wt.% VBR | 0.99994 | 0.99222 | 1.661×10⁻¹³ |
| PP/1.0 wt.% VBR | 0.99994 | 0.99280 | 1.721×10⁻¹³ |
| PP/5.0 wt.% VBR | 0.99995 | 0.99293 | 1.794×10⁻¹³ |
| PP/10.0 wt.% VBR | 0.99995 | 0.99280 | 1.855×10⁻¹³ |
| PP/20.0 wt.% VBR | 0.99996 | 0.99208 | 2.019×10⁻¹³ |
By referring s parameter values at the vicinity of 0.99, the charge transport mechanism of the samples is suggested as the nearly constant loss (NCL) model (28). As is known, the NCL model deals with ac conductivity which depends nearly linearly on frequency. Essentially, the NCL model is the consequence of the nearly frequency independent dielectric loss just like in our case (see Figure 8).
This type of ac conductivity is generally observed for glasses and ceramics, some polymers exhibit the NCL type of ac conductivity mechanism (29), (30). Several explanations have been suggested for the origin of NLC in the scientific literature. From the microscopic point of view, this behavior may be attributed to the cooperative “jellyfish-type” movements of atom groups (31), (32), (33). According to the NCL model, angular frequency dependence of ac conductivity for PP thick film samples has two terms: σac(ω)=σdc+Aω. From this point of view, it has been proved that ac conductivity part of each PP/VBR thick films is directly proportional to angular frequency.
4 Conclusion
The present work has been devoted to preparing a new low dielectric composite material with VBR mineral doped PP. From this point of view, PP/VBR thick film composites were prepared with different VBR contents. The effect of VBR on mechanical, structural and dielectric properties of PP were evaluated by stress-strain measurements, FTIR analysis, thermal gravimetric analysis, SEM and dielectric spectroscopy methods.
It was observed that the mechanical properties of the PP improves significantly for 0.5 wt.% VBR additive. However, Young’s modulus kept rising with the increase of the VBR content, and the percentage stain showed a decreasing behavior.
It has been determined that the real part of complex dielectric function displays approximately frequency independent behavior between 100 Hz and 1 MHz regardless of the VBR doping percentages. According to the experimental measurements, the dielectric constant of PP were lowered by basalt additives up to 20.0 wt.% basalt doping rate. Especially, the modified PP with 0.5 wt.% basalt decreased the dielectric constant by approximately 13%, compared to the value of pure PP. From this point of view, the PP/0.5 wt.% VBR composite may be suggested as a low dielectric constant material for new generation microelectronic devices. Also, the ac conductivity mechanism of PP and PP/VBR composites are suggested as a nearly constant (NCL) loss model.
Acknowledgment
This work was supported by Yıldız Technical University Scientific Research Projects Coordination Department under Project number: 2015-01-01-GEP03.
References
1. Gao W, Zheng Y, Shen J, Guo S. Electrical properties of polypropylene-based composites controlled by multilayered distribution of conductive particles. ACS Appl Mater Interfaces. 2015;7:1541–9.10.1021/am506773cSearch in Google Scholar
2. Ho P, Leu J, Lee W. Overview on low dielectric constant materials for IC applications. Low dielectric constant materials for IC applications. New York, NY: Springer; 2003. 1–21 pp.10.1007/978-3-642-55908-2Search in Google Scholar
3. Gupta T. Copper interconnect technology. New York, NY: Springer Science & Business Media; 2010.Search in Google Scholar
4. Takahashi S, Imai Y, Kan A, Hotta Y, Ogawa H. Dielectric and thermal properties of isotactic polypropylene/hexagonal boron nitride composites for high-frequency applications. J Alloy Compd. 2014;615:141–5.10.1016/j.jallcom.2014.06.138Search in Google Scholar
5. Farrell R, Goshal T, Cvelbar U, Petkov N, Morris MA. Advances in ultra low dielectric constant ordered porous materials. J Electrochem Soc. 2011;20:39–46.10.1149/2.F04114ifSearch in Google Scholar
6. Dey S, Jana DK. Application of fuzzy inference system to polypropylene business policy in a petrochemical plant in India. J Clean Prod. 2016;112:2953–68.10.1016/j.jclepro.2015.09.120Search in Google Scholar
7. Kim J, Kim D. Compatibilizing effects of maleic anhydride-grafted-polypropylene (PP) on long carbon fiber-reinforced PP composites. J Thermoplast Compos Mater. 2015;28:1599–611.10.1177/0892705714563562Search in Google Scholar
8. Yu D, Yao W, Yuan D, Mao L, Zhang Y, Zhang Z-W. Enhanced dielectric properties of polypropylene based composite using Bi 2 S 3 nanorod filler. Prog Nat Sci Mater Int. 2011;21:216–20.10.1016/S1002-0071(12)60033-1Search in Google Scholar
9. Couderc H, Fréchette M, David E. Fabrication and dielectric properties of polypropylene/silica nano-composites. Electrical Insulation Conference (EIC), 2015 IEEE; 2015: IEEE. p. 329–32.10.1109/ICACACT.2014.7223615Search in Google Scholar
10. Bledzki A, Gassan J. Composites reinforced with cellulose based fibres. Prog Polym Sci. 1999;24:221–74.10.1016/S0079-6700(98)00018-5Search in Google Scholar
11. De Bruijn J. Natural fibre mat thermoplastic products from a processor’s point of view. Appl Compos Mater. 2000;7:415–20.10.1023/A:1026554610834Search in Google Scholar
12. Bhat T, Chevali V, Liu X, Feih S, Mouritz A. Fire structural resistance of basalt fibre composite. Compos Part A Appl Sci Manuf. 2015;71:107–15.10.1016/j.compositesa.2015.01.006Search in Google Scholar
13. Zhang Y, Yu C, Chu PK, Lv F, Zhang C, Ji J, Zhang R, Wang H. Mechanical and thermal properties of basalt fiber reinforced poly (butylene succinate) composites. Mater Chem Phys. 2012;133:845–9.10.1016/j.matchemphys.2012.01.105Search in Google Scholar
14. Banwell C, McCash EM. Fundamentals of molecular spectroscopy. New Delhi: Tata McGraw Hill; 1994.Search in Google Scholar
15. Farrukh MA. Advanced aspects of spectroscopy. Rijeka: InTech; 2012.10.5772/2757Search in Google Scholar
16. Türkçü HN. Investigation of the crystallinity and orientation of polypropylene with respect to temperature changes using FT-IR, WRD, and Raman techniques. Ankara: Bilkent University; 2004.Search in Google Scholar
17. Jaret SJ, Woerner WR, Phillips BL, Ehm L, Nekvasil H, Wright SP, Glotch TD. Maskelynite formation via solid-state transformation: evidence of infrared and X-ray anisotropy. J Geophys Res. 2015;120:570–87.10.1002/2014JE004764Search in Google Scholar
18. Sharma R, Lamba S, Annapoorni S. Magnetic properties of polypyrrole-coated iron oxide nanoparticles. J Phys D Appl Phys. 2005;38:3354.10.1088/0022-3727/38/18/004Search in Google Scholar
19. Djebaili K, Mekhalif Z, Boumaza A, Djelloul A. XPS, FTIR, EDX, and XRD analysis of Al2O3 scales grown on PM2000 alloy. J Spectrosc. 2015;2015:1–16.10.1155/2015/868109Search in Google Scholar
20. Boydag F, Mamedov SV, Alekperov VA, Kandemir G. A study of the optical properties of polypropylene based polymer composite films. Macromolecular Symposia, Wiley Online Library; 1999. 187–92 pp.10.1002/masy.19991460125Search in Google Scholar
21. Boydağ FŞ, Mamedov SV, Alekperov V, Özcanli YL. Optical characterization of weakly absorbing PP, PE, and PP/PE films. Opt Spectrosc. 2003;95:225–9.10.1134/1.1604429Search in Google Scholar
22. Boydağ FŞ, Özcanlı YL, Alekberov V, Hikmet İ. Temperature and time dependence of electrical and mechanical durability of LDPE/diamond composites. Compos Part B Eng. 2006;37:249–54.10.1016/j.compositesb.2005.05.014Search in Google Scholar
23. Lee HS, Lee AS, Baek K-Y, Hwang SS. Low dielectric materials for microelectronics. Rijeka: INTECH Open Access Publisher; 2012.Search in Google Scholar
24. Jonscher A. A new understanding of the dielectric relaxation of solids. J Mater Sci. 1981;16:2037–60.10.1007/BF00542364Search in Google Scholar
25. Jonscher AK. Theuniversal’dielectric response. Nature. 1977;267:673–9.10.1038/267673a0Search in Google Scholar
26. Tiwari J, Shahi K. Super-linear frequency dependence of ac conductivity of disordered Ag2S–Sb2S3 at cryogenic temperatures. Philos Mag. 2007;87:4475–500.10.1080/14786430701551913Search in Google Scholar
27. Dyre JC, Maass P, Roling B, Sidebottom DL. Fundamental questions relating to ion conduction in disordered solids. Rep Prog Phys. 2009;72:046501.10.1088/0034-4885/72/4/046501Search in Google Scholar
28. Macdonald JR. Some alternate models for nearly constant loss in conductive systems. Phys Rev B. 2002;66:064305.10.1103/PhysRevB.66.064305Search in Google Scholar
29. Ke S, Huang H, Ren L, Wang Y. Nearly constant dielectric loss behavior in poly (3-hydroxybutyrate-co-3-hydroxyvalerate) biodegradable polyester. Melville, NY: AIP; 2009.10.1063/1.3125271Search in Google Scholar
30. Natesan B, Karan N, Katiyar R. Ion relaxation dynamics and nearly constant loss behavior in polymer electrolyte. Phys Rev E. 2006;74:042801.10.1103/PhysRevE.74.042801Search in Google Scholar
31. Lu X, Jain H. Low temperature AC conductivity of oxide glasses. J Phys Chem Solids. 1994;55:1433–43.10.1016/0022-3697(94)90569-XSearch in Google Scholar
32. Nowick A, Lim B, Vaysleyb A. Nature of the ac conductivity of ionically conducting crystals and glasses. J Non-Cryst Solids. 1994;172:1243–51.10.1016/0022-3093(94)90649-1Search in Google Scholar
33. Sidebottom DL, Green PF, Brow RK. Scaling behavior in the conductivity of alkali oxide glasses, polymers, and doped crystals. J Non-Cryst Solids. 1996;203:300–5.10.1016/0022-3093(96)00362-6Search in Google Scholar
©2017 Walter de Gruyter GmbH, Berlin/Boston
This article is distributed under the terms of the Creative Commons Attribution Non-Commercial License, which permits unrestricted non-commercial use, distribution, and reproduction in any medium, provided the original work is properly cited.
Articles in the same Issue
- Frontmatter
- In this Issue
- Elastic recovery of polyamide 6 matrix nanocomposites and their basalt fiber co-reinforced hybrids
- Bio-based chitosan/PVdF-HFP polymer-blend for quasi-solid state electrolyte dye-sensitized solar cells
- Synergistic effects of retinoic acid and graphene oxide on the physicochemical and in-vitro properties of electrospun polyurethane scaffolds for bone tissue engineering
- Non-isothermal crystallization and thermal degradation kinetics of MXene/linear low-density polyethylene nanocomposites
- Extraction and characterization of chitin and chitosan: applications of chitosan nanoparticles in the adsorption of copper in an aqueous environment
- Systematic evaluation of pH and thermoresponsive poly(n-isopropylacrylamide-chitosan-fluorescein) microgel
- Plasticizer effect on melt blending of polylactide stereocomplex
- Polypropylene/basalt thick film composites: structural, mechanical and dielectric properties
- Performance properties of rigid polyurethane-polyisocyanurate/brewers’ spent grain foamed composites as function of isocyanate index
- Synthesis and characterization of polyvinylmethylsiloxanes by cationic polymerization using a solid green catalyst