Bio-based chitosan/PVdF-HFP polymer-blend for quasi-solid state electrolyte dye-sensitized solar cells
-
Wan Zaireen Nisa Yahya
 ,
Wong Theen Meng
,
Wong Theen Meng

Abstract
Dye-sensitized solar cells (DSSCs) have emerged to become one of the most promising alternatives to conventional solar cells. However, long-term stability and light-to-energy conversion efficiency of the electrolyte in DSSCs are the main challenges in the commercial use of DSSCs. Current liquid electrolytes in DSSCs allow achieving high power conversion efficiency, but they still suffer from many disadvantages such as solvent leakage, corrosion and high volatility. Quasi-solid state electrolytes have therefore been developed in order to curb these problems. A novel polymer electrolyte composed of biobased polymer chitosan, poly(vinylidene fluoride-hexafluoropropylene) (PVdF-HFP), 1-methyl-3-propylimidazolium iodide ionic liquid and iodide/tri-iodide redox salts in various compositions is proposed in this study as a quasi-solid state electrolyte. Fourier transform infrared microscopy (FTIR) studies on the polymer electrolyte have shown interactions between the redox salt and the polymer blend. The quasi-solid state electrolyte tested in DSSCs with an optimised weight ratio of PVdF-HFP:chitosan (6:1) with ionic liquid electrolyte PMII/KI/I2 has shown the highest power conversion efficiencies of 1.23% with ionic conductivity of 5.367×10⁻⁴ S·cm−1 demonstrating the potential of using sustainable bio-based chitosan polymers in DSSCs applications.
1 Introduction
Since the first report by O’Regan et al. (1), dye-sensitized solar cells (DSSCs) have received intense research and investigation. Semiconductors in conventional photovoltaic cells which participate in photon absorption, as photoreceptor and as charge carriers simultaneously, have high purity demands on raw material and processing (2), (3). Eventually, the separate functions of each component in DSSCs have made such cells a promising alternative to the classical silicon-based photovoltaic cells (3) due to its lower price in fabrication, easier preparation, better performance and being more environmental friendly (1), (2), (3), (4). Although DSSCs still exhibit lower power conversion efficiency than previous generations of photovoltaic (PV) cells, there are still big potentials for improvement. Many scientists are devoting much effort to this around the world, where on average more than five publications related to DSSCs are published every day (2), (3).
The three important criteria that should be focused on for DSSCs’ commercial application are light-to-electric energy conversion efficiency, long-term stability and reducing the cost of devices (2), (3), (4). DSSCs’ four important components are dyes, photoanodes, counter electrodes and electrolytes. The electrolyte is the crucial component in the cell, where its two main functions are, as the inner charge carrier transport and continuous dye regeneration. Its role has great impact on the light-to-electric energy conversion efficiency and determines the long-term stability of DSSCs (3).
Great developments have been achieved using liquid electrolytes in DSSCs as charge carrier transports, with efficiency of more than 12% (5). However, the use of liquid electrolyte has posed several limitations such as leakage, ineffective sealing, photo-degradation and solvent volatilization, which has challenged the durability of DSSCs (2), (6), (7). Therefore, attempts have been made to quasi-solidify the liquid electrolyte by using gelling agents, polymer matrix or conductive organic materials which have demonstrated significant improvement in terms of stability and sealing (3), (4), (8), (9). However, efficiencies of quasi-solid electrolytes in DSSCs are often lower than liquid electrolytes (3), (8), (9). Therefore, designing alternative electrolytes, to improve the charge carrier efficiency and to increase long-term stability should be explored and studied.
In this study, a combined system of poly(vinylidene fluoride-hexafluoropropylene) (PVdF-HFP) and a biopolymer, chitosan to quasi-solidify liquid electrolyte is proposed. Blends of different polymers instead of developing new polymer are one of the simplest and yet effective means to achieve a variety of physical and chemical properties in the constituent (10). PVdF-HFP is chosen for its high ionic conductivity, mechanical stability and wide electrochemical stability (11). The study of chitosan as an electrolyte is still limited and the blending of biopolymer promotes a greener and more environmental friendly method in polymer electrolyte preparation. Chitosan has been the subject of interest due to its specific properties such as biodegradability, biocompatibility, it is odorless, has high mechanical strength (12), (13) yet it is non-toxic and environmental friendly (14).
This presently chosen approach by mixing PVdF-HFP and chitosan is innovative in the study of the quasi-solid state electrolyte for DSSCs. The challenge that may arise when using a polymer blend is incompatibility of the polymer matrix with the redox salt. Therefore, the effect of different PVdF-HFP:chitosan weight ratios are being studied and evaluated. To further enhance ionic conductivity of the system, 1-methyl-3-propylimidazolium iodide (PMII) ionic liquids were incorporated as an addition to the redox couple iodine (I2)/potassium iodide (KI) as demonstrated in our previous report (15). Ionic liquids are often used as organic salts in the quasi-solid state solid electrolytes or as a solvent in the electrolyte (16), (17) due to its high ionic conductivity, and also extremely low vapor pressure so it is more stable in high temperature conditions and after prolonged irradiation exposure. The objective of this study is to investigate the influence of a polymer matrix encompassment into a liquid electrolyte and to study the effect of different ratios of PVdF-HFP:chitosan polymer on the electrochemical properties and photovoltaic performance in quasi-solid state electrolyte DSSCs.
2 Experimental
2.1 Materials
1-Methylimidazole, 1-iodopropane, iodine (I2), potassium iodide (KI), poly(vinylidene fluoride-hexafluoropropylene) (PVdF-HFP, average Mw: 400,000) and chitosan (medium molecular weight, 75%–80% deacetylated) were purchased from Sigma-Aldrich (Bornem, Belgium). Ethyl acetate (EtOAc), tetrahydrofuran (THF) and acetic acid (CH3CO2H, 100% glacial) were purchased from Merck Millipore (Bornem, Belgium). Conducting glass plates [fluorine doped tin Oxide (FTO)] and cis-diisothiocyanato-bis(2,2′-bipyridyl-4,4′-dicarboxylato) ruthenium(II) bis(tetrabutylammo-nium) (N719, Ruthenizer 535-bisTBA) dye were purchased from Solaronix (Aubonne, Switzerland). Titania paste (18NR-T transparent) and platinum paste (PT1) were purchased from Dyesol (Queanbeyan, Australia).
2.2 Synthesis of 1-methyl-3-propylimidazolium iodide (PMII)
A mixture of 1-methylimidazole (20 ml, 205.07 mmol) and iodopropane (23 ml, 288.55 mmol) was placed in a sealed round bottom flask with a magnetic stirrer. The flask was continuously stirred under the fume hood for 3 h at room temperature. It was then washed several times by decantation with THF followed by ethyl acetate to remove unreacted reactants. Lastly, the product was dried under reduced pressure for 24 h to ensure all traces of solvent are removed. A yellow viscous liquid was obtained (55.8 g, yield: 88%). Characterization of the product was performed by using 1H NMR spectroscopy (Bruker Ascend 500 MHz Spectrometer) to confirm the chemical structure of PMII. The 1H NMR spectrum (CD3CN, 298.6K) contains peak: δ (ppm)=0.783 (3H, t, CH3), 1.787 (2H, m, CH2), 3.881 (3H, s, N-CH3), 4.173 (2H, t, N-CH2), 7.621 (1H, s), 7.698 (1H, s), 9.273 (1H, s); which confirms the structure of PMII.
2.3 Gel-polymer electrolyte preparation
A homogeneous liquid electrolyte solution was prepared by mixing I2, KI, PMII with the weight ratio of 0.006:0.026:1, respectively. The quasi-solidification of the liquid electrolyte was performed by adding different weight ratios of PVdF-HFP:chitosan (3:1, 4:1, 5:1 and 6:1) with a total mass of both polymers are kept constant at 15 wt% and 85 wt% of liquid electrolyte. Acetonitrile is used to dissolve PVdF-HFP, while acetic acid is used as a solvent for chitosan. The system is kept under constant stirring for 24 h at the speed of 320 rpm (70°C) to form a homogeneous gel-like electrolyte.
2.4 Fourier transform infrared (FTIR) spectroscopy
The infrared spectrum is obtained with spectrum one FTIR spectroscopy with the resolution of 0.01 cm−1. Four samples were studied to gain insight on the polymer encompassment to the electrolyte: pure chitosan; PVdF-HFP dissolved in acetonitrile; pure PMII and gel-polymer electrolyte sample [PVdF-HFP:chitosan (3:1) in PMII, KI and I2].
2.5 Electrochemical impedance spectroscopy (EIS)
Ionic conductivity measurements of the gel-polymer electrolyte were carried out using EIS (4), (7), (16), (17). The cells were made of the gel-polymer electrolyte for each weight ratios sandwiched in between two platinum counter electrodes. The measurements were then performed by using a GAMRY Instruments 400s electrochemical workstation in the frequency range between 0.001 Hz and 1×10⁵ Hz by applying bias of the open circuit voltage, Voc, under the conditions of no electric current (zero bias voltage). The peak frequency of the low frequency arc (ωmax) is obtained from the EIS spectra which is also equivalent to the values of the the effective rate constant for recombination (keff) (18). Diffusion coefficient of triiodide, DI in the electrolyte is then calculated using the relation in (1) which is described by the finite Warburg impedance (18), where DI is the diffusion coefficient of tri-iodide in the electrolyte (cm2 s−1) and δ is the thickness of electrolyte film (30 μm). Ionic conductivity is also calculated from the resistance of impedance of diffusion of tri-iodide (RD) found in the complex impedance diagram, according to the equation (1) where σ is the ionic conductivity (S cm−1), L is the distance between electrodes (30 μm), A is the surface area of the electrolyte (1 cm2) and RD is the resistance of impedance of diffusion of tri-iodide (S).
2.6 DSSCs fabrication and assembly
The preparation of the photoanode was done by using a fluorine doped tin oxide (FTO) covered glass which was rinsed with acetone and ethanol for 10 min in an ultrasonic bath. It was then followed by a flash evaporation at 500°C on a hotplate to ensure all traces of solvents were removed from the FTO glass surface. The titania paste was then screen printed on the FTO glass using a doctor-blade technique. The screen printing is done twice to get the required thickness of 12 μm. The coated FTO glasses are first dried at room temperature to avoid irregularities, which are then sintered in a Hengli HGL 3005-4A Belt Furnace gradually at 180°C, 270°C, 300°C, 350°C and 500°C for 30 min at the speed of 121 mm/min. The photoanodes are then sensitized by soaking in 0.3 mm solution of N719 dye in ethanol overnight at room temperature. For the preparation of platinum counter electrode, similarly, FTO glasses are washed with acetone and ethanol then heated to remove all traces of solvent or any contaminants by flash evaporation. Next, platinum paste is screen printed on the glass and followed by a sintering process at 400°C (30 min). The different ratios of quasi-solid state PVdF-HFP/chitosan gel electrolytes are then spread on the photoanode surface. Next, the photoanode and the counter electrode are clamped together with a layer of inert tape which is used to keep the distance between photoanode and cathode of 30 μm. To facilitate the homogeneous wetting of electrolyte on the surface, a slight pressure is applied (4).
2.7 Photovoltaic performance characterization
Photovoltaic electrical characterizations are performed under a standard Air-Mass 1.5 Global (AM1.5G) illumination with an irradiance of 100 mW·cm−2 using a Dyesol Light source and a Keithley 2420 source measure unit. The active area of the cell is 1 cm2. Three parameters Jsc, Voc, and FF can be extracted from the J-V curves to determine the photovoltaic performances using the following equations [2]:
where Vmax is the maximum potential in the J-V curves (V), Jmax (mA·cm−2) is the maximum current density in the J-V curves (mA·cm−2), Voc (V) is the open-circuit voltage, Jsc (mA·cm−2) is the short-circuit current density and Pin (mA·cm−2) is the incident light power density.
3 Results and discussion
3.1 Fourier transform infrared spectroscopy characterization
FTIR spectrum provides information through band properties and intensities which is useful to predict the chemical processes in the area of the band. Functional group analysis is done and interactions of the constituents were studied from the FTIR spectra as shown in Figure 1.
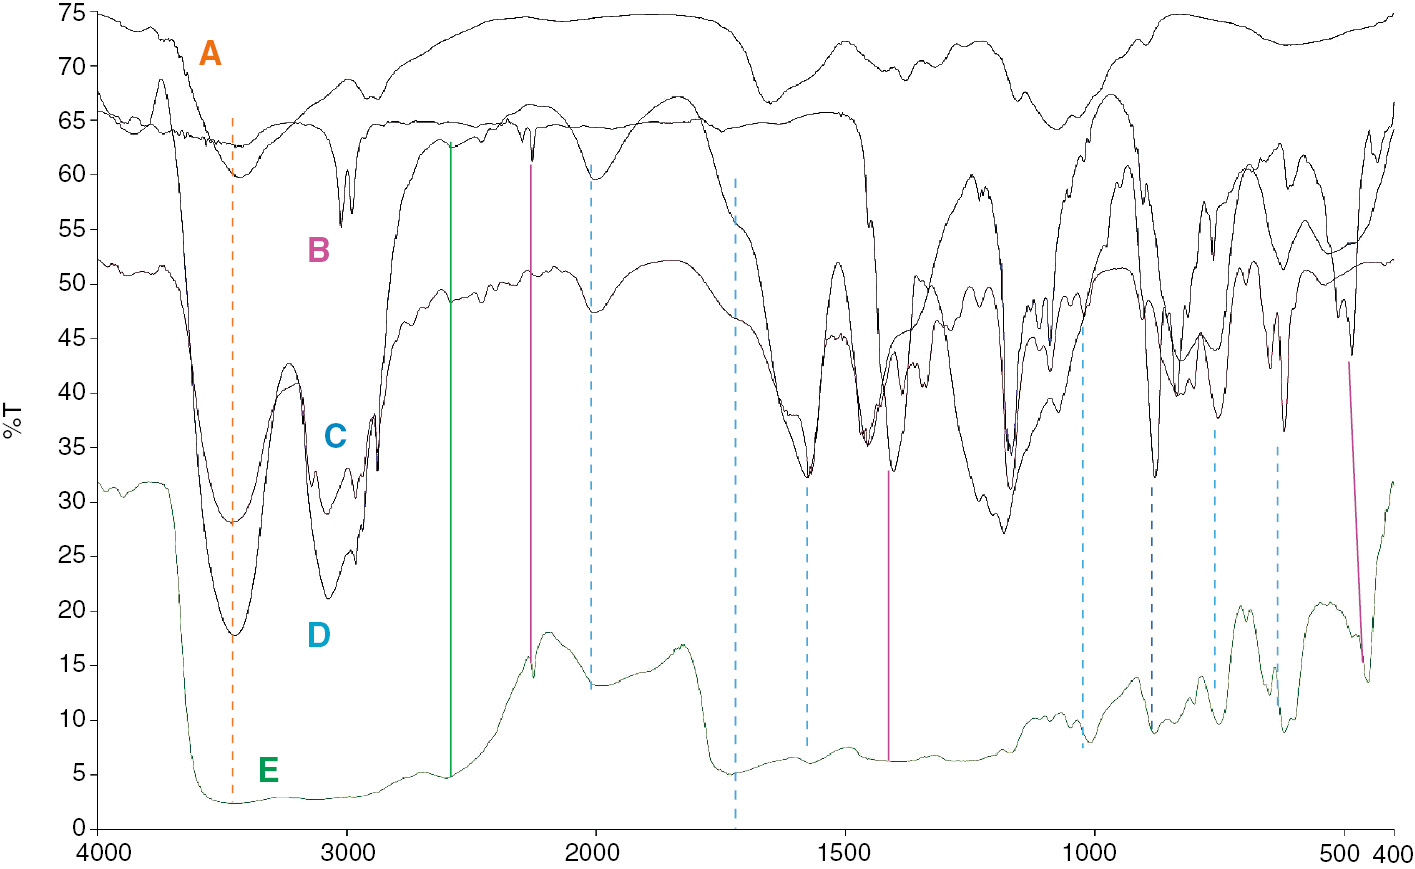
(A) Pure chitosan; (B) PVdF-HFP dissolved in acetonitrile; (C) PMII dissolved with KI and I2; (D) pure PMII; (E) gel polymer electrolyte chitosan/PVDF-HFP/PMII/KI/I2.
Figure 1 shows the FTIR spectra of pure chitosan, PVdF-HFP dissolved in acetonitrile, PMII dissolved with KI and I2, pure PMII and gel polymer electrolyte chitosan/PVDF-HFP/PMII/KI/I2 in the range of 400–4000 cm−1. For chitosan polymer, characteristic peaks can be seen in the region of 3500 cm−1 corresponding to the O-H band at 1650 cm−1 for the carbonyl band, with a small shoulder at around 1569 cm−1 corresponding to the NH2 band as recorded by Osman et al. (19). For PVdF-HFP strong C-F stretch at 1405 cm−1 can be seen and vibrational bands peaks at 1072.61 cm−1, 762 cm−1, 879 cm−1 are also recorded by other reports (20), (21). For PMII the peaks at 3500 cm−1 may correspond to O-H band from traces of water or an N-H bond from traces of 1-methylimidazole in the ionic liquid. PMII ionic liquid exhibits the characteristic C-H stretch of the aromatic ring at 3100 cm−1, a peak near 2000 cm−1 corresponding to the C=N stretching, in the plane ring mode at 1520 cm−1, C-H bendings at 1405 cm−1 and 1167 cm−1, as well as the out of plane bendings of C-H band at 752 cm−1 and 620 cm−1 in the fingerprint region. The peaks exhibiting in PMII are noticeably present in the gel polymer electrolyte compared to others which may indicate that the PMII is not chemically reacting with PVDF-HFP and chitosan. Furthermore, when comparing the FTIR spectra of PMII and PMII/KI/I2 few changes are observed in terms of the appearance of a sharp peak at 880 cm−1, which is also present in the gel polymer electrolyte. In general, there are observed changes of peaks as compared to the original component and the gel polymer electrolyte. Therefore, the FTIR spectra reveal the complexations between all components in the electrolyte, due to the mutual interactions between the components that induce changes in the vibrational mode of the atom or molecules, thus cause changes to the physical and chemical properties of the complex constituent.
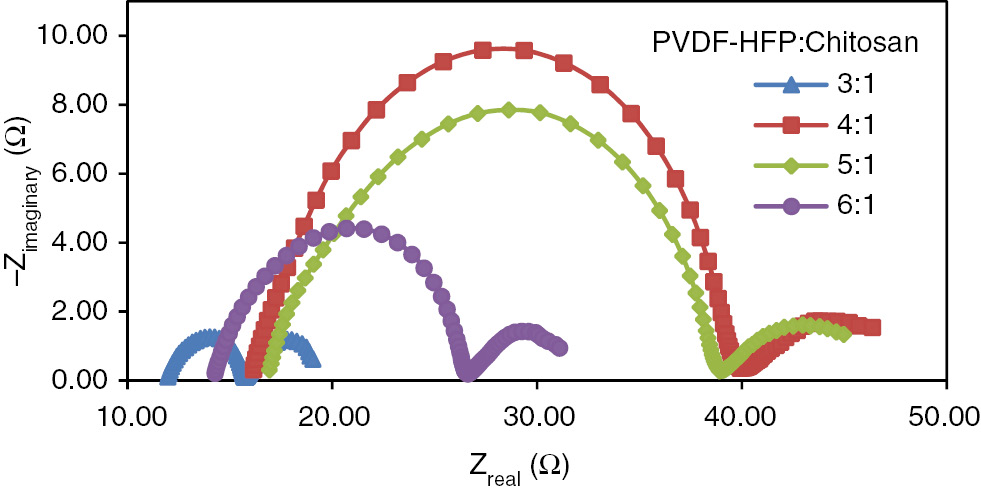
Nyquist plots of electrochemical cell of the gel polymer electrolytes with different PVdF-HFP:chitosan ratios.
3.2 Electrochemical impedance spectroscopy characterization
EIS measurement is important to calculate the conductivity of the gel-polymer electrolyte which strongly influences the photovoltaic performance. The Nyquist plots are shown in Figure 2 and the peak frequency of the semi circle arc ωmax is obtained from Bode plot. The main electron transport properties such as the effective rate constant for recombination (keff), triiodide diffusion coefficient (DI), resistance of impedance of diffusion of triiodide (RD) and ionic conductivity (σ), are tabulated in Table 1.
Electrochemical impedance spectroscopy parameters measured for each sample.
| PVDF-HFP:chitosan (wt%:wt%) | ωmax/keff s−1 Hz | DI (cm2 s−1) | RD (Ω) | σ (S·cm−1) |
|---|---|---|---|---|
| 3:1 | 6.811×10⁻³ | 2.45×10⁻⁸ | 3.91 | 7.67×10⁻⁴ |
| 4:1 | 4.029×10⁻³ | 1.45×10⁻⁸ | 8.28 | 3.62×10⁻⁴ |
| 5:1 | 5.098×10⁻³ | 1.84×10⁻⁸ | 7.61 | 3.94×10⁻⁴ |
| 6:1 | 6.688×10⁻³ | 2.41×10⁻⁸ | 5.59 | 5.36×10⁻⁴ |
The results clearly demonstrate interdependence between ion diffusion and conductivity whereby as the diffusion coefficient of triiodide (DI) increases, the resistance of impedance (RD) decreases hence increasing the conductivity. Due to the increasing of the diffusion coefficient, the supply of I3− ions to the Pt counter electrode is increasing, causing a rise of I3− ions at its surface (4). In addition, the effective rate constant for recombination (keff) increases after the addition of higher PVDF-HFP content (more than 4:1) which might be due to the increased availability of fluoride ions in the electrolyte that reduces the recombination rate for the strong electronegativity of the fluoride ions. The highest conductivity recorded is 7.67×10⁻⁴ S·cm−1 with the polymer ratio of 3:1. The conductivity declines as the ratio increases to 4:1. However, further increases of PVdF-HFP/chitosan ratios to 6:1, the conductivity of the composite polymer electrolyte grows back from 3.62×10⁻⁴ S·cm−1 to 5.36×10⁻⁴ S·cm−1. A plausible explanation of the increase of conductivity is due to the increase of ion mobility (22) due to the increase of fluoride ions as well as the physical aspect of the gel where the polymer gel with the ratio of 6:1 appeared to be less gelatinous than the gel polymers of 4:1 and 5:1 ratios.
3.3 Photovoltaic performance
The polymer gel electrolytes with various ratios of PVdF-HFP:chitosan are assembled in DSSCs to evaluate their J-V photovoltaic characterization under AM1.5G illumination (100 mW·cm−2) at room temperature. The photocurrent densities versus photo-voltage (J-V) curves are shown in Figure 3 and the dependence of each parameter on different polymer weight ratios is shown in Figure 4.
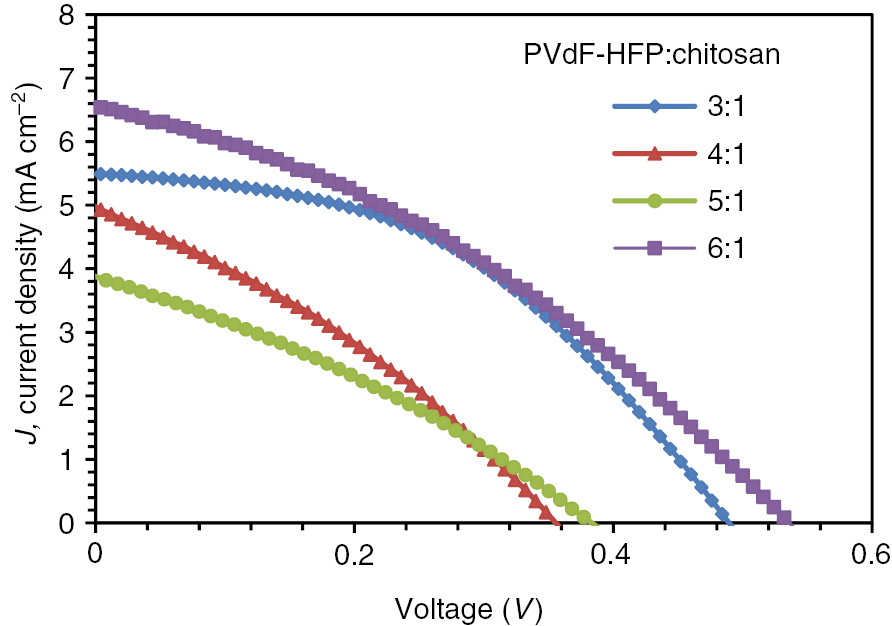
J-V curves for each cells with different PVdF-HFP:chitosan weight ratios.
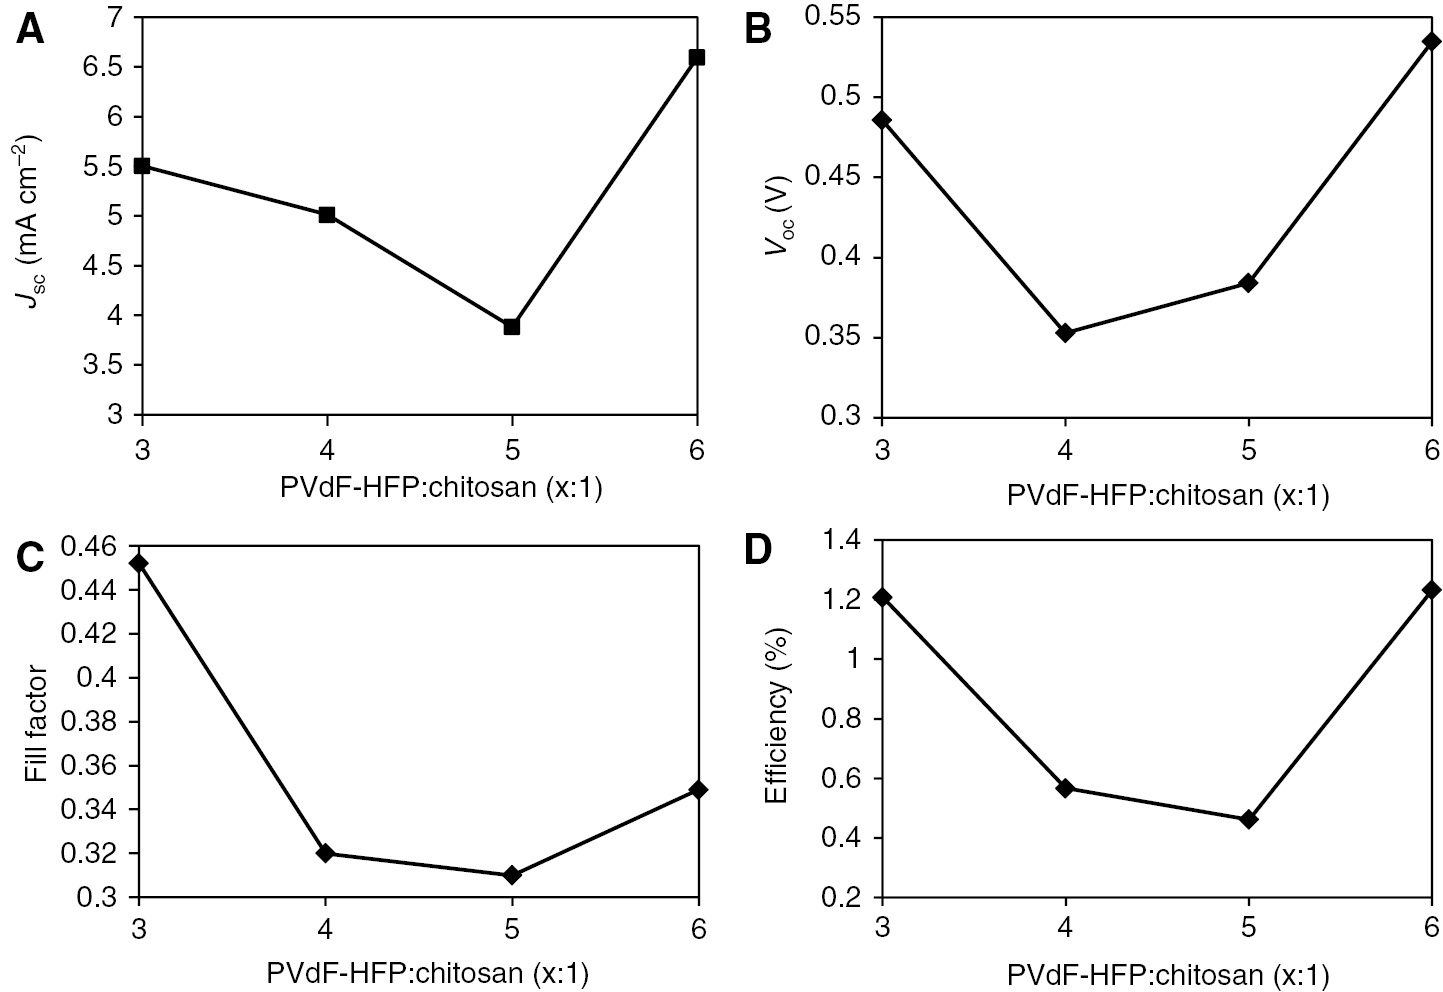
Dependence of photovoltaic parameters: (A) short-circuit photocurrent density, Jsc; (B) open-circuit voltage, Voc; (C) fill factor and (D) conversion efficiency on different polymer weight ratios.
It is observed that the Jsc, Voc, fill factor and conversion efficiency does not change according to the trend of increasing weight ratios. From Figure 3A, it can be observed that as the weight ratios increases, the Jsc values declines and it eventually grows back after the addition of higher weight ratios (PVdF-HFP:chitosan=6:1), the increase is most probably due to the enhanced ionic conductivity and tri-iodide diffusion coefficient of the gel polymer electrolyte, as proven by the EIS characterization. Besides, at the higher amount of PVdF-HFP:chitosan ratios (more than 4:1), Voc values increase accordingly (as seen in Figure 4B). Voc values are strongly affected by the recombination rate, in which the increasing trend is most probably due to the increased availability of fluoride ion which reduces the recombination rate at the photoanode for its strong electronegativity, as discussed earlier. However, the final hypothesis can be derived only after intense research work in this direction is done. The trend of the fill factor is an overlay between the photocurrent density and the short-circuit voltage as seen in Figure 4C. To obtain high values of the fill factor, the suppression of charge recombination at high voltages is important (4). In our case, the obtained results for EIS measurements are closely co-related with the photovoltaic performance results, which confirm that the data presented are accepted and valid.
From the results obtained, the crucial role of each quantity of component incorporated to the electrolyte is demonstrated as affecting the photovoltaic performance. The photovoltaic performance parameters are presented in Table 2. The polymer ratio of 5:1 recorded the lowest cell efficiency of only 0.46%, while the polymer ratio of 3:1 and 6:1 provides among the highest efficiency of all cells which is 1.21% and 1.23% as seen in Figure 4D. The lower power conversion efficiency of the gel polymer of ratios 4:1 and 5:1 can be explained by the physical aspect of the gel where they formed a harder gel compared to the other 3:1 and 6:1 ratios. As a comparison with our study reported on usage of PMII ionic liquid (15), we have obtained a comparable power conversion efficiency of 1.19% with PMII/KI/I2 electrolyte. This has shown that the effect of quasi-solidifying of the liquid electrolyte by polymer as gelling agent is effective without hampering the solar cells’ efficiency.
Photovoltaic performance parameters.
| PVDF-HFP:chitosan (wt%:wt%) | Jsc (mAcm−2) | Voc (V) | Fill factor | Efficiency (%) |
|---|---|---|---|---|
| 3:1 | 5.50 | 0.49 | 0.45 | 1.21 |
| 4:1 | 5.01 | 0.35 | 0.320 | 0.57 |
| 5:1 | 3.88 | 0.38 | 0.310 | 0.46 |
| 6:1 | 6.59 | 0.53 | 0.35 | 1.23 |
4 Conclusions
Novel quasi-solid state electrolytes with PVdF-HFP:chitosan as the gelling agent of PMII/KI/I2 ionic liquid electrolyte solution are being pursued in view of their possible implementation of a sustainable polymer composite, yet they exhibit several advantages such as high conductivity and good conversion efficiency. The gel polymer electrolytes are successfully prepared and characterized through FTIR and EIS, which are then assembled to DSSCs to characterize their photovoltaic performance. FTIR studies have been confirmed on the interaction between the redox salt and the polymer blend. Reliable parameters relating to photovoltaic performance and EIS measurements are obtained. DSSCs assembled with PVdF-HFP:chitosan/PMII/KI/I2 electrolyte with the weight ratio of 6:1 achieved the highest efficiency of 1.23% under 100 mW·cm−2 light illumination where the ratio of 3:1 has the highest conductivity of 7.67×10⁻⁴ S·cm−1. Future recommendations should be focused on the development of biopolymer as the host for gel-polymer electrolyte due to their interesting properties. Besides, optimization of the gel-polymer composition can be done through the design of experiment to determine the best ratios of PVdF-HFP and chitosan which will maximize the efficiency of the assembled cell and also other parameters.
Nomenclature
- DSSCs
Dye sensitized solar cells
- Voc
Open circuit voltage
- Jsc
Short circuit current
- FF
Fill factor
- keff
Effective rate constant for recombination
- DI
Triiodide diffusion coefficient
- Rd
Resistance of impedance of diffusion of tri-iodide
- σ
Conductivity
Acknowledgments
The financial and technical support provided by Chemical Engineering Department, Centre of Ionic Liquid and Dye Solar Cell Laboratory, Centre of Innovative Nanostructure and Nanodevices of Universiti Teknologi Petronas (Grant/Award Number: ‘Internal Grant STIRF’) are acknowledged.
References
1. O’Regan B, Gratzel M. A low-cost, high-efficiency solar cell based on dye-sensitized colloidal TiO2 films. Nature 1991;353:737–40.10.4324/9781315793245-57Search in Google Scholar
2. Hagfeldt A, Boschloo G, Sun L, Kloo L, Pettersson H. Dye-sensitized solar cells. Chem Rev 2010;110:6595–663.10.1016/B978-0-12-811165-9.00006-5Search in Google Scholar
3. Wu J, Lan Z, Lin J, Huang M, Huang Y, Fan L, Luo G. Electrolytes in dye-sensitized solar cells. Chem Rev 2015;115:2136–73.10.1021/cr400675mSearch in Google Scholar
4. Bella F, Nair JR, Gerbaldi C. Towards green, efficient and durable quasi-solid dye-sensitized solar cells integrated with a cellulose-based gel-polymer electrolyte optimized by a chemometric DoE approach. RSC Adv 2013;3:15993–6001.10.1039/c3ra41267aSearch in Google Scholar
5. Yella A, Lee HW, Tsao HN, Yi C, Chandiran AK, Nazeeruddin MK, Diau EW, Yeh CY, Zakeeruddin SM, Grätzel M. Porphyrin-sensitized solar cells with cobalt (II/III)-based redox electrolyte exceed 12 percent efficiency. Science 2011;334:629–34.10.1126/science.1209688Search in Google Scholar
6. Bella F, Bongiovanni R. Photoinduced polymerization: an innovative, powerful and environmentally friendly technique for the preparation of polymer electrolytes for dye-sensitized solar cells. J Photochem Photobiol C: Photochem Rev 2013;16:1–21.10.1016/j.jphotochemrev.2013.03.002Search in Google Scholar
7. Jihuai W, Zhang L, Sanchun H, Pingjiang L, Jianming L, Miaoliang H, Fang L, Huang Y. Progress on the electrolytes for dye-sensitized solar cells. Pure Appl Chem 2008;80:241–2258.Search in Google Scholar
8. Nei de Freitas J, Nogueira AF, De Paoli MA. New insights into dye-sensitized solar cells with polymer electrolytes. J Mater Chem 2009;19:5279–94.10.1039/b900928kSearch in Google Scholar
9. Nogueira AF, Longo C, De Paoli MA. Polymers in dye sensitized solar cells: overview and perspectives. Coord Chem Rev 2004;248:1455–68.10.1016/j.ccr.2004.05.018Search in Google Scholar
10. Abdelrazek EM, Ragab HM, Abdelaziz M. Physical characterization of poly (vinyl pyrrolidone) and gelatin blend films doped with magnesium chloride. Plast Polym Technol (PAPT) 2013;2:1–8.Search in Google Scholar
11. Periasamy P, Tatsumi K, Kalaiselvi N, Shikano M, Fiyieda T, Saito Y, Sakai T, Mizukata M, Kajinami A, Deki S. Performance evaluation of PVdF gel polymer electrolytes. Ionics 2002;8:453–60.10.1007/BF02376061Search in Google Scholar
12. Muzzarelli RAA. Natural chelating polymers: alginic acid, chitin, and chitosan. Oxford, New York: Pergamon Press, 1973.Search in Google Scholar
13. Zong Z, Kimura Y, Takahashi M, Yamane H. Characterization of chemical and solid state structures of acylated chitosans. Polymer 2000;41:899–906.10.1016/S0032-3861(99)00270-0Search in Google Scholar
14. Jumaa M, Müller BW. Physicochemical properties of chitosan-lipid emulsions and their stability during the autoclaving process. Int J Pharm 1999;183:175–84.10.1016/S0378-5173(99)00086-1Search in Google Scholar
15. Yusof SMM, Yahya WZN. Binary ionic liquid electrolyte for dye-sensitized solar cells. Proc Eng 2016;148:100–5.10.1016/j.proeng.2016.06.453Search in Google Scholar
16. Prabakaran K, Mohanty S, Nayak SK. PEO/PVdF-HFP electrolytes for natural dye sensitized solar cell applications: effect of modified nano-TiO2 on electrochemical and photovoltaic performance. J Mater Sci: Mater Electron 2015;26:3887–97.10.1007/s10854-015-2916-4Search in Google Scholar
17. Yang Y, Zhang J, Zhou C, Wu S, Xu S, Liu W, Han H, Chen B, Zhao XZ. Effect of lithium iodide addition on poly(ethylene oxide)−poly(vinylidene fluoride) polymer-blend electrolyte for dye-sensitized nanocrystalline solar cell. J Phys Chem B 2008;112:6594–602.10.1021/jp801156hSearch in Google Scholar
18. Adachi M, Sakamoto M, Jiu J, Ogata Y, Isoda S. Determination of parameters of electron transport in dye-sensitized solar cells using electrochemical impedance spectroscopy. J Phys Chem B 2006;110:13872–80.10.1021/jp061693uSearch in Google Scholar
19. Osman Z, Arof AK. FTIR studies of chitosan acetate based polymer electrolytes. Electrochim Acta 2003;48:993–9.10.1016/S0013-4686(02)00812-5Search in Google Scholar
20. Shalu, Chaurasia SK, Singh RK, Chandra S. Thermal stability, complexing behavior, and ionic transport of polymeric gel membranes based on polymer PVdF-HFP and ionic liquid, [BMIM][BF4]. J Phys Chem B 2013;117:897–906.10.1021/jp307694qSearch in Google Scholar PubMed
21. Usha Rani M, Babu R, Rajendran S. Conductivity study on PVDF-HFP/PMMA electrolytes for lithium battery applications. Int J ChemTech Res 2013;5:1724–32.Search in Google Scholar
22. Bhagavathi Achari M, Elumalai V, Vlachopoulos N, Safdari M, Gao J, Gardner JM, Kloo L. A quasi-liquid polymer-based cobalt redox mediator electrolyte for dye-sensitized solar cells. Phys Chem Chem Phys 2013;15:17419–25.10.1039/c3cp52869cSearch in Google Scholar PubMed
©2017 Walter de Gruyter GmbH, Berlin/Boston
This article is distributed under the terms of the Creative Commons Attribution Non-Commercial License, which permits unrestricted non-commercial use, distribution, and reproduction in any medium, provided the original work is properly cited.
Articles in the same Issue
- Frontmatter
- In this Issue
- Elastic recovery of polyamide 6 matrix nanocomposites and their basalt fiber co-reinforced hybrids
- Bio-based chitosan/PVdF-HFP polymer-blend for quasi-solid state electrolyte dye-sensitized solar cells
- Synergistic effects of retinoic acid and graphene oxide on the physicochemical and in-vitro properties of electrospun polyurethane scaffolds for bone tissue engineering
- Non-isothermal crystallization and thermal degradation kinetics of MXene/linear low-density polyethylene nanocomposites
- Extraction and characterization of chitin and chitosan: applications of chitosan nanoparticles in the adsorption of copper in an aqueous environment
- Systematic evaluation of pH and thermoresponsive poly(n-isopropylacrylamide-chitosan-fluorescein) microgel
- Plasticizer effect on melt blending of polylactide stereocomplex
- Polypropylene/basalt thick film composites: structural, mechanical and dielectric properties
- Performance properties of rigid polyurethane-polyisocyanurate/brewers’ spent grain foamed composites as function of isocyanate index
- Synthesis and characterization of polyvinylmethylsiloxanes by cationic polymerization using a solid green catalyst