Extraction and characterization of chitin and chitosan: applications of chitosan nanoparticles in the adsorption of copper in an aqueous environment
-
Oumkelthoum Rahmani
 ,
Bachir Bouzid
,
Bachir Bouzid

Abstract
The main objective of the present work is to develop and characterize a new generation of adsorptive gelled porous bead supports made from nanoparticles of chitosan, bentonite and alginate. There were subsequently used in the purification of water synthetically polluted with cupric ions. The multiple experiments carried out on the adsorption of copper resulted in an equilibrium time reached after 10 min with an elimination percentage of 86%. Adsorption kinetics is better described by the expression of the second-order model whereas the adsorption isotherm is satisfactorily described by the Freundlich model. The different results showed the high affinity of the nanoparticle composite beads of chitosan/bentonite/alginate to cupric ions in an aqueous solution which is probably due to the presence of various chelating agents such as “NH, OH, COO−, and O” in their structure.
1 Introduction
Chitosan is a polysaccharide that deserves special attention due to its net cationic character and to the presence of multiple reactive functional groups (OH and NH2) on its chains. The use of chitosan in acid conditions to remove heavy metals is limited due to its tendency to dissolve in acid effluents. To overcome this problem, chitosan was stabilized by crosslinking in acid conditions (1), (2), (3).
Furthermore, chitosan adsorption efficiency could be improved by switching to the nano form. The nanoparticles were obtained by ionic crosslinking using tripolyphosphate considered as a non-toxic polyanion (4). This modification, resulted in various changes to chitosan properties, such as a hindrance of the dissolution of chitosan in acidic environments, an improvement of the mechanical strength and an increase of the amorphous nature and the specific surface. These changes theoretically increase the absorption capacity of chitosan nanoparticles compared to the chitosan capacity (5), (6), (7), (8), (9).
Alginate is also a natural polymer that can form salts with metal ions. Sodium alginate is a linear polyuronate which contains varying amounts of D-mannuronic and L-guluronic acids and can easily be crosslinked using calcium ions (10). Such a polymer plays an important role in water treatment technologies. The absorption of the heavy metals takes place by ion exchange between Ca (II) and the metal ion in aqueous solution (11), (12), (13).
Bentonite is an aluminum phyllosilicate mainly composed of montmorillonite (smectite) with other inorganic clays and minerals. There are several types of bentonite that depend on their dominant elements (K, Na, Ca and Al) (14). The use of bentonite as an adsorbent is of interest in the treatment of industrial effluents. This is justified by the importance of negative charges on the surface of this material and also, by the possibility of cation exchange and especially its wide availability in nature (15), (16), (17), (18).
In order to improve the possibilities of recovery and disposal of pollutants, little research has focused on the combined use of chitosan nanoparticles, alginates and bentonite.
2 Materials and methods
2.1 Materials
All products used in this work were of analytical grade from Fluka, Panreac and Sigma-Aldrich sources (Prochima Sigma, Tiemcen, Algeria), they were used as such, without any purification. Sodium alginate: Labosi product, low molecular weight [Brookfield apparent viscosity is: 100–200 mPa.s, measured at 1% (w/w) at 25°C]. The chitosan extracted from shrimp shells came from the port of Bouharoun Wilaya of Tipaza had a degree of deacetylation (DD)=85, 49%, degree of acylation (DA)=14, 5% and a molecular weight equal to 192, 97 kDa. The natural clay “bentonite” used came from a deposit in the northwest of Algerian, in the Mostaganem region.
2.2 Preparation of chitosan nanoparticles (NCs)
Nanoparticles were prepared by Dima et al.’s (19) gelation method of chitosan solution with the ion tripolyphosphate (P3O10)5 but with modifications. In short, 0.1% of chitosan was dissolved in 2% (v/v) of aqueous acetic acid. Then, 1.5 ml of Na5P3O10 at 5% was added dropwise in 10 ml of chitosan solution, colloidal nanoparticles of chitosan were formed spontaneously with gentle agitation at room temperature. Thirty minutes later, they were centrifuged at 4500 rpm for 30 min. Afterwards, the supernatant was discarded and the deposit was dispersed in distilled water by sonication for performing a second wash (20).
2.3 Preparation of bentonite-alginate (B/A) beads
B/A beads were prepared according to the method of Tzu et al. (21). Bentonite solution was prepared by adding 1.0 g of bentonite in 25 ml of distilled water; the mixture was stirred for 30 min, at the same time we mix 0.25 g of sodium alginate with 10 ml of water by stirring for 1 h. The alginate solution was then poured dropwise over the bentonite solution while stirring for 1 h. The prepared mixture was added dropwise using a syringe with a solution of CaCl2 at 3%, the formed beads were left in this solution for 3 h. Conservation is in CaCl2 solution at 1%.
2.4 Preparation of composed beads of chitosan nanoparticles-bentonite-alginate (NCs/B/A)
The method used for the preparation of the NCs/B/A composite beads can be summarized in the three following steps:
Preparation of the B/A mixture
The bentonite solution was prepared by adding 1.0 g of bentonite into 25 ml of distilled water, the mixture was then stirred for 30 min, and simultaneously 0.25 g of sodium alginate was mixed with 10 ml of water while stirring for 1 h.
Preparation of the solution of NCs
A total of 0.5 g of the NCs were taken and dispersed with sonication in 2 ml of distilled water.
Preparation of composite beads NSC/B/A
One gram of the preparation obtained in (a) was mixed with the preparation obtained in (b), after stirring this mixture for 1 h; it was then sonicated for 1 h. Finally, the resulting mixture was added dropwise to a 3% CaCl2 solution using a syringe (1.2 mm diameter).
2.5 Adsorption
The objective of this part is to describe in detail the adsorption of copper (II) on two types of materials B/A and NCs/B/A by studying different parameters such as pH, contact time, the adsorbent mass, the initial concentration of metal, the adsorption isotherm and adsorption modeling. The same manipulation requirements apply to both types of synthesized materials B/A and NCs/B/A adsorption.
2.5.1 Adsorption capacity
The amount of adsorbed metal Q (mg/g) or the performance of the adsorption R (%) is expressed by the following two relations, respectively (22):
C0 and Ce: correspond, respectively, to the initial concentration and to the balance of the liquid phase (mg/l).
V: volume of solution (l).
W: mass of adsorbent used (g).
2.5.2 Handling the adsorption
In order to study each parameter separately, the following experimental protocol is applied: 10 ml of the solution containing copper at different concentrations of 10–30 mg/l are mixed with different adsorbent masses of 0.01–0.1 g in a pH range between 2 and 8 in vials. Then at each time one of these parameters is varied while the others are set in order to study its own effect on the adsorption capacity.
For example, an amount of 0.06 g of adsorbent (beads B/A, beads NCs/B/A) is put in contact in bottles with 10 ml of copper solution of 10 mg/l concentration. The experiment is stirred for 1 h at 22°C and pH=6, by means of a shaker.
After the application, the different adsorbing agents are characterized by Fourier transform infrared (FTIR) spectroscopy, scanning electron microscopy (SEM) and the supernatants are characterized by atomic absorption spectroscopy (ASS).
2.5.3 Desorption experience
The absorbent polymers have considerable advantages, such as their high adsorption capacity and improved selectivity, but also the possibility of regeneration. The recycling of the adsorbent is very important in order to reduce the process costs. For this, it is imperative to desorb the retained metal and regenerate the chitosan derivative for another adsorption cycle.
A solution of 10 ml containing 10 ppm of copper is mixed with 0.06 g of the beads at pH=6. After 1 h of contact the solution is filtered and the adsorbed concentration is measured by AAS, we then place the beads in 2 ml of H2SO4 solution at 0.1 M for 1 h (23).
The desorption percentage is calculated by the following relationship:
2.5.4 Adsorption isotherm
The operation consists in putting, inside a series of 250 ml glass vials, adsorbent masses ranging from 0 to 100 mg. The other experimental parameters namely stirring time, pH and temperature remain unchanged. The amount of metal held by the solid is calculated using the following equation (24):
With:
Qe: amount of solute adsorbed per unit mass of adsorbent (mg/g).
C0: initial concentration of the adsorbate in (mg/l).
Ce: equilibrium concentration of the adsorbate (mg/l).
m: mass of adsorbent (g).
V: volume of solution (l).
2.5.5 Modeling of adsorption isotherms
In this section, the adsorption results were processed with the following models: Langmuir, Freundlich and Temkin.
3 Results and discussion
All the products obtained were characterized by: FTIR, X-ray diffraction (XRD), dynamic light scattering (DLS) and SEM.
3.1 XRD of chitosan nanoparticles
The decrease of the chitosan peak and the appearance of new, less intense peaks in the diffractogram of the nanoparticles (Figure 1) indicate the decrease of the chitosan crystallinity by the decrease of the polymer chain, the highly amorphous nature of these nanoparticles will be appropriate for the adsorption process.
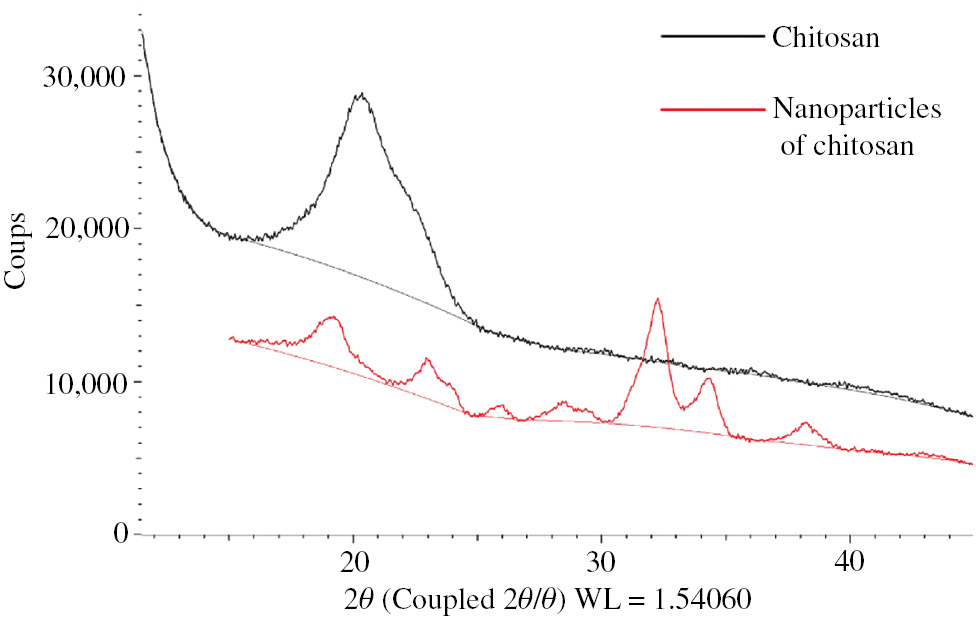
Diffractogram of chitosan and NCs.
This change is due to changes in the crystalline structure of the chitosan produced by chemical interactions between tripolyphosphate ions and ammonium chitosan ions, indicating the presence of tripolyphosphate ions in nanoparticles of chitosan (25).
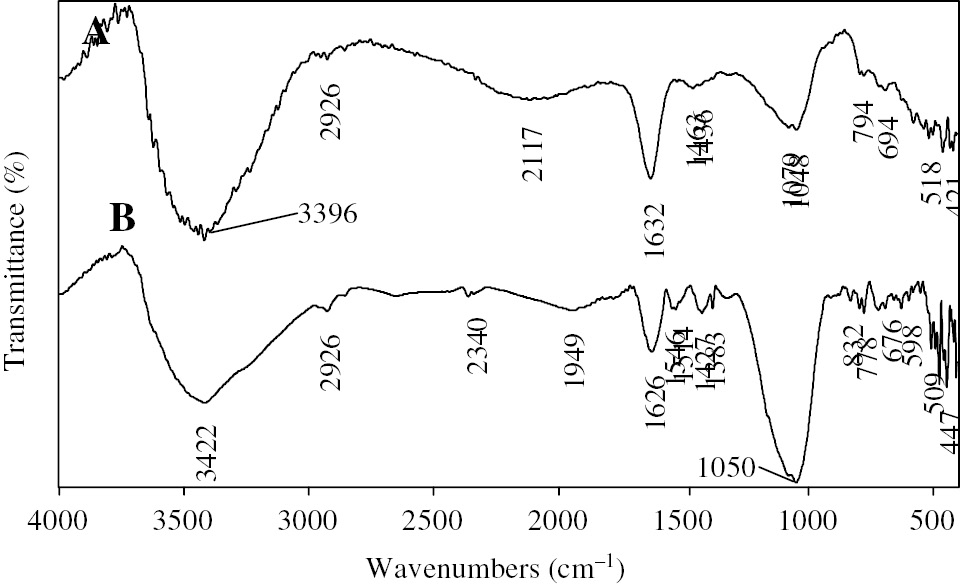
3.2 FTIR of NCs
The spectrum of NCs illustrated in Figure 2 shows that the nanoparticles originated from the interaction between the positively charged amine group of chitosan and the tripolyphosphate ion (P3O10)−5 negatively charged with sodium tripolyphosphate.

Spectrum of NCs.
The absorption band at 3442 cm−1 assigned to the elongation vibration of the -NH bond in chitosan was expanded by physical interactions with TPP.
The absorption bands observed in the region at 1200 and 1100 cm−1 and at 973,895 cm−1 are assigned to the stretching vibration of the P=O and P-O of the tripolyphosphate ion (26), (27), (28).
According to Pearson, Pawlak and Mucha the presence of both bands at 1620 cm−1, 1530 cm−1 are assigned, respectively, to the vibrations of the symmetric and asymmetric stretch of the NH bond of NH3+ ions due to the protonation of the amine functions of chitosan (29), (30).
Furthermore, the crosslinking is confirmed by the shift of the vibration frequency of the C-H bond around 1407 cm−1. Therefore, following the results it can be concluded that the nanoparticles are formed from chitosan.
3.3 SEM of NCs
Figure 3 depicts the morphology of the NCs, in a spherical shape. This result confirms the formation of NCs.
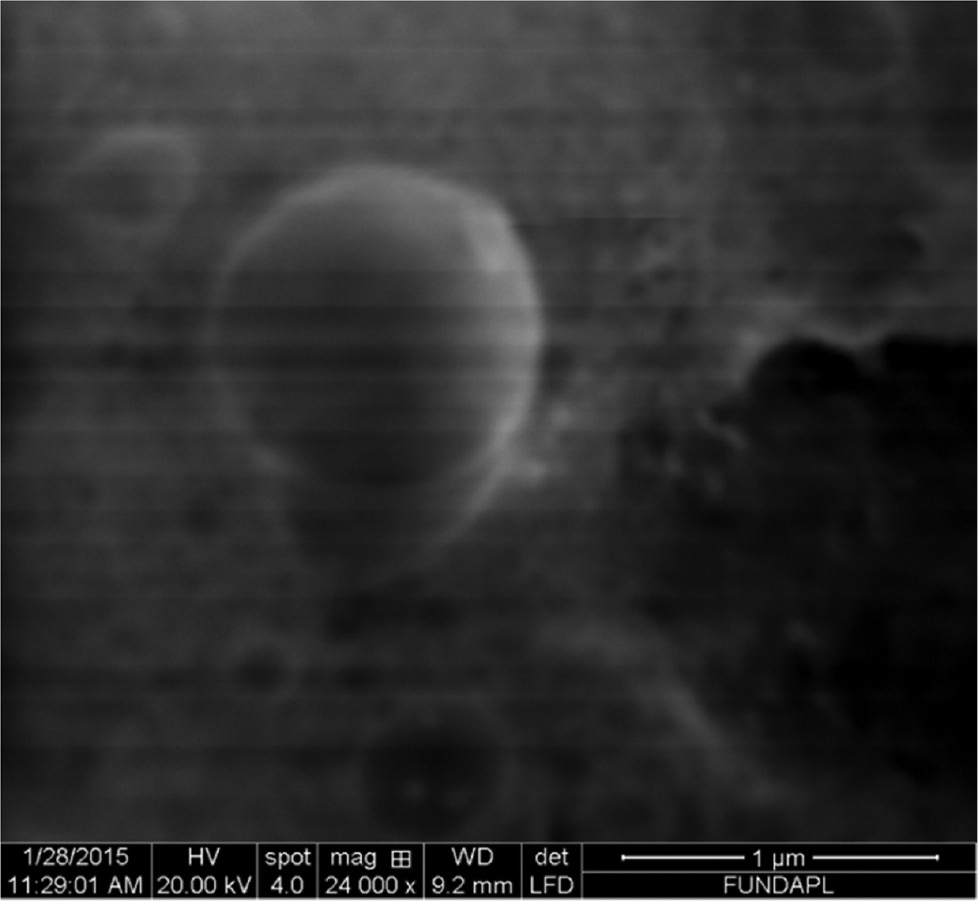
SEM of NCs.
3.4 Size (DLS)
The size of the nanoparticles of chitosan was measured by dynamic light scattering and is shown in Figure 4. The observed results showed that the particle size of the NCs was about 450 nm and its size distribution was in the range of 400–800 nm.

DLS of NCs.
3.5 XRD of NCs/B/A beads
The NCs/B/A beads diffractogram (Figure 5) shows the existence of the same peaks as that of the B/A diffractogram beads, but they are shifted and less intense. According to the literature (31) the peaks shift of a higher diffraction angle toward a lower angle can be attributed to the increase in the interlayer spacing during formation of the NCs/B/A, indicating the interaction between the nanoparticles of chitosan, alginate and bentonite.

Diffractogram of NCs/B/A beads.
3.6 FTIR of composite beads of NCs/B/A before and after adsorption
The spectrum (A) in Figure 6 of the NCs/B/A composite beads shows the presence of the characteristic bands of the three components of the beads. The intense broad band at 3388 cm−1 is due to overlapping NH connections of elongation vibrations of NCs and OH present in all three materials. The bands at 1632 cm−1 and 1436 cm−1 are observed due to the presence of the deformation vibrations of the NH bond of NCs and COO− of alginates and even OH groups. The presence of the bentonite is confirmed by the presence of bands at 1048 cm−1 and 463 cm−1 attributed to the stretching vibration of Si-O groups. The formation of hydrogen bonds and electrostatic interactions between the amine group of chitosan, bentonite and alginate carboxylate ion is proved by the decrease characteristic bands of the alginate carboxylate group and silanol bentonite with the increase in intensity of bands corresponding to the NH group of NCs (32), (33).
Spectrum FTIR of composite beads of NCs (B) denotes before adsorption and (A) denotes after adsorption.
The differences observed between spectrum (A) of the NCs/B/A beads and spectrum (B) of the NCs/B/A beads following fixation of the metal are:
A decrease in intensity and shift of the OH and NH bands (3413 cm−1, 1626 cm−1) reflecting the coordination of the metal ion with these groups (34).
The appearance of a new band at 1532 cm−1 which may be attributed to the bending vibration of the NH2 group indicating the involvement of amine groups in the complexation of copper (35).
A remarkable decrease in intensity of the vibrational elongation band of the CH2 groups (at 2886 cm−1) indicating a change in the environment of the groups -NH3+ (36).
A remarkable change in intensity of the bands at 1427 cm−1, 1383 cm−1 of the COO− group and bands at 1050 cm−1, 478 cm−1 of the SiO group by an increase in their intensity compared to that of spectrum (A). This change is caused by the destruction of bonds between the amine groups of the NCs and these groups; this may be explained by the coordination of the amine groups with the metal ion.
FTIR analysis showed the different peak changes corresponding to the functional groups responsible for the adsorption of cupric ions. These observations suggested that adsorption of Cu (II) ions was probably achieved by formation of bonds with: the nitrogen atom of the NH2 group (which is not involved in the ionic crosslinking process); the oxygen atom obtained from hydroxyl groups of nanochitosan and alginate, tripolyphosphate, P-O-H groups, carboxylate ion of sodium alginate and bentonite SiOH group.
3.7 SEM of NCs/B/A beads of before and after adsorption
Figure 7 shows the NCs/B/A beads before adsorption. The surface of these beads is wrinkled and not flat. It includes cavities.

SEM of NCs/B/A beads before adsorption.
In the photograph of the NCs/B/A beads after adsorption shown in Figure 8, copper crystals are clearly visible in the center of the image. They have a polygonal shape and are close to each other. They are attached to the structure of the bead.

SEM of chitosan nanoparticles-bentonite-alginate beads after adsorption.
3.8 Adsorption
3.8.1 Influence of absorption parameters
The amount of metal that can be removed from a solution depends on many variables such as the pH, contact time, the mass of the adsorbent and the initial concentration of metal.
3.8.1.1 Effect of pH
Figure 9 shows the effect of pH on the adsorption of copper ions by B/A beads and NCs/B/A beads in the pH range from 2 to 8. It is noted that at pH basic values, the precipitation of Cu (II) in Cu (OH)2 form occurs at the same time and could lead to an incorrect interpretation of the adsorption.
![Figure 9: Effect of pH on the adsorption of copper for the B/A and NCs/B/A beads with [Cu2+]=10 mg/l; volume of the aqueous phase=10 ml; massadsorbant=60 mg; Temperature=22°C and agitation=400 tours/min.](/document/doi/10.1515/epoly-2016-0318/asset/graphic/j_epoly-2016-0318_fig_009.jpg)
Effect of pH on the adsorption of copper for the B/A and NCs/B/A beads with [Cu2+]=10 mg/l; volume of the aqueous phase=10 ml; massadsorbant=60 mg; Temperature=22°C and agitation=400 tours/min.
The amounts of copper retained by the B/A beads were found in close relation with the initial value pH of the solution (Figure 9). Retention rates are appreciable between the pH values comprised between 5 and 7, with a retention peak around pH 6, then a reduction in efficiency is observed with increasing pH up to pH 8.
For NCs/B/A beads, the adsorption capacity of the metal ion increases gradually as the pH increases (pH=2 up to pH=6), then it stabilizes at pH=7, then it increases to pH=8 (Figure 9). These results can be interpreted as follows:
The small amount of copper ions retained by the B/A and NCs/B/A beads at very acidic pH is explained by the increase of H+ ions, which results in a competition between the H+ ions and the molecules of the metal Cu2+ cation in adsorption (37), (38).
At higher pH values above pH 6 and in a basic medium, the adsorption capacity of the B/A beads decreases. This decrease can be explained by the precipitation of copper hydroxide and so it will ultimately lead to the reduction of the metal ion absorption capacity.
For the NCs/B/A beads, a marked increase of the amount adsorbed can be noticed in basic media at above pH 6. This increase may be explained by the decrease of H+ ions, this facilitates the adsorption of metal ions by the adsorbent (39). Also in a basic medium, the majority of amine groups are in the deprotonated form NH2, this resulted in rupture of the electrostatic interactions between the phosphate anions of the triphosphate and the amine of chitosan. Deprotonated amine groups and the triphosphate fall within complexation with metal ions; these interactions increase the adsorption ability of this adsorbent agent (40).
3.8.1.2 Effect of contact time
Figure 10 shows the effect of contact time on the adsorption of copper ions. It can be observed that there is a strong adsorption of the metal by different adsorbents in the first minutes of the interaction between the metal and the adsorbent.
![Figure 10: Effect of contact time on the adsorption of copper for the B/A and NCs/B/A beads with [Cu2+]=10 mg/l; volume of the aqueous phase=10 ml; massadsorbant=60 mg; temperature=22°C; pH=6 and agitation=400 tours/min.](/document/doi/10.1515/epoly-2016-0318/asset/graphic/j_epoly-2016-0318_fig_010.jpg)
Effect of contact time on the adsorption of copper for the B/A and NCs/B/A beads with [Cu2+]=10 mg/l; volume of the aqueous phase=10 ml; massadsorbant=60 mg; temperature=22°C; pH=6 and agitation=400 tours/min.
The high rate of initial adsorption can be attributed to the existence of a free surface. When the degree of covering increases, the number of free surface sites available for adsorption decreases, which weakens the adsorption rate until equilibrium is reached.
The equilibrium time is reached for the bentonite alginate composite and for the NCs/B/A after 40 and 10 min, respectively.
The available results point to the conclusion that the B/A beads are not as effective in retaining copper as the chitosan beads. Indeed, NCs/B/A beads have a greater affinity with metal ions. This is probably due to the free doublet of electrons of the deprotonated form of the amine present on the structure of chitosan and tripolyphosphate ions.
3.8.1.3 Effect of the adsorbent mass
The amount of the adsorbent used was varied from 0.01 to 0.1 g while the other parameters such as pH (6), the initial concentration of the metal (10 ppm), and time (1 h) are kept constant.
The adsorption amount of copper is plotted according to the mass of adsorbent as shown in Figure 11. The amount of adsorption decreases as the adsorbent mass increases. This may be attributable to saturation of the specific area of the beads in metal ions and excess of metal remains in solution (41), (42).
![Figure 11: Effect of adsorbent mass on the adsorption of copper for the B/A and NCs/B/A beads with [Cu2+]=10 mg/l; volume of the aqueous phase=10 ml; temperature=22°C; pH=6 and agitation=400 tours/min.](/document/doi/10.1515/epoly-2016-0318/asset/graphic/j_epoly-2016-0318_fig_011.jpg)
Effect of adsorbent mass on the adsorption of copper for the B/A and NCs/B/A beads with [Cu2+]=10 mg/l; volume of the aqueous phase=10 ml; temperature=22°C; pH=6 and agitation=400 tours/min.
It is clear that the adsorption curve of both organic adsorbents looks the same as in Figure 11 that is to say, there is decrease in the adsorbed amount according to biosorbent and the points are balls almost superimposed except at 0.01 g and 0.04 g the quantity biosorbed by the NCs/B/A beads is maximum relative to that of the B/A beads. This may explain why we have worked with a number of balls which is equal to 0.06 g.
3.8.1.4 Effect of initial concentration of the metal
The copper adsorption is strongly influenced by the initial concentration of copper ions in aqueous solutions. In this study, the initial concentration of Cu2+ is varied from 10 mg/l to 60 mg/l while maintaining the other parameters constant.
Figure 12 shows the effect of the initial concentration of metal ions on the adsorption capacity of the B/A and NCs/B/A beads. A decrease in the adsorption capacity of the metal ions with an increase in the initial concentration of copper is noted. At low concentrations of copper, the number of metal ions available in the solution is lower compared to the available sites on the adsorbent and therefore, adsorption of metals by the active sites leading to a very efficient removal of Cu2+ ions while at a higher concentration of metal ions, the copper removal efficiency is low, this is due to the saturation of the adsorption sites of the B/A and NCs/B/A beads (43), (44).
Effect of initial concentration of the metal on the adsorption of copper for the B/A and NCs/B/A beads with volume of the aqueous phase=10 ml; temperature=22°C; pH=6 and agitation=400 tours/min.
3.8.2 Desorption
To verify the effectiveness of the B/A and NCs/B/A beads from an economic and profitability point of view, and to understand the interaction between the metal and the adsorbent, desorption tests were conducted. Water treatment will be economically viable if the adsorbent can be recovered and used repeatedly (14).
The regenerated compounds have been employed for three consecutive cycles of adsorption-desorption, the results are presented in Figure 13. It may be noted that the adsorption capacity in the reuse of regenerated compounds decreases gradually (from 79.87% and 88.12% in the first cycle to 74.15% and 80.45% in the third cycle for the B/A and NCs/B/A beads, respectively).

Number of adsorption/desorption cycles of B/A and NCs/B/A beads.
The results of Figure 13 show that there is very little metal desorption by the NCs/B/A beads with respect to that of B/A. This is due to the formation of complexation bonds between the amine and hydroxyl groups of chitosan and the metal ion, as the presence of electrostatic bonds between the metal and the tripolyphosphate ion makes the desorption by the NCs/B/A beads more difficult.
3.8.3 Modeling of the kinetics of copper adsorption
To describe the copper adsorption process on the B/A and NCs/B/A beads, the two pseudo-second models and intra particle diffusion were applied:
3.8.3.1 Pseudo-second order model
This model suggests the existence of chemisorption (45), an exchange of electrons per sample between a molecule of adsorbate and of solid adsorbent.
It is represented by the following formula:
The integration of the equation gives:
With:
k2: rate constant (g mg−1 min−1)
Qe: adsorption capacity at equilibrium (mg g−1)
t: time (min)
3.8.3.2 Model of the intra particle diffusion
The intra particle diffusion model is proposed by Weber and Morris (45). It is used to determine the phenomenon limiting the adsorption mechanism.
It is represented by the following equation:
with:
Ki: constant inter particle diffusion (mg g−1 min−1/2).
C: constant.
t1/2: half-reaction (adsorption equilibrium reaction).
3.8.3.3 Model of the pseudo-second order kinetics of the B/A and NCs/B/A beads
representative of the linear form of the pseudo-second-order kinetics, the k2 constant speed and the amount adsorbed at the balance Qe may be calculated graphically by plotting t/Qt vs. t.
The kinetics of the pseudo-second order, for each B/A and NCs/B/A adsorbent, is respectively illustrated in Figures 14 and 15.
![Figure 14: Kinetics of pseudo-second order copper on beads B/A [Cu2+]=10 mg/l; volume of the aqueous phase=10 ml; massadsorbant=60 mg; T=22°C;PH=6 and 400 rpm.](/document/doi/10.1515/epoly-2016-0318/asset/graphic/j_epoly-2016-0318_fig_014.jpg)
Kinetics of pseudo-second order copper on beads B/A [Cu2+]=10 mg/l; volume of the aqueous phase=10 ml; massadsorbant=60 mg; T=22°C;PH=6 and 400 rpm.
![Figure 15: Kinetics of the pseudo-second order of copper on NCs/B/A beads. [Cu2+]=10 mg/l; volume of the aqueous phase=10 ml; massadsorbant=60 mg; T=22°C;pH=6 et 400 tours/min.](/document/doi/10.1515/epoly-2016-0318/asset/graphic/j_epoly-2016-0318_fig_015.jpg)
Kinetics of the pseudo-second order of copper on NCs/B/A beads. [Cu2+]=10 mg/l; volume of the aqueous phase=10 ml; massadsorbant=60 mg; T=22°C;
pH=6 et 400 tours/min.
Figures 14 and 15 show that the experimental results perfectly follow the linear variation given by the equation representative of a pseudo-second order kinetics, and the values for the constant k2, the adsorption capacity Qe at the balance and R2 correlation parameter for B/A and NCs/B/A materials are shown in Table 1.
Pseudo-second order kinetic parameters for copper adsorption by B/A and NCs/B/A.
| Adsorbants | Pseudo-second order kinetic parameters | ||
|---|---|---|---|
| k2 (g mg−1 min−1) | Qe (mg g−1) | R2 | |
| B/A | 0.354 | 1.482 | 0.999 |
| NCs/B/A | 0.099 | 1.440 | 0.997 |
According to the results shown in Table 1, we note that the pseudo-second-order model is reliable in order to determine the order of adsorption kinetics of Cu2+ ions by the B/A and NCs/B/A beads as the correlation coefficient is close to 1 R2 equal to 0.999.
3.8.3.4 Model of the intra particle diffusion of the B/A and NCs/B/A beads
Generally there are four steps in the adsorption process by the porous solid and which are:
The transfer of solute from the solution to the boundary layer surrounding the particle.
The transfer of solute from the boundary layer to the adsorbent surface.
The transfer of solute to the adsorbent sites: dissemination in the micro and macro pores.
Interactions between the solute molecules and the active sites of the area: adsorption, complexation, and precipitation.
to the experimental data by plotting Qt based on t1/2 suggests the applicability of the intra particle diffusion model governing the adsorption kinetics.
Curves (Figures 16 and 17) have multi linearities implying the existence of several stages, indicating that the diffusion of Cu (II) ions to the surface of B/A and NCs/B/A is carried out in different stages. The experimental parameters calculated from this model are summarized in Table 2.
![Figure 16: Curve of the kinetic model of intraparticular diffusion for the adsorption of copper on B/A with [Cu2+]=10 mg/l; volume of the aqueous phase=10 ml; massadsorbant=60 mg; T=22°C; PH=6 and 400 rpm.](/document/doi/10.1515/epoly-2016-0318/asset/graphic/j_epoly-2016-0318_fig_016.jpg)
Curve of the kinetic model of intraparticular diffusion for the adsorption of copper on B/A with [Cu2+]=10 mg/l; volume of the aqueous phase=10 ml; massadsorbant=60 mg; T=22°C; PH=6 and 400 rpm.
![Figure 17: Curve of the intraparticular diffusion kinetic model for the adsorption of copper on the NCs/B/A beads with [Cu2+]=10 mg/l; Volume of the aqueous phase=10 ml; massadsorbant=60 mg; T=22°C; PH=6 and 400 rpm.](/document/doi/10.1515/epoly-2016-0318/asset/graphic/j_epoly-2016-0318_fig_017.jpg)
Curve of the intraparticular diffusion kinetic model for the adsorption of copper on the NCs/B/A beads with [Cu2+]=10 mg/l; Volume of the aqueous phase=10 ml; massadsorbant=60 mg; T=22°C; PH=6 and 400 rpm.
Kinetic parameters of intraparticular diffusion for adsorption of the copper by B/A and NCs/B/A.
| Adsorbants | Kinetic parameters of intraparticular scattering | ||
|---|---|---|---|
| ki (mg g−1 min−1/2) | C | R2 | |
| B/A | 0.115 | 0.458 | 0.905 |
| NCs/B/A | 0.062 | 1.013 | 0.853 |
According to the results shown in Table 2, the modeling has a multilinearity, meaning the existence of an evolution in the adsorption process (Figures 16 and 17). According to Namasivayam and Kavitha (46), the first step corresponds to a limitation by intra particle diffusion. The second phase, marked by a slowdown of evolution of qt corresponds to the equilibrium phase due to the depletion of the solute in solution (to Cu2+ ions).
3.8.4 Determination of adsorption isotherms
The adsorption isotherms are obtained by the graphic representation of Qe=f(Ce) where Qe and Ce are, respectively, the amount of copper adsorbed and the equilibrium concentration of this metal. The results are illustrated in both Figures 18 and 19 for the B/A and NCs/B/A beads, respectively.
![Figure 18: Isotherm of adsorption of copper (II) ions by the B/A beads [Cu2 +]=10 mg/l; Volume of the aqueous phase=10 ml; T=22°C; PH=6; 400 rpm and massadsorbant=(0–100 mg).](/document/doi/10.1515/epoly-2016-0318/asset/graphic/j_epoly-2016-0318_fig_018.jpg)
Isotherm of adsorption of copper (II) ions by the B/A beads [Cu2 +]=10 mg/l; Volume of the aqueous phase=10 ml; T=22°C; PH=6; 400 rpm and massadsorbant=(0–100 mg).
![Figure 19: Isothermal adsorption of copper (II) ions by NCs/B/A beads [Cu2+]=10 mg/l; volume of the aqueous phase=10 ml; T=22°C; PH=6; 400 rpm and massadsorbant=(0–100 mg).](/document/doi/10.1515/epoly-2016-0318/asset/graphic/j_epoly-2016-0318_fig_019.jpg)
Isothermal adsorption of copper (II) ions by NCs/B/A beads [Cu2+]=10 mg/l; volume of the aqueous phase=10 ml; T=22°C; PH=6; 400 rpm and massadsorbant=(0–100 mg).
The curves obtained show, according to the classification of Giles and colleagues, that the isotherm of the B/A and NCs/B/A beads is L-type (Figures 18 and 19, respectively). These curves may be mathematically described by the Langmuir or Freundlich equations. The more the number of sites occupied by the solute molecules increases, the more difficult is the adsorption of new molecules.
3.8.5 The isotherm modeling
The description of the adsorption isotherm was conducted by applying three models which are: the Langmuir, Freundlich and Temkin models.
3.8.5.1 Adsorption model of Langmuir
The assumptions of the Langmuir model are as follows: (47)
The molecules are adsorbed on a finite number of localized sites.
A single molecule can be adsorbed per site.
All sites are energetically equivalent.
The interactions between the adsorbed molecules and their neighbors are neglected.
It can be represented by the following equation [10]:
With:
KL: Equilibrium constant of Langmuir.
Qmax: Maximum adsorption capacity.
The linearization of the equation [11] is given as:
The equation thus obtained is that of a straight line of slope
The viability of the adsorption can be defined from the dimensionless separation factor RL:
If RL>1: the conditions of the adsorption are unfavorable.
If RL<1: the conditions of the adsorption are favorable.
If RL=0: the adsorption is irreversible.
The linear form of the Langmuir isotherm of the B/A and NCs/B/A beads is shown in Figures 20 and 21, respectively.
Linear form of the isotherm Langmuir B/A beads.

Linear form of the isotherm Lamgmuir NCs/B/A beads.
The modeling showed, for the B/A beads, that the Langmuir model fits well to the experimental points, the value of the correlation parameter is close to 1 (R2=0.991). The calculated value of RL of 0.282 less than 1 enables to conclude that the adsorption of Cu2+ occurs favorably on the B/A support.
It is noted that the correlation factor calculated from the linear form of the Langmuir isotherm for the NCs/B/A beads is equal to R2 at 0.88. Suggesting that this model is less applicable.
Most hypotheses by Langmuir are not valid for the adsorption of a pollutant from a solution, so the Langmuir equation becomes an empirical equation.
The usefulness of the Langmuir equation to describe the liquid-solid adsorption phenomena in any way means that the adsorption processes meet the physical criteria originally used for the derivation.
The interpretation of the physical meaning of isotherm parameters must always be made with caution.
3.8.5.2 Freundlich model
This model is based on the two following assumptions:
The amount of sites capable of adsorbing the compound is unlimited.
The chemical affinities of sites decrease as the amount adsorbed increases.
This is the nonlinear adsorption model most used. This isotherm equation is the most used to represent the experimental data. Adsorbed and in solution concentrations are connected by the relation [13] (48), (49):
KF, n: represent the constants of Freundlich.
The parameters KF and n are experimentally determined from the linear form of the isotherm. Linearization of this equation [14] involves a shift of words in logarithmic form:
The shape of the isotherm will depend on the value of 1/n and will be able to give vital information about the mechanisms governing the adsorption of the compound on the solid. Depending on the value of 1/n, differ the isotherms gaits that were defined before; thus we distinguish (49):
1/n=1; H-type isotherm.
1/n>1; convex isotherm of type L
1/n<1;concave isotherm of type S
1/n<<1; linear isotherm of type C
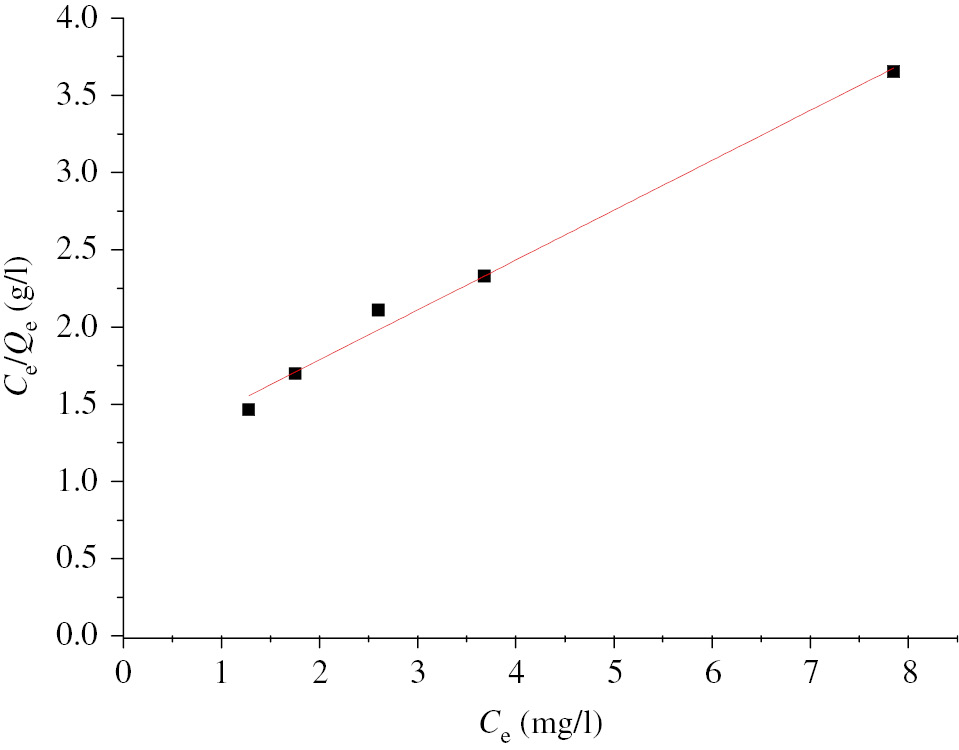
The linear form of the Freundlich isotherm of the B/A and NCs/B/A beads is shown in Figures 22 and 23, respectively.

Linear form of the Freundlich isotherm B/A beads.
linear form of the isotherm Freundlich NCs/B/A beads.
The Freundlich model seems applicable in the case of the adsorption of copper on the B/A and NCs/B/A beads, with a correlation parameter very close to 1 (R2=0.990, R2=0.994, respectively), which involves a heterogeneity of the surface with the presence of sites related to the composite beads of B/A and NCs/B/A.
The parameter values 1/n obtained by the Freundlich model for the B/A and NCs/B/A beads equal to 0.5 and 0.786, respectively, are below 1 and show that the isotherms are Type L, result obtained experimentally; therefore the Freundlich model best describes the copper adsorption process on the B/A and NCs/B/A beads.
3.8.5.3 Temkin model
Temkin suppose that the lowering of the heat of adsorption with increasing the recovery rate is not logarithmic as in the case of systems leading to the Freundlich equation, but is linear especially at medium and low recovery rates;
This linearity (50) may be due to:
The repulsion between adsorbed species on the uniform surface.
The heterogeneity of the surface.
The Temkin isotherm is represented by the following equation [15]:
With:
Θ: Recovery rate of the adsorbent surface.
Ce: Concentration at equilibrium, expressed as (mg/l).
Qe: Product quantity adsorbed per unit of adsorbent mass expressed as (mg/g).
Qmax: Theoretical maximum capacity expressed as (mg/g).
ΔQ: Represents the variation of adsorption energy (J·mol−1).
KT: Equilibrium constant of Temkin.
The linearization of Temkin equation [16] leads to:
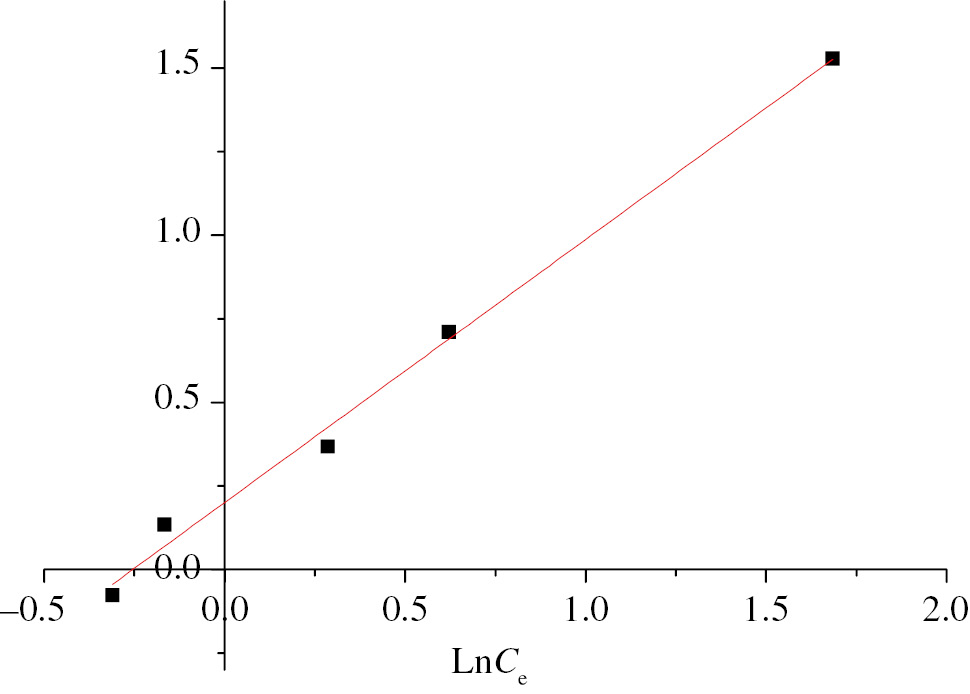
By plotting Qe=f(LnCe), a straight line is obtained, whose slope and he ordinate at the origin enable to determine the heat of adsorption ∆Q and the constant KT balance.
The linear form of the Temkin isotherm of the B/A and NCs/B/A beads is shown in Figures 24 and 25, respectively.

Linear form of the isotherm Temkin B/A beads.

Linear form of the isotherm Temkin NCs/B/A beads.
Linearization of the Temkin model with a correlation factor R2 very close to 1 (0.987 and 0.954) shows that this model is applicable for the adsorption of copper by the B/A and NCs/B/A beads.
The adsorption heat ΔQ obtained by the linearity of the Temkin model is positive; it shows an endothermic adsorption for both organic adsorbents.
The experimental parameters calculated from the models used are summarized in Table 3.
Parameters of adsorption isotherms of copper (II) ions characterizing each model by the two adsorbents B/A and NCs/B/A.
| Model parameters | B/A | NCs/B/A | |
|---|---|---|---|
| Langmuir | KL | 0.282 | 0.110 |
| Qm (mg/g) | 3.10 | 12.21 | |
| R2 | 0.991 | 0.880 | |
| RL | 0.261 | 0.476 | |
| Freundlich | Kf | 1.27 | 1.222 |
| 1/n | 0.500 | 0.786 | |
| R2 | 0.992 | 0.994 | |
| Temkin | KT | 2.424 | 1.97 |
| ΔQ (j/mol) | 10.577 | 16.275 | |
| R2 | 0.987 | 0.954 | |
Table 3 shows that the linear correlation coefficients for the Freundlich model are closer to 1 than those of Langmuir and Temkin models.
We can conclude that the Freundlich model is the most adequate to describe the adsorption isotherm of copper by the two systems studied.
4 Conclusion
The main available results point to the conclusion that during this study, whose purpose was to prepare a natural bio-adsorbent based on NCs, bentonite and alginates produced good evidence for their use as natural supports in the adsorption of cupric ions.
The extraction of chitin followed by its modification by deacetylation gave very satisfactory results and in line with those found in the literature (DD=85.49%, DA=14.5% and a molecular weight of 192.97 kDa).
The result of the FTIR analysis showed the appearance of bands at 1530 cm−1 and in the region at 1200 and 1100 cm−1 and at 973, 895 cm−1 which confirms the formation of CNs by ionic interactions between chitosan and tripolyphophate. This analysis also showed that the NH and OH groups are the most important sites in the adsorption mechanism of the NCs/B/A beads. The results of XRD analysis showed the amorphous nature of the NCs/B/A beads which increases the adsorption process. It can also be observed from SEM evidence the spherical form of chitosan nanoparticles and the heterogeneous surface of the NCs/B/A beads.
According to the results of copper adsorption on our two synthesized supports based on NCs/B/A and B/A, it can be noticed that:
B/A beads equilibrium is reached after 40 min with a yield of 75.7% at a pH 6. In these same conditions the NCs/B/A beads reach equilibrium after only 10 min, with a yield of 86%.
Modeling of the adsorption kinetics by the two models such as: pseudo-second-order and intra particle diffusion is reliable for both adsorbents (B/A and NCs/B/A).
In addition, both adsorbents have the same aspect of isotherm of L-type.
At the end, the three isotherm models namely Freundlich, Langmuir and Temkin can be applied. It is noted that the Freundlich model responds better to describe the adsorption on both adsorbents (higher correlation factor values).
References
1. Bhatnagar A, Sillanpä M. Applications of chitin- and chitosan-derivatives for the detoxification of water and wastewater. a short review. Adv Colloid Interface. 2009;152:26–s38.10.1016/j.cis.2009.09.003Suche in Google Scholar PubMed
2. Crini G, Badot PM. Application of chitosan, a natural aminopolysaccharide for dye removal from aqueous solutions by adsorption processes using batch studies. A review of recent literature. Progress Polymer Science. 2008;33:399–447.10.1016/j.progpolymsci.2007.11.001Suche in Google Scholar
3. Gandhi MR, Kousalya GN, Viswanathan N, Meenakshi S. Sorption behaviour of copper on chemically modified chitosan beads from aqueous solution. Carbohydr Polym. 2011; 38:1082–7.10.1016/j.carbpol.2010.08.079Suche in Google Scholar
4. Huang KS, Sheu YR, Chao IC. Preparation and properties of nanochitosan. Plast Technol Eng. 2009;48:1–5.10.1080/03602550903159069Suche in Google Scholar
5. Savage N, Diallo MS. Nanomaterials and water purification opportunities and challenges. J Nanopart. 2005;7:331–42.10.1007/s11051-005-7523-5Suche in Google Scholar
6. Akbari H, Mehrabadi A, Torabian A. Determination of nanofiltration efficency in arsenic removal from drinking water. Iran. J. Environ Health Sci Eng. 2010;7:273–8.Suche in Google Scholar
7. Seyedmohammadi J, Motavasse M, Maddahi MH, Nikmanesh S. Application of nanochitosan and chitosan particles for adsorption of Zn(II) ions pollutant from aqueous solution to protect environment. Model Earth Syst Environ. 2016;2:165–77.10.1007/s40808-016-0219-2Suche in Google Scholar
8. Sheng L, Zhou L, Huang Z, Liu Z, Chen Q, Huang G, Adesina A. Facile synthesis of magnetic chitosan nano-particles functionalized with N/O-containing groups for efficient adsorption of U(VI) from aqueous solution. J Radioanal Nucl Chem. 2016;310:1361–71.10.1007/s10967-016-5014-zSuche in Google Scholar
9. Sheng L, Zhou L, Huang Z, Liu Z, Chen Q, Huang G, Adesina A. Adsorption of uranium(VI) from aqueous solution using magnetic carboxymethyl chitosan nano-particles functionalized with ethylenediamine. J Radioanal Nucl Chem 2016;308:935–46.10.1007/s10967-015-4525-3Suche in Google Scholar
10. Tiwari A, Dewangana T, Bajpai AK. Removal of toxic as (V) ions by adsorption onto alginate and carboxymethyl cellulose beads. J Chinese Chem Soc. 2008;55:952–61.10.1002/jccs.200800142Suche in Google Scholar
11. Ociński D, Jacukowicz-Sobala I, Kociołek-Balawejder E. Alginate beads containing water treatment residuals for arsenic removal from water – formation and adsorption studies. Environ Sci Pollut Res. 2016;23:24527–39.10.1007/s11356-016-6768-0Suche in Google Scholar PubMed
12. Mahmood Z, Amin A, Zafar U, Amir Raza M, Hafeez I, Akram A. Adsorption studies of cadmium ions on alginate–calcium carbonate composite beads. Appl Water Sci. 2015:1–7. Doi: 10.1007/s13201-015-0302-2.Suche in Google Scholar
13. Qi Y, Jiang M, Cui YL, Zhao L, Zhou X. Synthesis of quercetin loaded nanoparticles based on alginate for Pb(II) adsorption in aqueous solution. Nanoscale Res Lett. 2015;10:408–17.10.1186/s11671-015-1117-7Suche in Google Scholar PubMed PubMed Central
14. Talaat HA, El Defrawy NM, Abulnour AG, Hani HA, Tawfik A. Evaluation of heavy metals removal using some Egyptian clays. IPCBEE. 2011;6:37–42.Suche in Google Scholar
15. Lukman S, EssaMu’azu MH, Bukhari ND, Basheer A. Adsorption and desorption of heavy metals onto natural clay material influence of initial pH. J Environ Sci Technol. 2013;6:1–15.10.3923/jest.2013.1.15Suche in Google Scholar
16. El-Maghrabi H, Mikhail S. Removal of heavy metals via adsorption using natural clay material. J Env Earth Sci. 2014;4:38–46.Suche in Google Scholar
17. Kostin AV, Mostalygina LV, Bukhtoyarov OI. The mechanism of adsorption of zinc and cadmium ions onto bentonite clay. Prot Met Phys Chem Surf. 2015;51:773–8.10.1134/S2070205115050172Suche in Google Scholar
18. Bourliva A, Michailidis K, Sikalidis C, Filippidis A, Betsiou M. Erratum to: adsorption of Cd(II), Cu(II), Ni(II) and Pb(II) onto natural bentonite: study in mono- and multi-metal systems. Environ Earth Sci. 2015;73:5445.10.1007/s12665-014-3912-3Suche in Google Scholar
19. Dima JB, Sequeiros C, Zaritzky NE. Hexavalent chromium removal in contaminated water using reticulated chitosan micro/nanoparticles from seafood processing wastes. Chemosphere. 2015;141:100–11.10.1016/j.chemosphere.2015.06.030Suche in Google Scholar PubMed
20. Calvo P, Remunan-Lopez C, Vila-Jato JL, Alonso MJ. Chitosan and chitosan/ethylene oxide-propylene oxide block copolymer microparticles as novel carriers for proteins and vaccines. Pharm Res. 1997;14:1431–6.10.1023/A:1012128907225Suche in Google Scholar
21. Tzu TW, Tsuritani T, Sato K. Sorption of Pb(II), Cd(II), and Ni(II) toxic metal ions by alginate-bentonite. J Environ Prot. (Irvine, Calif) 2013;4:51–5.10.4236/jep.2013.41B010Suche in Google Scholar
22. Ngah WS, Fatinathan S. Adsorption of Cu (II) ions in aqueous solution using chitosan beads, chitosan–GLA beads and chitosan-alginate beads. Chem Eng J. 2008;143:62–72.10.1016/j.cej.2007.12.006Suche in Google Scholar
23. Dima JB, Sequeiros C, Zaritzky NE. Hexavalent chromium removal in contaminated water using reticulated chitosan micro/nanoparticles from seafood processing wastes. Chemosphere 2015;141:100–11.10.1016/j.chemosphere.2015.06.030Suche in Google Scholar
24. Saleh TA, Gupta VK. Processing methods, characteristics and adsorption behavior of tire derived carbons. a review. Adv Colloid Interf Sci. 2014;211:93–101.10.1016/j.cis.2014.06.006Suche in Google Scholar
25. Malesu VK, Sahoo D, Nayak PL. Chitosan-sodium alginate nanocomposites blended with cloisite 30B as a novel drug delivery system for anticancer drug curcumin. Int J Appl Biol Pharm Technol. 2011;2:402–11.Suche in Google Scholar
26. Ibezim C, Andrade CT, Marcia C, Barretto B, Odimegwu DC, DeLi FF. Malonically cross-linked chitosan/TPP microparticles for the controlled delivery of pyrimethamine. Ibnosina J Med BS. 2011;3:77–88.10.4103/1947-489X.210876Suche in Google Scholar
27. Lee ST, Mi FL, Shen YJ, Shyu SS. Equilibrium and kinetic studies of copper (II) ion uptake by chitosan-tripolyphosphate chelating resin. Polymer. 2001;42:1879–92.10.1016/S0032-3861(00)00402-XSuche in Google Scholar
28. Hosseini SF, Zandi M, Rezaei M, Farahmandghavi F. Two-step method for encapsulation of oregano essential oil in chitosan nanoparticles: preparation, characterization and in vitro release study. Carbohydr Polym. 2013;95:50–6.10.1016/j.carbpol.2013.02.031Suche in Google Scholar
29. Pawlak A, Mucha M. Thermogravimetric and FTIR studies of chitosan blends. thermochimica Acta. 2003;396:153–66.10.1016/S0040-6031(02)00523-3Suche in Google Scholar
30. Pearson FG, Marchessault RH, Liang CY. Infrared spectra of crystalline polysaccharides. Biochim Biophys Acta. 1960;45:499–507.10.1016/0006-3002(60)91486-4Suche in Google Scholar
31. Randelovic MS, Purenovic MM, Matovic BZ. Structural, textural and assorption characteristics of bentonite-based composite. Micropor Mesopor Mat. 2014;195:67–74.10.1016/j.micromeso.2014.03.031Suche in Google Scholar
32. Feng Y, Hu W, Cheng C, Liu R, Wang C, Li J, Lin Q. Preparation and evaluation of alginate-chitosan-bentonite based beads for the delivery of pesticides in controlled-release formulation. Asian J Chem. 2013;25(17):9936–40.10.14233/ajchem.2013.15671Suche in Google Scholar
33. Azhara FF, Oladb A. A study on sustained release formulations for oral delivery of 5-fluorouracil based on alginate-chitosan/montmorillonite nanocomposite systems. Appl Clay Sci. 2014;101:288–96.10.1016/j.clay.2014.09.004Suche in Google Scholar
34. Sulakova R, Olivera-Campos AM, Hrdina R, Soares GM. Decolourisation of an anthraquinone dye with copper complexes. International Conference On Pigments, Dyes And Functional Dyes, “Proceedings”. Pardubice: VUOS. 2004: 1–11.Suche in Google Scholar
35. Taboada E, Cabrera G, Cardenas G. Retention capacity of chitosan for copper and mercury ions. J Chil Chem Soc. 2003;48:7–12.10.4067/S0717-97072003000100002Suche in Google Scholar
36. Qun Wu L, Ghodssi R, Elabd YA, Payne GF. Biomimetic pattern transfer. Adv Funct Mater. 2005;15:189–95.10.1002/adfm.200400279Suche in Google Scholar
37. Ngah WS, Fatinathan S. Pb (II) biosorption using chitosan and chitosan derivatives beads: Equilibrium, ion exchange and mechanism studies. J Environ Sci. 2010;22:338–46.10.1016/S1001-0742(09)60113-3Suche in Google Scholar
38. Dai J, Yang H, Yan H, Shangguan Y, Zheng Q, Cheng R. Phosphate adsorption from aqueous solutions by disused adsorbents: chitosan hydrogel beads after the removal of copper (II). Chem Eng J. 2011;166:970–7.10.1016/j.cej.2010.11.085Suche in Google Scholar
39. Gupta SS, Bhattacharyya KG. Adsorption of Ni(II) on clays. J Colloid Interface Sci. 2006;295:21–32.10.1016/j.jcis.2005.07.073Suche in Google Scholar PubMed
40. Laus R, Fávere VTD. Competitive adsorption of Cu(II) and Cd(II) ions by chitosan crosslinked with epichlorohydrin-triphosphate. Bioresour Technol. 2011;102:8769–76.10.1016/j.biortech.2011.07.057Suche in Google Scholar PubMed
41. Ofomaja AE, Ho YS. Equilibrium sorption of anionic dye from aqueous by palm kernel fibre as sorbent. Dyes Pigm. 2007;74:60.10.1016/j.dyepig.2006.01.014Suche in Google Scholar
42. Srivastava VC, Mall ID, Mishra IM. Characterization of mesoporous rice husk ash (RHA) and adsorption kinetics of metal ions from aqueous solution onto RHA. J Hazard Mater. 2006:134–257.10.1016/j.jhazmat.2005.11.052Suche in Google Scholar PubMed
43. El-Sayed GO, Dessouki HA, Ibrahim SS. Biosorption of Ni (II) and Cd (II) ions from aqueous solutions onto rice straw. Chem Sci J. CSJ-9. 2010:1–9.10.4172/2150-3494.1000007Suche in Google Scholar
44. Kamba EA, Otuonye UC, Barminas JT, Magomya AM, Andre C. Removal of Chromium (VI) as a heavy metal from aqueous solution using Chitin obtained from Bargi fish (Heterotis Miloticus) scale. Sci-Afric J Sci Issues Res Essays. 2014;2:128–31.Suche in Google Scholar
45. Simonin JP. On the comparison of pseudo-first order and pseudo-second order rate laws in the modeling of adsorption kinetics. Chem Eng J. 2016;300:254–63.10.1016/j.cej.2016.04.079Suche in Google Scholar
46. Kavitha D, Namasivayam C. Capacity of activated carbon in the removal of acid brilliant blue: Determination of equilibrium and kinetic model parameters. Chem Eng J. 2008;139–453.10.1016/j.cej.2007.08.011Suche in Google Scholar
47. Langmuir I. The constitution and fundamental propreties os solids and liquids. Am J Chem. 1916;38:2221–95.10.1021/ja02268a002Suche in Google Scholar
48. Ahmad AL, Sumathi S, Hameed BH. Adsorption of residue oil from palm oil mill effluent using powder and flake chitosan: equilibrium and kinetic studies. Water Res. 2005;39:2483–94.10.1016/j.watres.2005.03.035Suche in Google Scholar PubMed
49. Hameed BH, El-Khaiary MI. Batch removal of malachite green from aqueous solutions by adsorption on oil palm trunk fibre: equilibrium isotherms and kinetic studies. J Hazardous Mater. 2008;154:237–44.10.1016/j.jhazmat.2007.10.017Suche in Google Scholar PubMed
50. Tempkin MI, Pyzhev V. Kinetics of ammonia synthesis on promoted iron catalyst. Acta Phys Chim. USSR 1940;12: 327–56.Suche in Google Scholar
©2017 Walter de Gruyter GmbH, Berlin/Boston
This article is distributed under the terms of the Creative Commons Attribution Non-Commercial License, which permits unrestricted non-commercial use, distribution, and reproduction in any medium, provided the original work is properly cited.
Artikel in diesem Heft
- Frontmatter
- In this Issue
- Elastic recovery of polyamide 6 matrix nanocomposites and their basalt fiber co-reinforced hybrids
- Bio-based chitosan/PVdF-HFP polymer-blend for quasi-solid state electrolyte dye-sensitized solar cells
- Synergistic effects of retinoic acid and graphene oxide on the physicochemical and in-vitro properties of electrospun polyurethane scaffolds for bone tissue engineering
- Non-isothermal crystallization and thermal degradation kinetics of MXene/linear low-density polyethylene nanocomposites
- Extraction and characterization of chitin and chitosan: applications of chitosan nanoparticles in the adsorption of copper in an aqueous environment
- Systematic evaluation of pH and thermoresponsive poly(n-isopropylacrylamide-chitosan-fluorescein) microgel
- Plasticizer effect on melt blending of polylactide stereocomplex
- Polypropylene/basalt thick film composites: structural, mechanical and dielectric properties
- Performance properties of rigid polyurethane-polyisocyanurate/brewers’ spent grain foamed composites as function of isocyanate index
- Synthesis and characterization of polyvinylmethylsiloxanes by cationic polymerization using a solid green catalyst