Assessment and optimization of photovoltaic systems at the University Ibn Tofail according to the new law on renewable energy in Morocco using HOMER Pro
-
Chakib El Mokhi

 ,
Oumaima Choukai
,
Hanaa Hachimi
and
Ahmed Ait Errouhi
,
Oumaima Choukai
,
Hanaa Hachimi
and
Ahmed Ait Errouhi

Abstract
The current study aims to investigate and optimize the photovoltaic systems currently in operation at the University of Ibn Tofail in Kenitra, Morocco. The University has started already since 2017 to integrate photovoltaic systems in the form of carports with the objective to reduce the invoices for electricity supplied from the utility grid by at least around 40%. Until then, the University avoided selling the energy surplus to the local electricity provider due to complicated bureaucratic regulations. However, due to the new law on renewable energy adopted by the Moroccan government in November 2021, it will be possible for private households and public service buildings to sell the entire excess of energy produced by renewable energy systems instead of only 20% of the surplus according to the previous law 13-09. For this purpose, this research project seeks to verify whether an expansion of the available photovoltaic installations and the sale of the energy surplus is worthwhile or not. This research work has been done with the optimization software HOMER Pro and presents the obtained optimized results and proposals of two new scenarios in comparison to already existing photovoltaic arrays.
Introduction
Renewable energies are becoming more and more attractive to mankind in an attempt to reduce greenhouse gases and realize energy independence (Brunet et al. 2022). In 2009, Morocco adopted an energy strategy based essentially on renewable energies, the development of energy efficiency and the strengthening of regional integration (Cantoni and Rignall 2019).
This strategy, divided into programs with precise objectives and accompanied by targeted legislative and institutional reforms, has demonstrated its effectiveness and relevance, enabling Morocco to become a country that produces energy from renewable sources, while it was entirely dependent on foreign countries to meet its fossil fuel needs (Brunet et al. 2022; Chen et al. 2021a; Komendantova 2021).
Renewable energy is an important component of Morocco’s energy strategy, which has a large potential of renewable energy, the use of which will allow it to meet a significant part of its growing needs by replacing fossil fuels; thus, the Moroccan strategy aims to increase the share of renewable energy in installed electrical capacity to over 52% by 2030.
Morocco has adopted a new approach by adopting an additional program aimed at equipping all planned seawater desalination plants with renewable energy generation units to give them autonomy and energy savings (Cantoni and Rignall 2019).
This new strategy aims as well to explore new energy sources, such as the conversion of waste (biomass) in the major Moroccan metropolises and the use of renewable energy wherever possible. This vision has begun to bear results, since 111 renewable energy projects have already been implemented or are in the development phase (Cantoni and Rignall 2019; Komendantova 2021). Installed renewable energy capacity reached 3950 MW, representing about 37% of the electricity mix (750 MW from solar power, 1430 MW from wind power and 1770 MW from hydro power). Renewable energy accounts for about 20% of electricity generation and the energy dependency ratio has decreased from 97.5% in 2009 to 90.51% currently.
The new Law 82-21, modifying and completing law 13-09 on renewable energy, was prepared in consultation with private operators, public entities and the ministries involved. The objective of the law is to improve the legal and regulatory framework for the implementation of renewable energy projects by private companies, while ensuring the security and sustainability of the national electricity system and the balance of all its components (Chen et al. 2021a). In addition, the new law allows private households and public service buildings to sell the entire energy excess instead of only 20% of the surplus in the previous law.
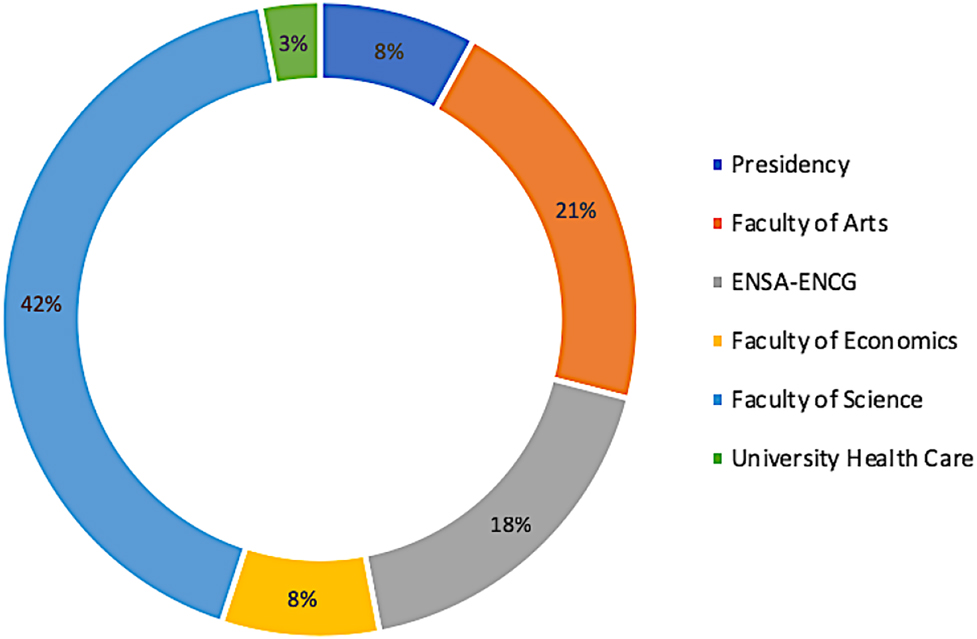
The University of Ibn Tofail including its different facilities in Kenitra has taken action to reduce energy consumption already in 2017 with the installation of photovoltaic (PV) system in the form of carport shown in details in Table 1. However, the energy consumption still remains too high. The annual consumption was until the end of 2021 around 1553 MWh. The breakdown of electricity demand across the facilities in the University Ibn Tofail is shown in Figure 1.
PV carports of Ibn Tofail University.
| Name of carport | Commissioning year | Capacity [kWp] | Model of PV panels | Converter model | Quantity | Nominal output [kW] |
|---|---|---|---|---|---|---|
| Presidency | 2017 | 21 | JinkoSolar JKM270-60PP | Fronius Symo 20 | 1 | 20 |
| Faculty of Science | 2018 | 60 | JinkoSolar JKM280-60PP | Fronius Symo 21 | 3 | 60 |
| Center of further education | 2019 | 35 | Bisol BXU-330 XL Poly | Delta RPI M30A | 1 | 35 |
| Faculty of Arts | 2020 | 49 | JAM60S01 300–320/PR | Huawei 20KTL | 2 | 40 |
Energy demand of the University facilities.
Unfortunately, due to technical and procedural problems, the University is unable to sell the surplus energy produced by the PV systems to the local grid operator. Nevertheless, this has changed with the new law for renewable energy, which requires the electricity suppliers to take over the energy excess from private households and public service buildings.
The objective of this work is mainly to assess if the current PV installations are sufficient based on the Levelized Cost of Energy (LCoE) or if it is worthwhile to expand this PV systems in order to sell the energy excess to the local grid provider. For this purpose, the trial version of the software HOMER Pro (Hybrid Optimization of Multiple Energy Resources) was used for the first time at the University Ibn Tofail to assess the existing PV systems. This software, originally developed at the National Renewable Energy Laboratory of the U.S. Department of Energy, and combines powerful tools so that engineering and economics work side by side (Khalil et al. 2021; Singh, Baredar, and Gupta 2015).
Research methodology
Solar PV model
The photovoltaic panel is an entity composed of several cells (Boccalatte, Fossa, and Sacile 2021) as shown in Figure 2. In fact, the cell can be described by an equivalent electrical circuit, which contains a photocurrent source, a diode and internal resistances connected (Zhang et al. 2022) as described in Figure 3.
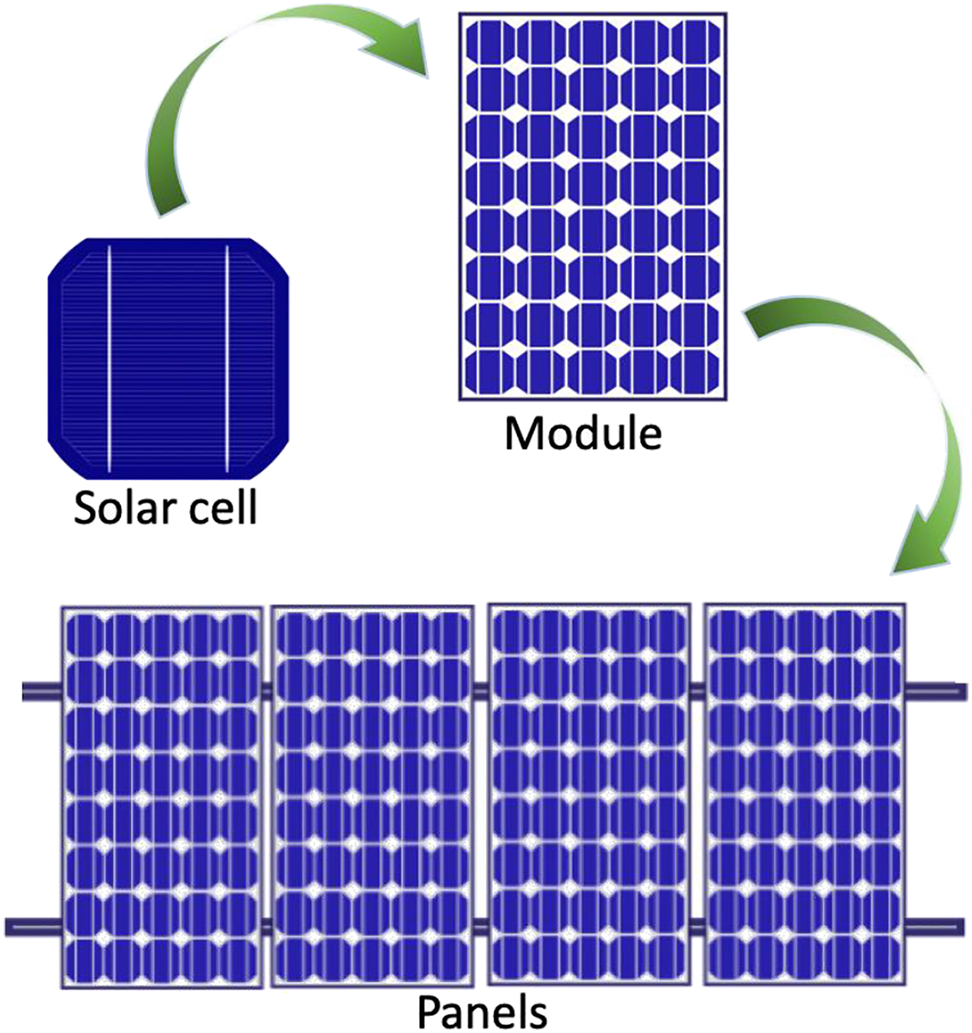
Presentation of a solar cell, panel and photovoltaic array.
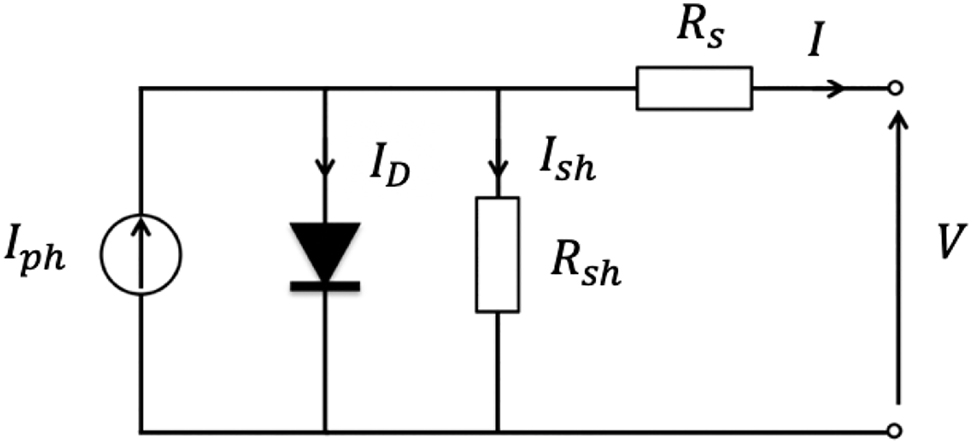
Solar cell equivalent circuit.
The current obtained from the photovoltaic cell can be expressed by Eq. (1) (Chen et al. 2021b; Shi et al. 2021; Zhang et al. 2022):
Where Iph is the photocurrent of the photovoltaic cell, Io is the reverse saturation current and ID is the diode current. K, q, n and T denote the Boltzmann constant, electron charge, diode ideality factor (Table 2) and cell temperature, respectively (Ghani, Duke, and Carson 2013; Yaman and Arslan 2021). V is the voltage across the cell, I is the cell current, Rs and Rsh are the series and shunt resistances of the cell (Ghani, Duke, and Carson 2013).
Ideality factor for different materials.
| Technology | Ideality factor |
|---|---|
| Si-mono | 1.2 |
| Si-poly | 1.3 |
| a-Si-H | 1.8 |
| a-Si-H tandem | 3.3 |
| a-Si-H triple | 5 |
| CdTe | 1.5 |
| CTs | 1.5 |
| AsGa | 1.3 |
The I − V characteristic of a photovoltaic module is represented by Eqs. (2)–(4) (Chen et al. 2021b):
whereas:
and
I ph, Io, NS, V, I, T, n, G, Rs and Rsh are respectively, the photocurrent, the reverse saturation current of the diode, the number of cells in series, the voltage at terminals of the module, the electric current of the module, the ambient temperature in Kelvin, the ideality factor, the solar irradiation in w/m2, the series and shunt resistances of the module (Chen et al. 2021b).
Therefore, the physical behavior of the photovoltaic module is related to Iph, Io, Rs and Rsh on the one hand, and on the other hand with two other environmental parameters namely temperature and solar irradiation (Chen et al. 2021b; Ghani, Duke, and Carson 2013; Shi et al. 2021; Zhang et al. 2022).
The results of modeling the JinkoSolar JKM270PP-60 module used in the carport of the University presidency are shown in Figure 4. According to Figure 4a and b, the current and power of the PV module depend strongly on the solar irradiation (Al-Masri et al. 2016). However, the voltage remains almost constant. On the other hand, the increase in temperature affects the voltage and power of the PV module, which decrease proportionally as shown in Figure 4c and d. However, the short-circuit current remains unchanged.
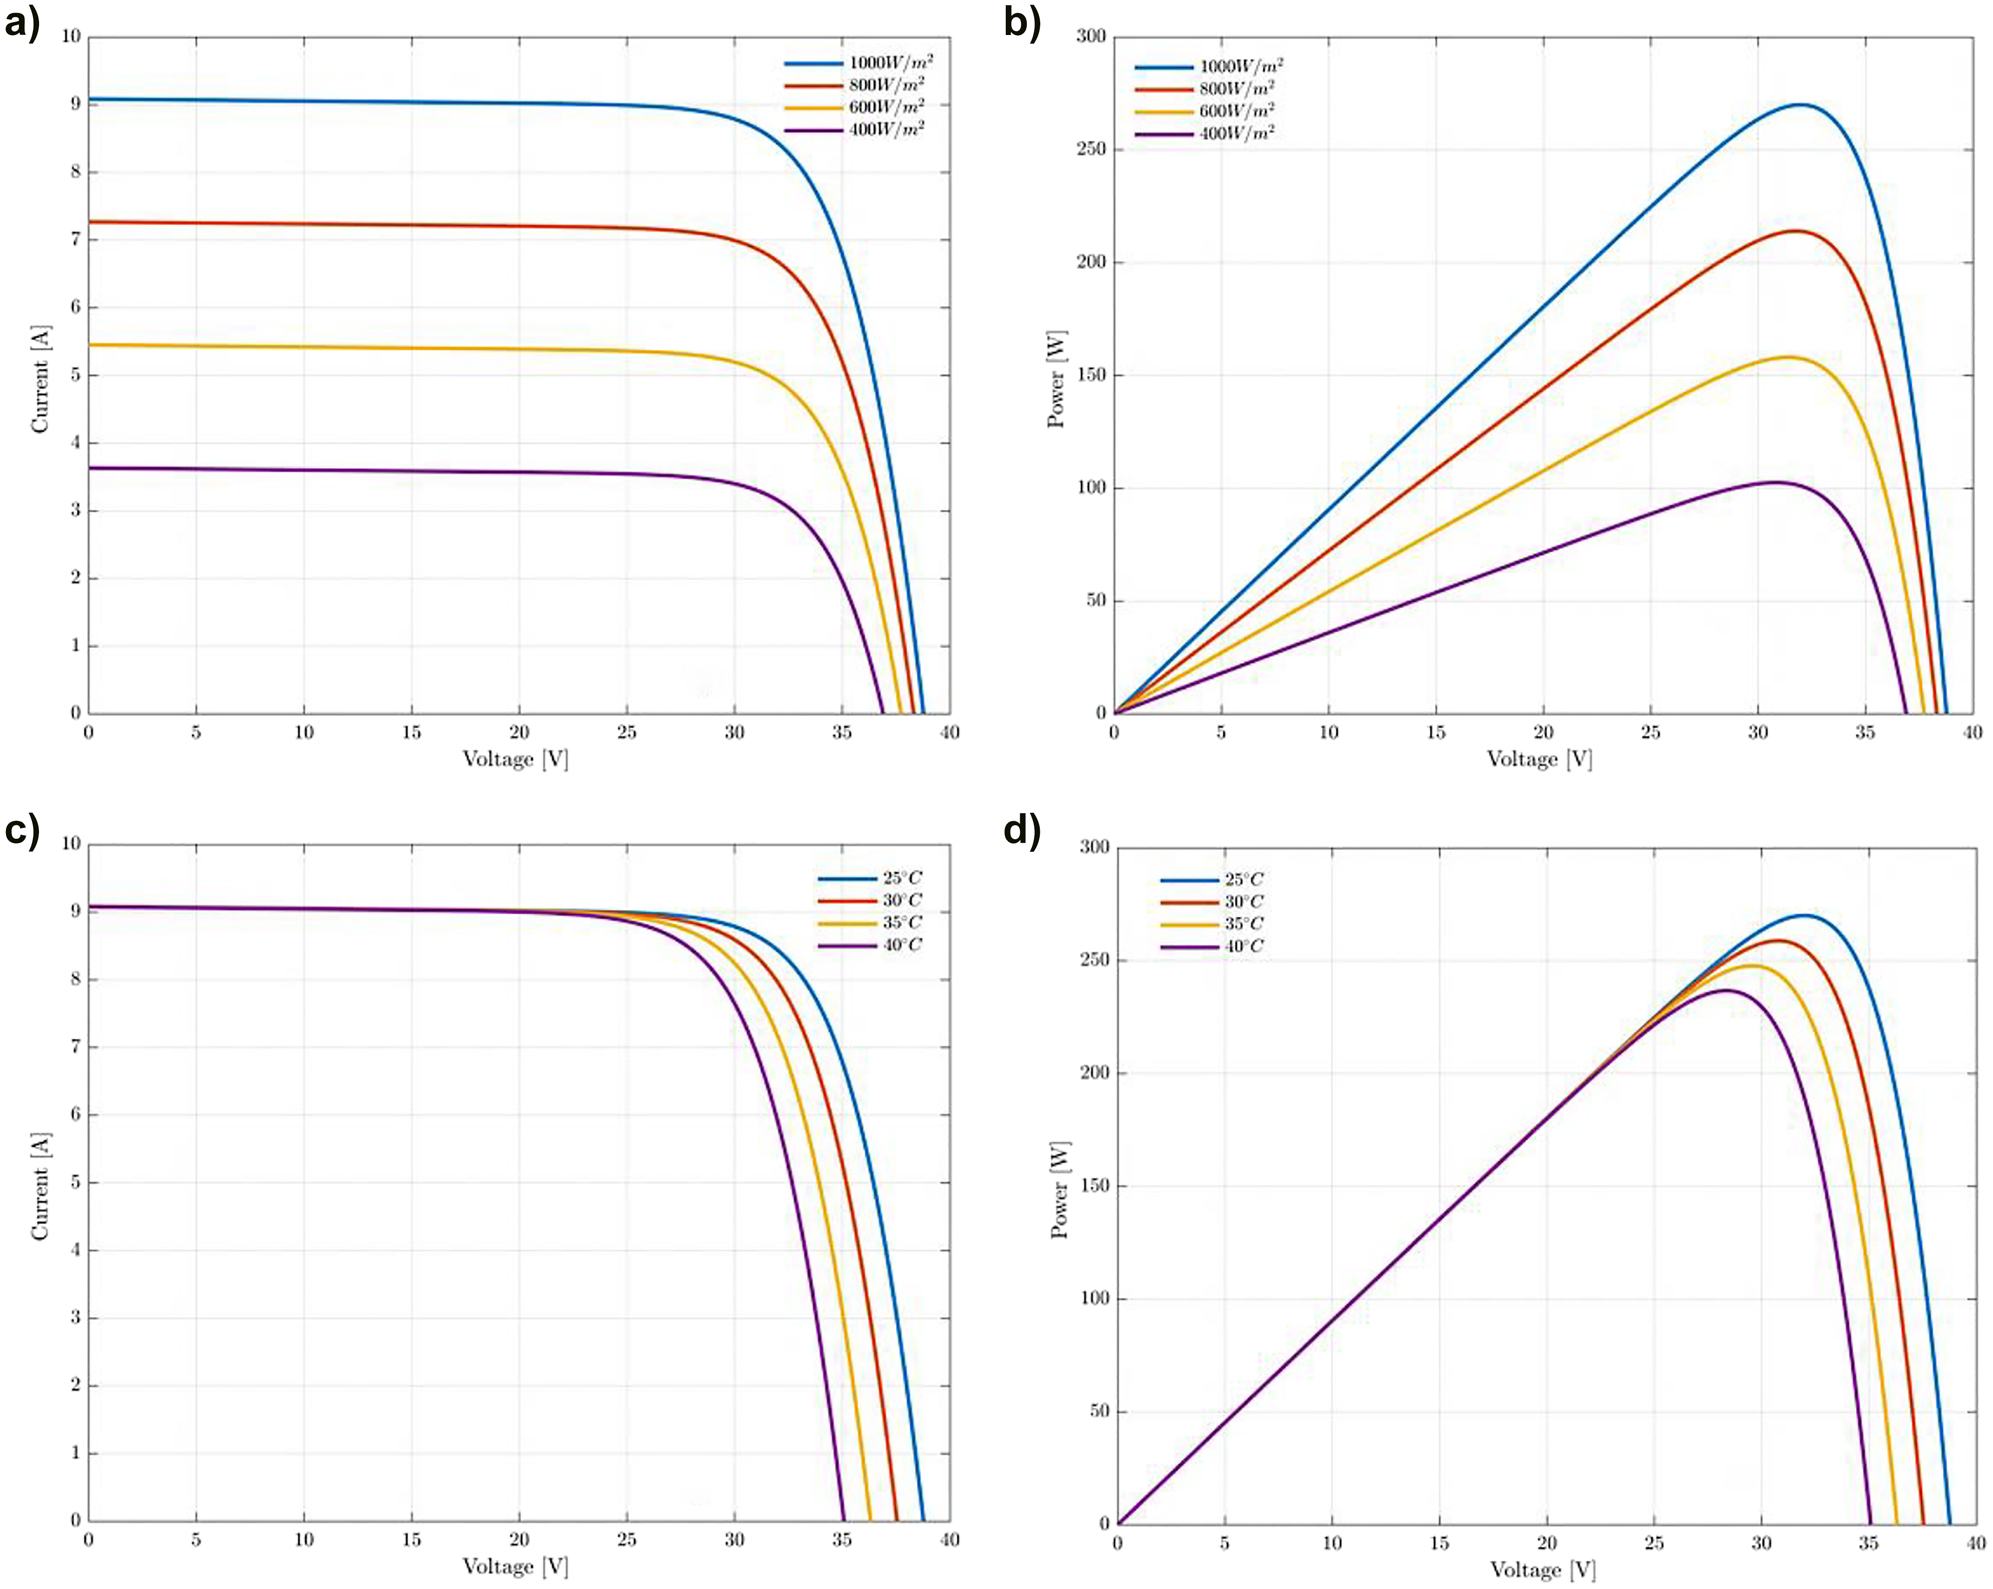
Impact of irradiation (a, b) and temperature (c, d) on the current and power of the PV module.
Maximum Power Point Tracking (MPPT) controller
The point on the I − V curve at which the solar module operates at a given time is called the operating point (OP) and corresponds a certain irradiance (G) and temperature (T), which negatively affects the extracted power from the module (Sousa et al. 2022). Without the use of external electrical control, the module’s OP is mainly determined by line and load changes applied to the module at its output (Baba, Liu, and Chen 2020; Sousa et al. 2022). The I − V curve represents the power generated and supplied to the load at the terminals of the module. Hence, it is significant to ensure this solar module is running at its maximum power point (MPP). To achieve maximum power output, it is necessary to force the module to operate at the OP corresponding to the point of maximum power. However, as both G and T change, the I − V curve changes similarly, resulting a new MPP as the previous MPP (OP) expires (Moghassemi et al. 2022; Mo et al. 2022). Therefore, with a view to always having an MPP, the I − V curve variations need to be tracked to determine the new MPP, a process referred the Maximum Power Point Tracking (MPPT) (Al-Masri et al. 2016; Ahmed et al. 2022). This is achieved with various algorithms, among them is the MPPT algorithm with incremental conductance, known with its efficiency and accuracy compared to the Perturb and Observe algorithm (Sivakumar et al. 2015). The PV system voltage and current are the inputs of the algorithm, and the pulses provided through the algorithm are taken to control the duty cycle D of the DC-DC boost converter. This algorithm is unrelated to the characteristics of PV module, rather it depends on the terminal voltage of the module according to its value in relation to the maximum power point voltage (Ahmed et al. 2022; Mo et al. 2022). Equations (5) and (6) as well as Figure 5 illustrate the algorithm.
Where P, V and I are the power, voltage and current, respectively. dI/dV is the incremental conductance, and I/V is the panel conductance. At the MPPT, dI/dV or dP/dV have to be equal to zero (Ahmed et al. 2022; Sivakumar et al. 2015).
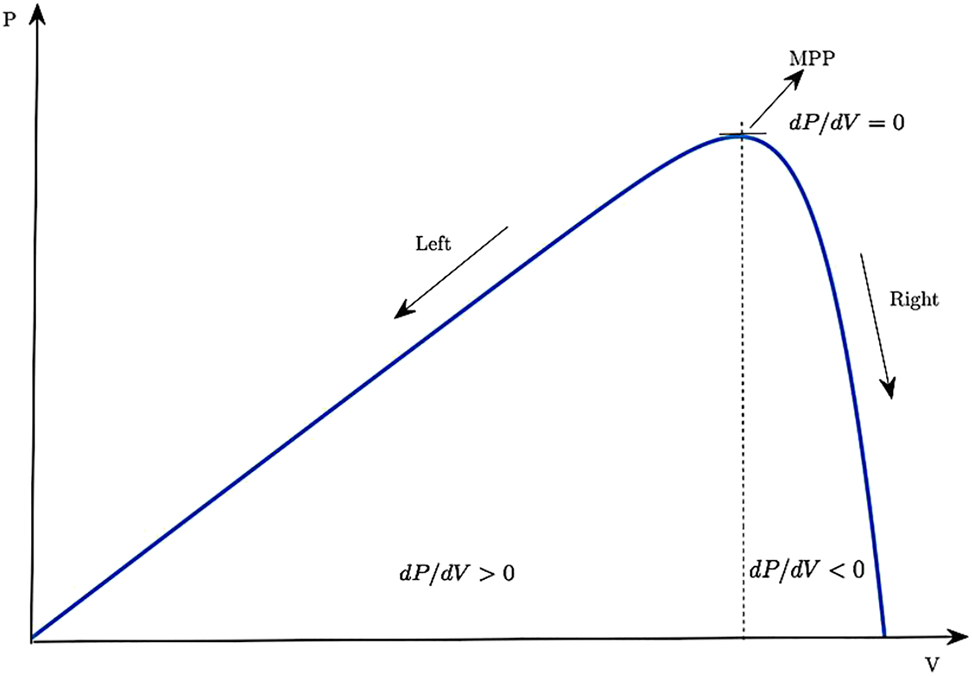
MPPT procedure.
Levelized Cost of Energy (LCoE)
The determination of the specific costs per unit of production of different power plants and electricity generation facilities is generally based on the Levelized Cost of Energy (LCoE). This method is commonly accepted and widely used because it allows the specific energy production costs of different technologies to be compared (Marzo et al. 2021; Wang et al. 2021). The calculation is based on the following general equation (Choukai et al. 2022):
Where I0 is the investment cost, At is the annual cost, Mt,el is the annual produced amount of electricity, i is the discount rate, n is the economic lifetime in years, and t is the index for each year (1, 2,…, n) (Choukai et al. 2022; Marzo et al. 2021; Wang et al. 2021). The annual expenses consist of fixed and variable costs (e.g., operations and maintenance, fuel costs, insurance). The discount rate is generally calculated from the weighted average cost of capital.
HOMER Pro is a reliable tool, which is used to carry out this work. This software can be used to determine the lowest LCoE for each scenario. Furthermore, it can calculate the Net Present Cost (NPC) over the lifetime and the CO2 emissions for each year.
Site description
For the purpose of this study, the University of Ibn Tofail located in the northwestern of Morocco at coordinates 34°14′45.7″N and 6°35′07.3″W was investigated (Ait Errouhi et al. 2022). The techno-economic analysis and environmental impact assessment using HOMER Pro were based on solar radiation, temperature and daily load demand of each building. The meteorological data used in this study were retrieved from the National Aeronautics and Space Administration (NASA) satellite database, which is included in the HOMER Pro Software by indicating the latitude and longitude of the selected sites. Figure 6 shows the University campus and the PV carport of the presidency, which contains electric vehicle charging stations.
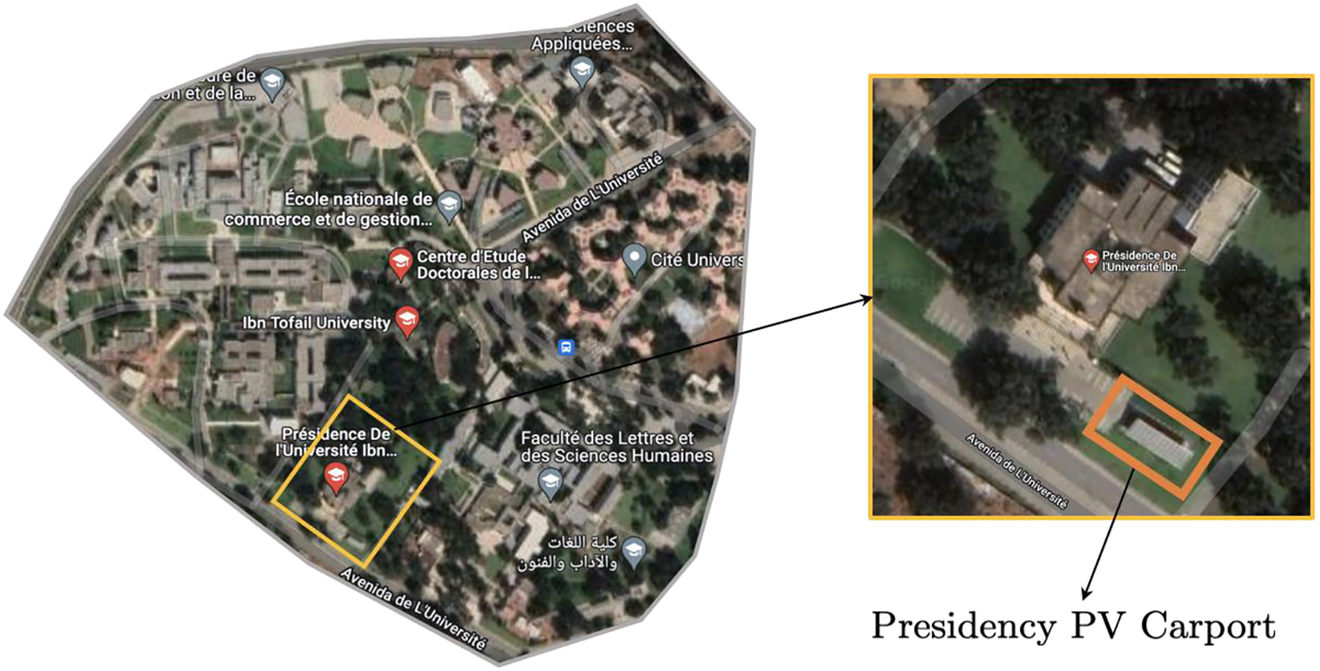
University campus and the presidency PV carport.
Meteorological resources
Temperature data for the location of the Ibn Tofail University is collected using HOMER Pro. It might look unreasonable; however, the performance of PV modules is affected in the opposite way by increases in temperature. PV panels are tested at Standard Test Conditions (STC) of a temperature of 25 °C and depending on the area brought in, heat can reduce yield effectiveness by 10–25%. As the temperature of the PV panel increases, the yield current increases exponentially while the voltage yield decreases directly. In fact, the voltage decrease is not surprising that it is used regularly to accurately quantify the temperature. Hence, warmth may seriously reduce the power generation of the PV panel. Consequently, the temperature is a very important parameter for the choice of location and photovoltaic module.
Besides the ambient temperature (Figure 7), solar radiation is a crucial factor in the energy production by the PV modules and has likewise been taken into account in the HOMER Pro software. Figure 8 shows the monthly average solar Global Horizontal Irradiance (GHI) data of the University location. The scaled annual average solar irradiation is 5.31 kWh/m2/day.
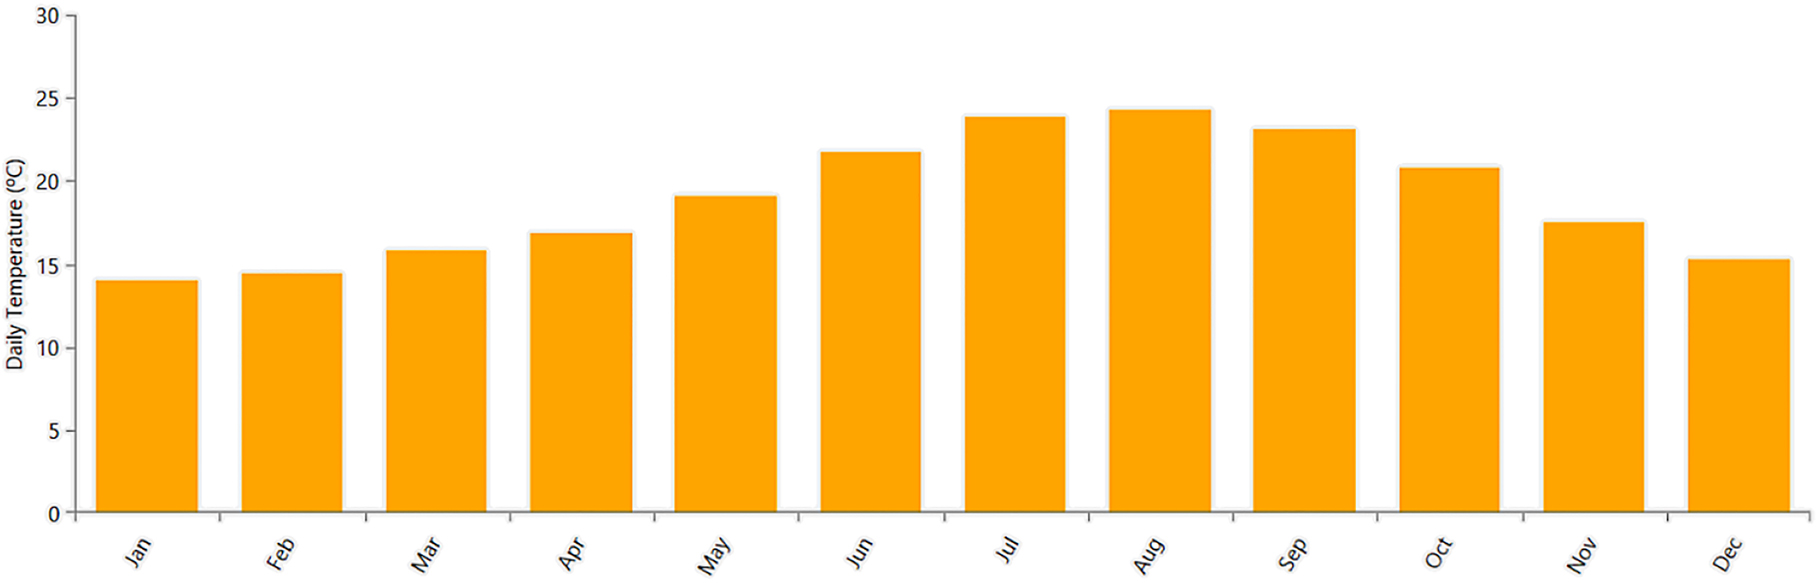
Monthly average air temperature over 30 years.
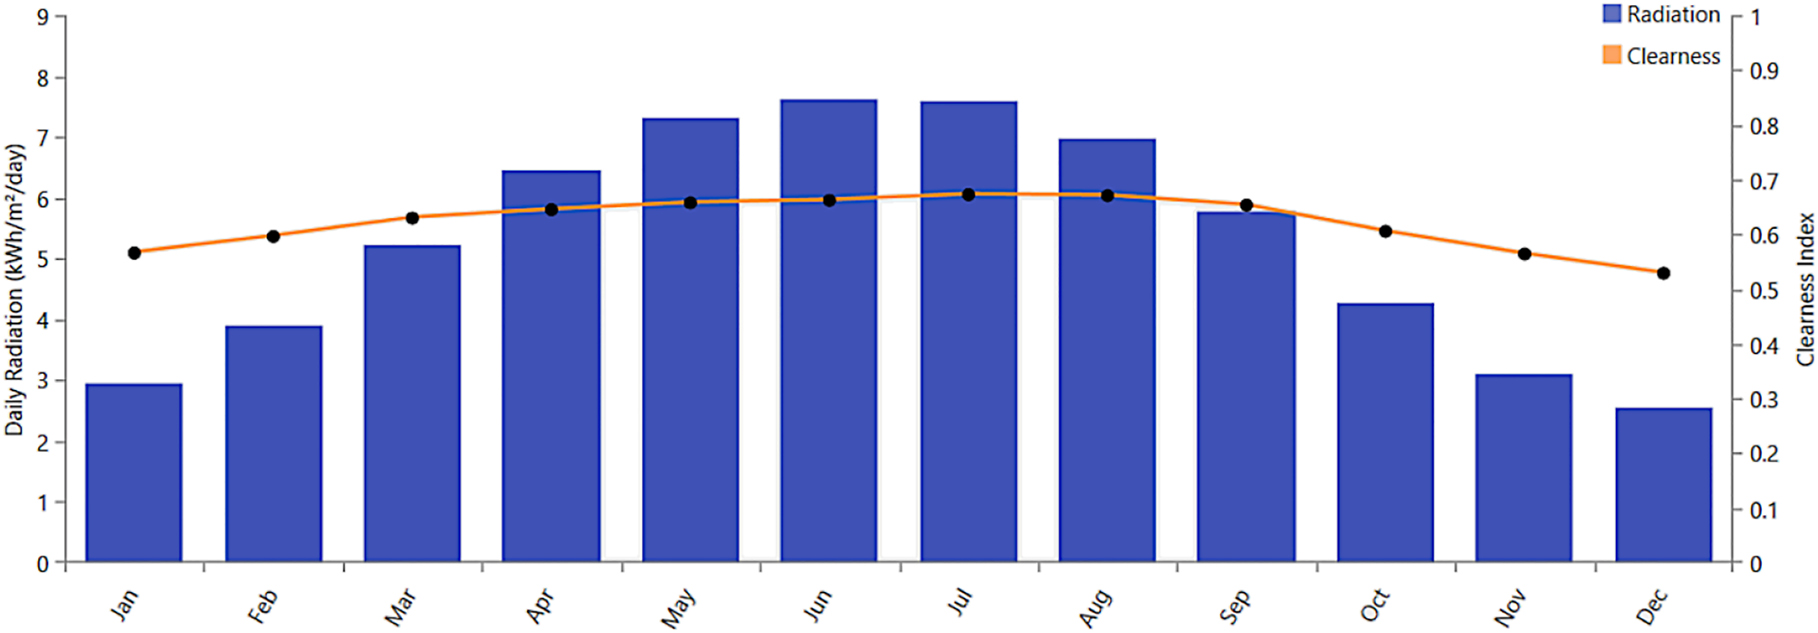
Monthly average solar GHI data over 22 years.
Load analysis
In this study can the load of the different buildings within the University as residential load considered. The load profiles were computed based on realistic measured electricity consumption at each building containing a PV system. The measurements were taken from a typical working day considered as annual average consumption input for the utilized optimization software. Figure 9 illustrate the daily, monthly and yearly load profiles of the University Presidency building. In particular, the energy consumption is very high between 10 am and 6 pm. The scaled annual average demand of energy is approximately 387 kWh/day.
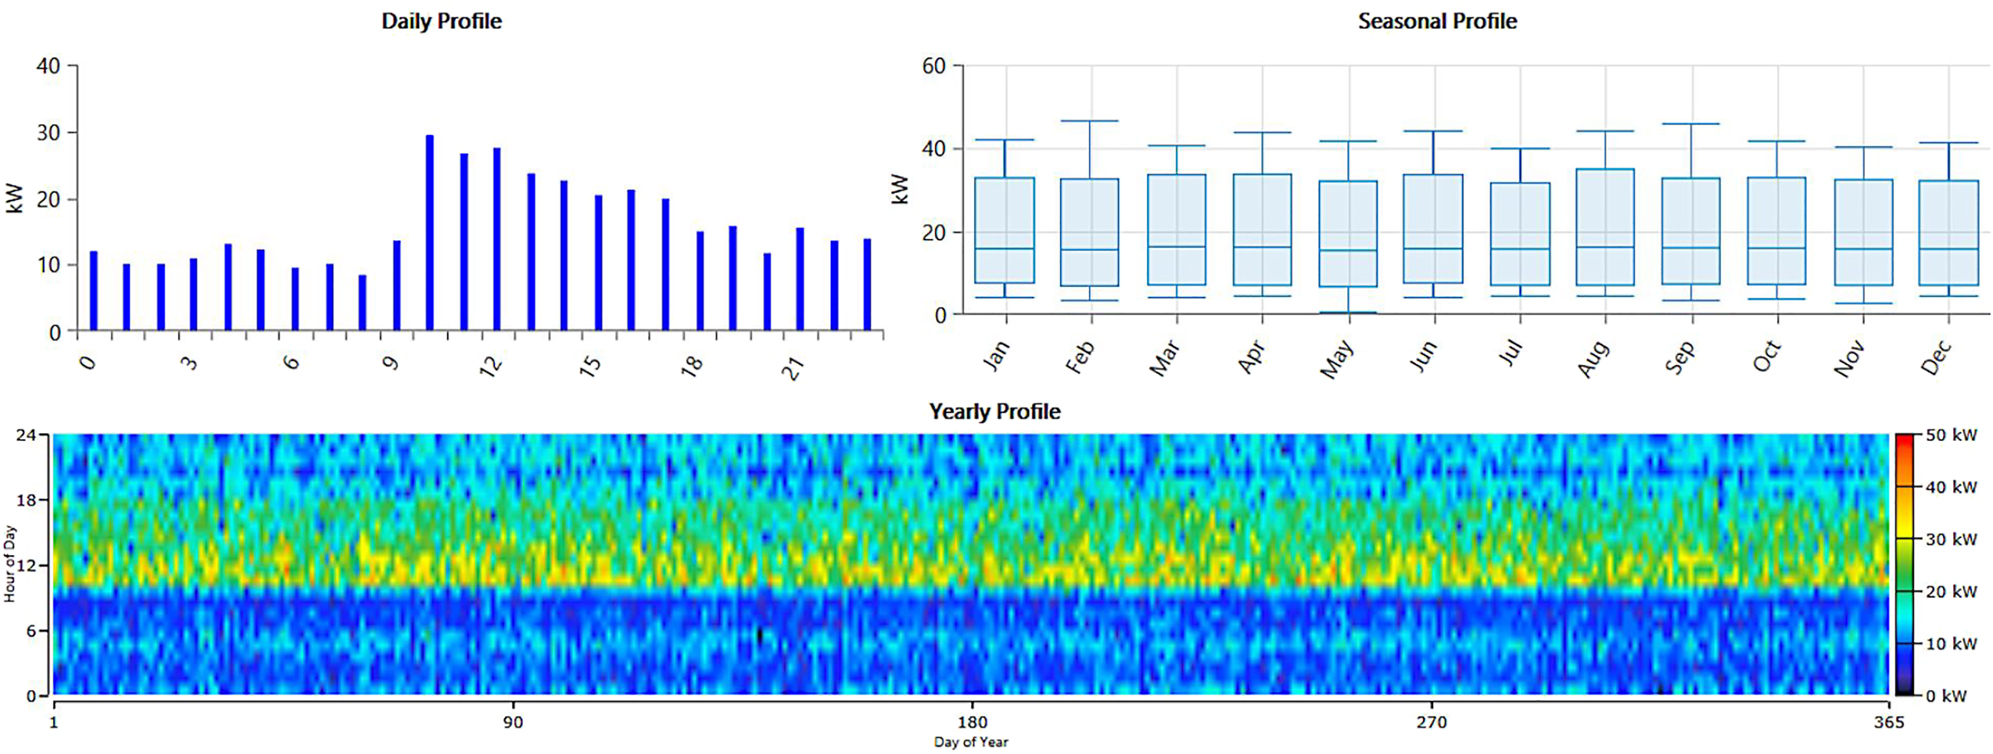
Electricity consumption of the University Presidency Building.
Figure 10 presents as well the daily, monthly and annual load profiles of the Faculty of Science (Figure 10a), the Faculty of Arts (Figure 10b) and the Center for further education (Figure 10c), where the scaled annual average energy demand for each of them is about 2228.70 kWh/day, 1259.60 kWh/day, and 380 kWh/day, respectively.
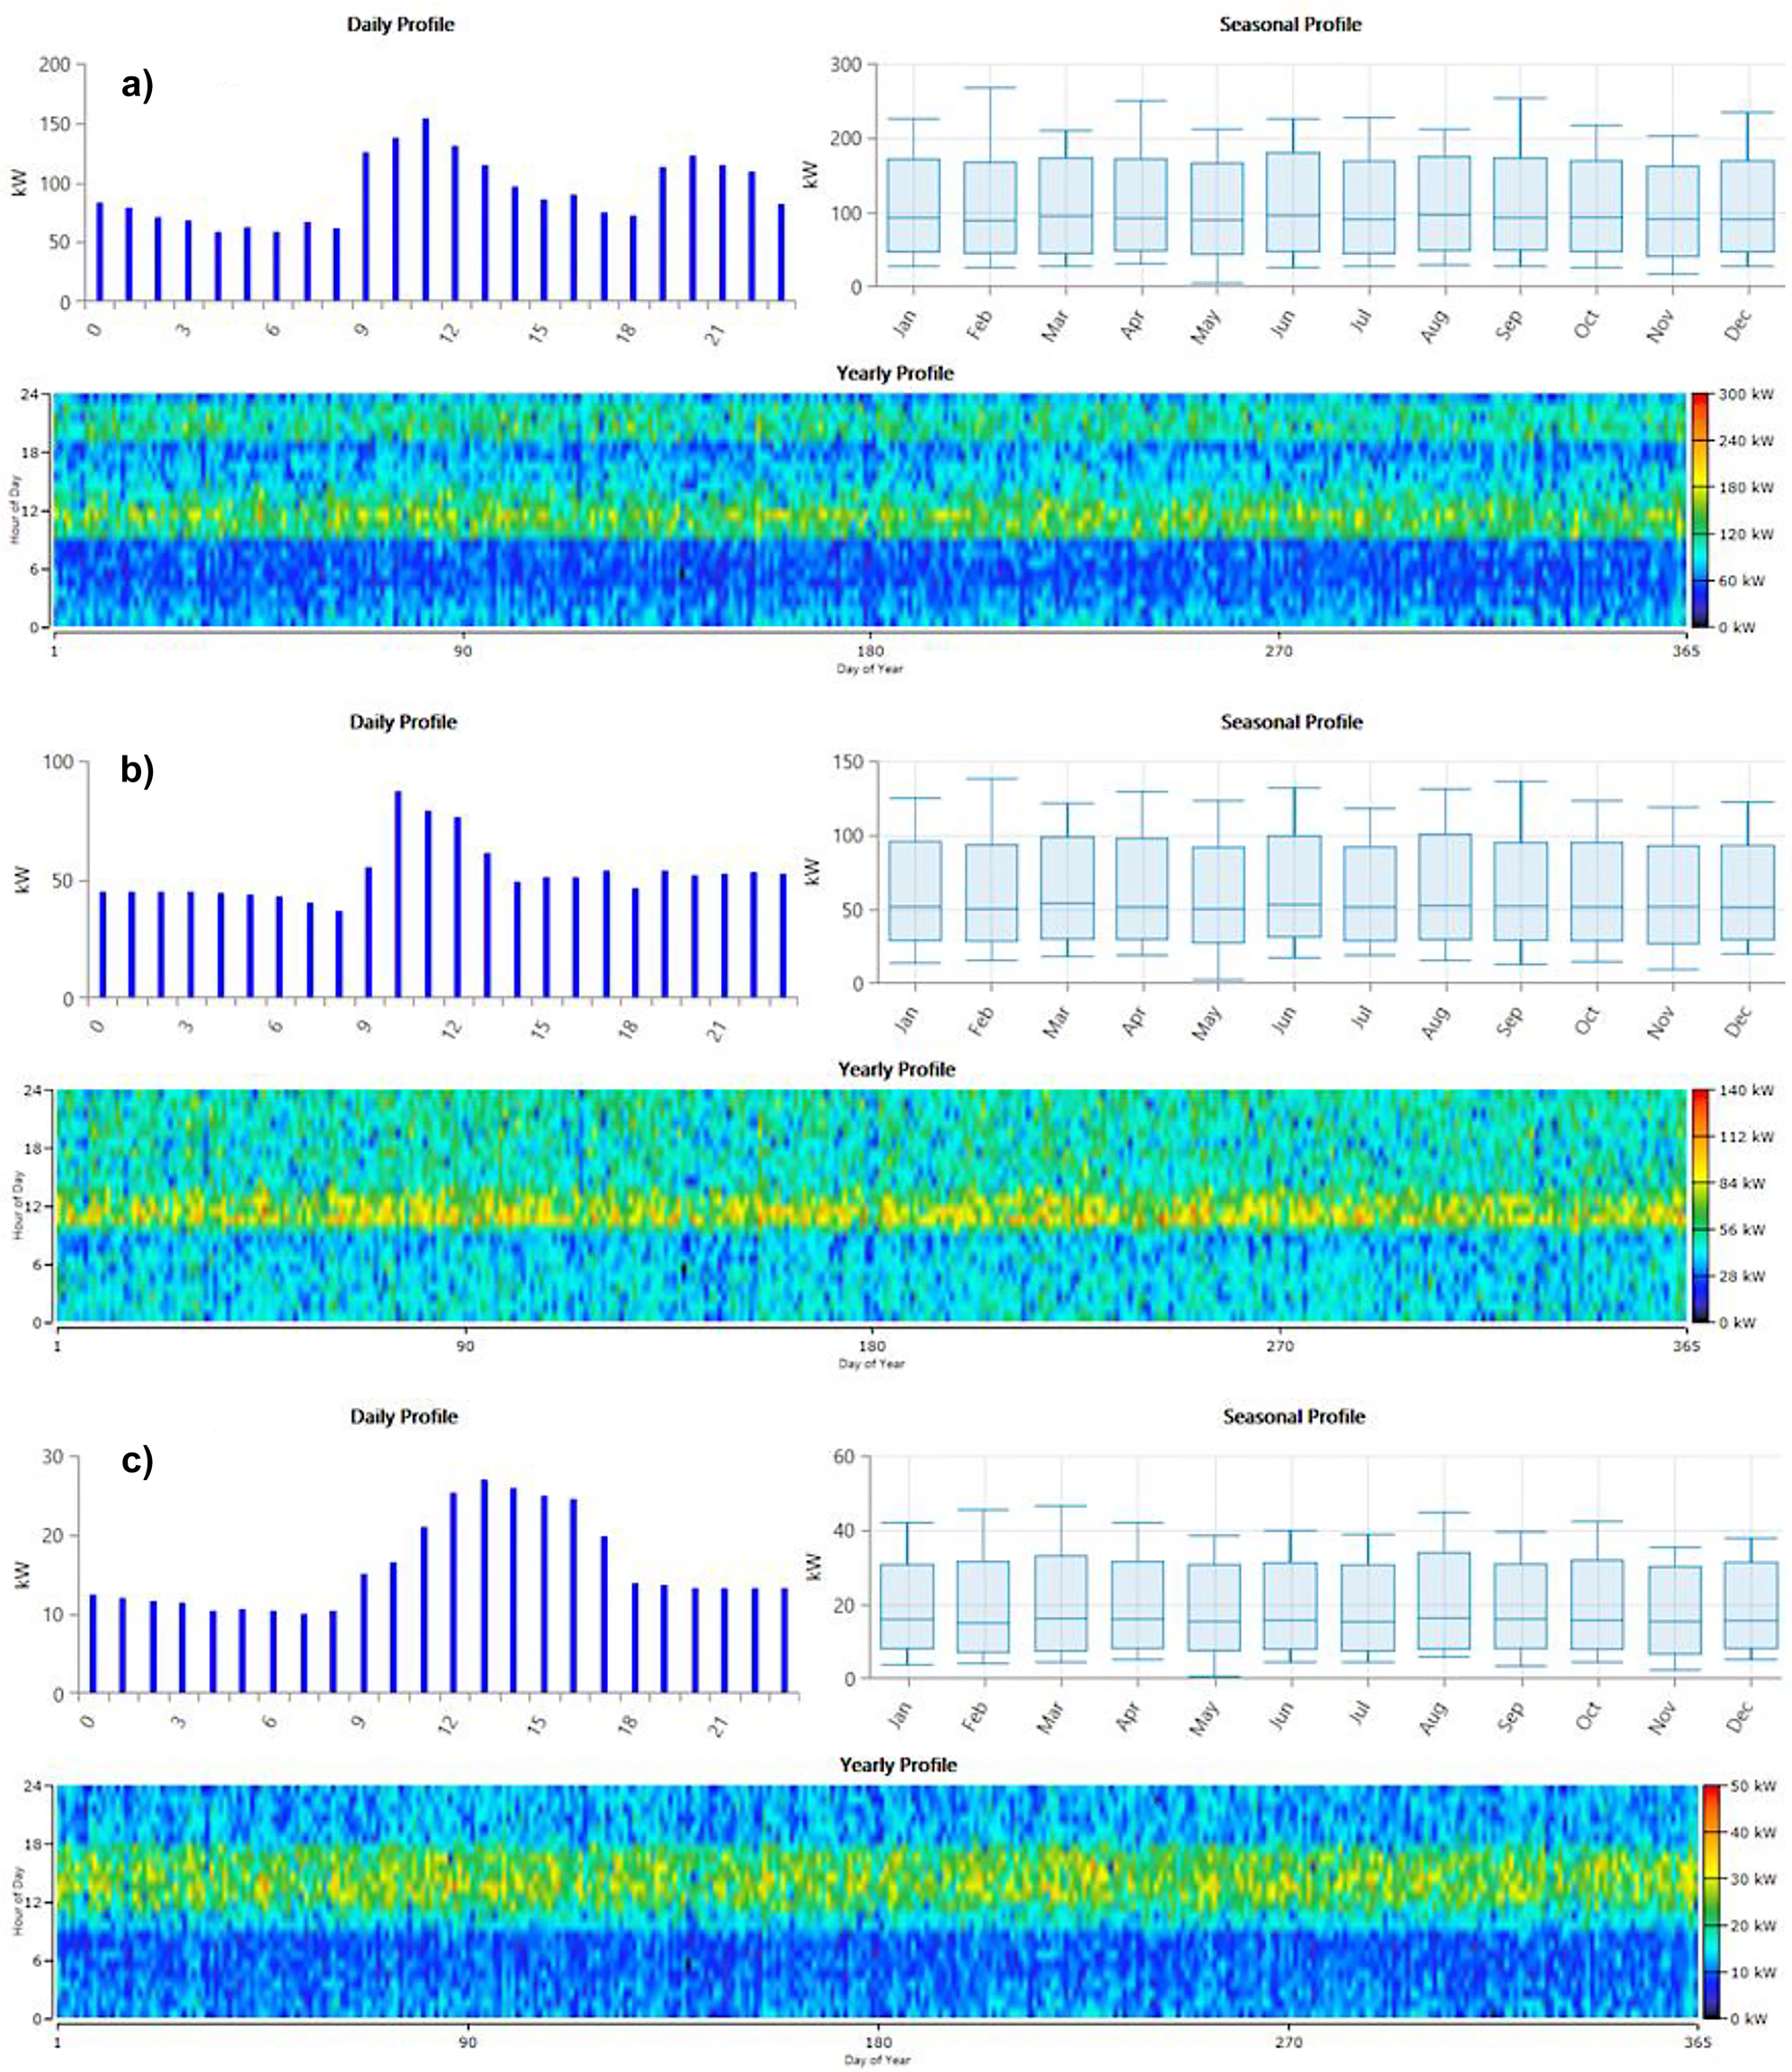
Electricity consumption of the University Buildings connected to PV installations.
Scenarios and simulation
For the simulation with HOMER Pro, some input values are absolutely mandatory, such as the prices of the main components of a PV system, e.g. solar panels and converters. The price of electricity from the local grid and the price of selling back the energy unit are as well relevant. The price of purchasing electricity from the local grid in the city of Kenitra is 1.645 MAD/kWh, while the price for selling it back is estimated at 0.5 MAD/kWh. In addition, the discount rate and inflation rate are required for this study, a discount rate of 7% and an inflation rate of 1.5% have been taken into account. The investment period is set to 25 years by default in the simulation software, which corresponds the lifetime of most solar panels. Figure 11 demonstrates the schematic of the simulation for the University presidency, which is valid for the remaining facilities with adaptation of the input values for the photovoltaic panels and the converters used in each of them.
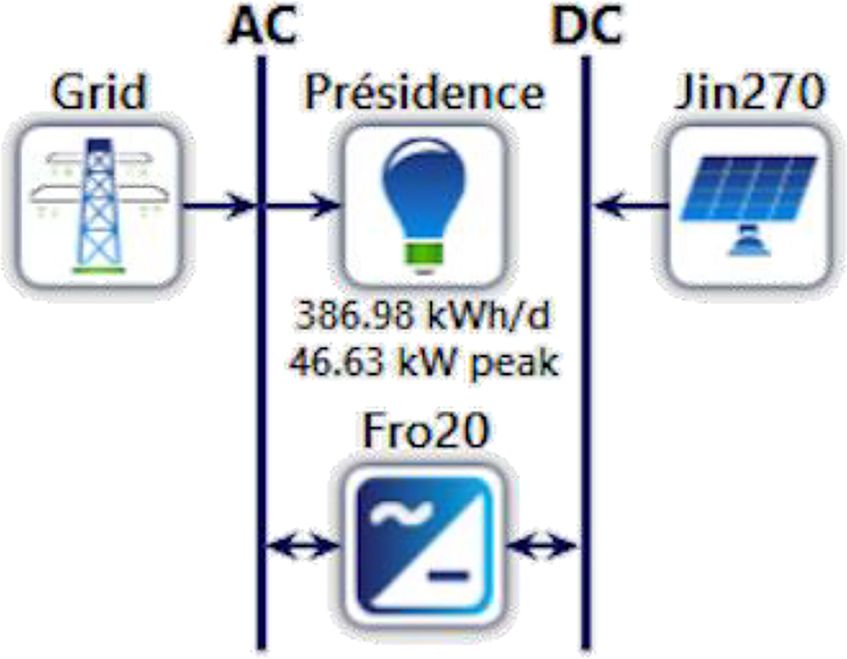
Simulation schematic for the University presidency.
Three scenarios were taken into account for this study. The first scenario reflects the present PV installation of each facility, which actually are in place. The second scenario involves the HOMER Optimizer to assess how the University Ibn Tofail of Kenitra can optimize and expand their PV installations, but with the constraint that a maximum of 20% only of the excess generated energy can be sold to the local electricity provider according to the law 13-09. The third scenario similarly employs the HOMER Optimizer, but this time instead of the previous law’s constraint, the new renewable energy law in Morocco 82-21 was considered, where the University and generally private households besides public service buildings are allowed to sell the whole surplus of the produced energy.
Results and discussion
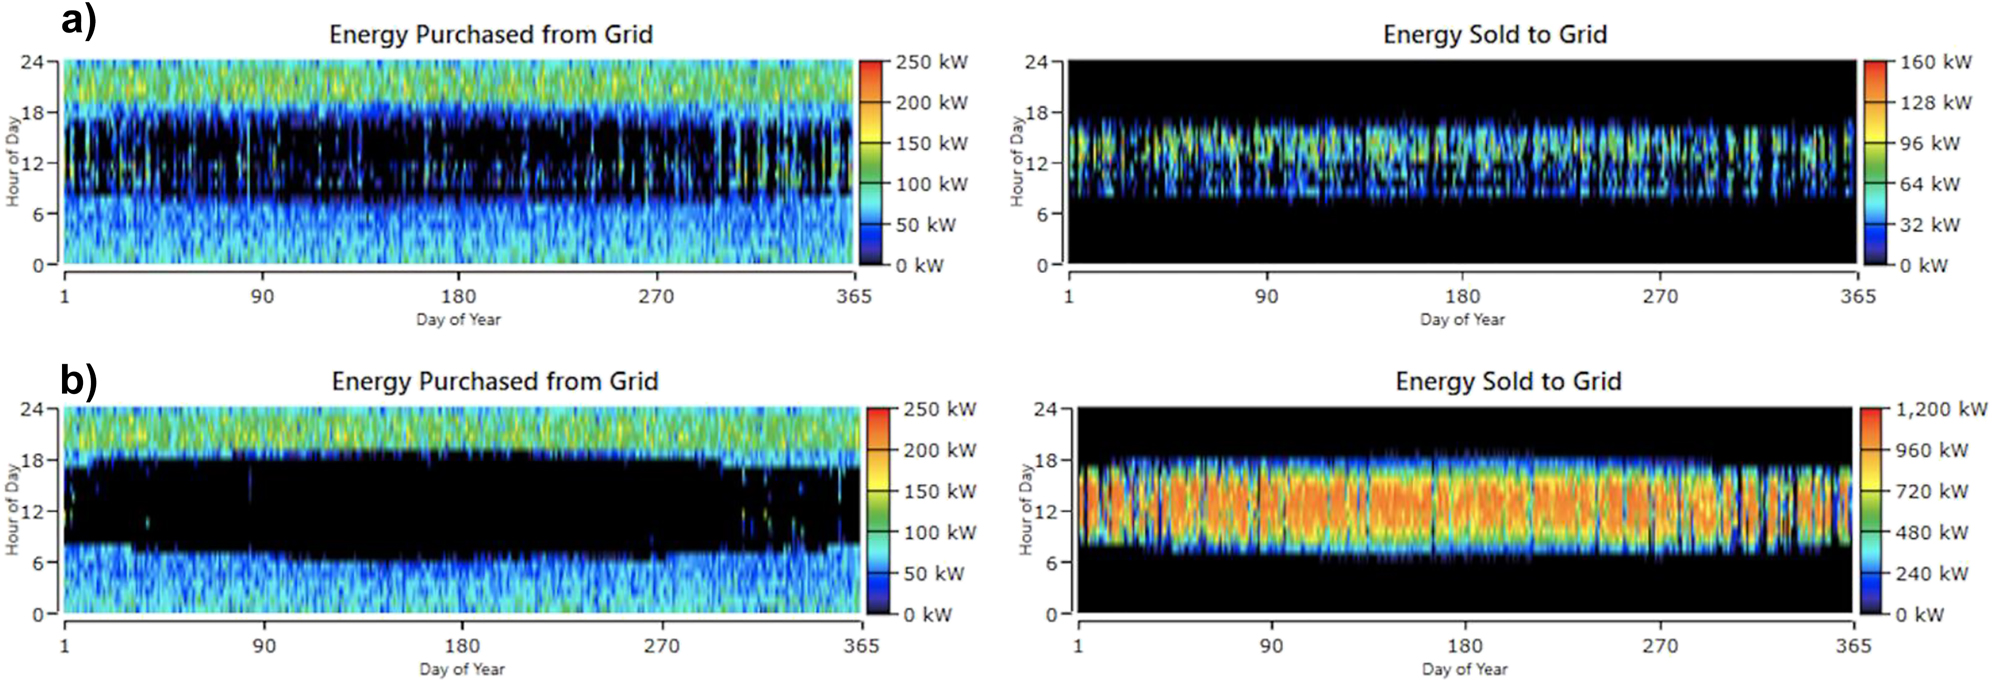
HOMER Pro stimulates and performs for each scenario or grid configuration an energy balance computation based on the available meteorological data of the localization specified, for hourly intervals of the year. Besides the energy demand of the facilities purchased from the local utility grid, HOMER Pro calculates the produced energy of the PV installations into consideration and can therefore determine if this configuration is plausible. After having simulated the feasible configuration, HOMER Pro can further estimate the Net Present Cost (NPC), the Operating and Maintenance Cost then the Levelized Cost of Energy (LCoE) over the lifetime of the project. As a result, the software provides additionally the cashflow and the electrical summary. Figure 12a shows the energy purchased monthly from the utility grid and the produced energy from the University presidency PV carport for the scenario 1.
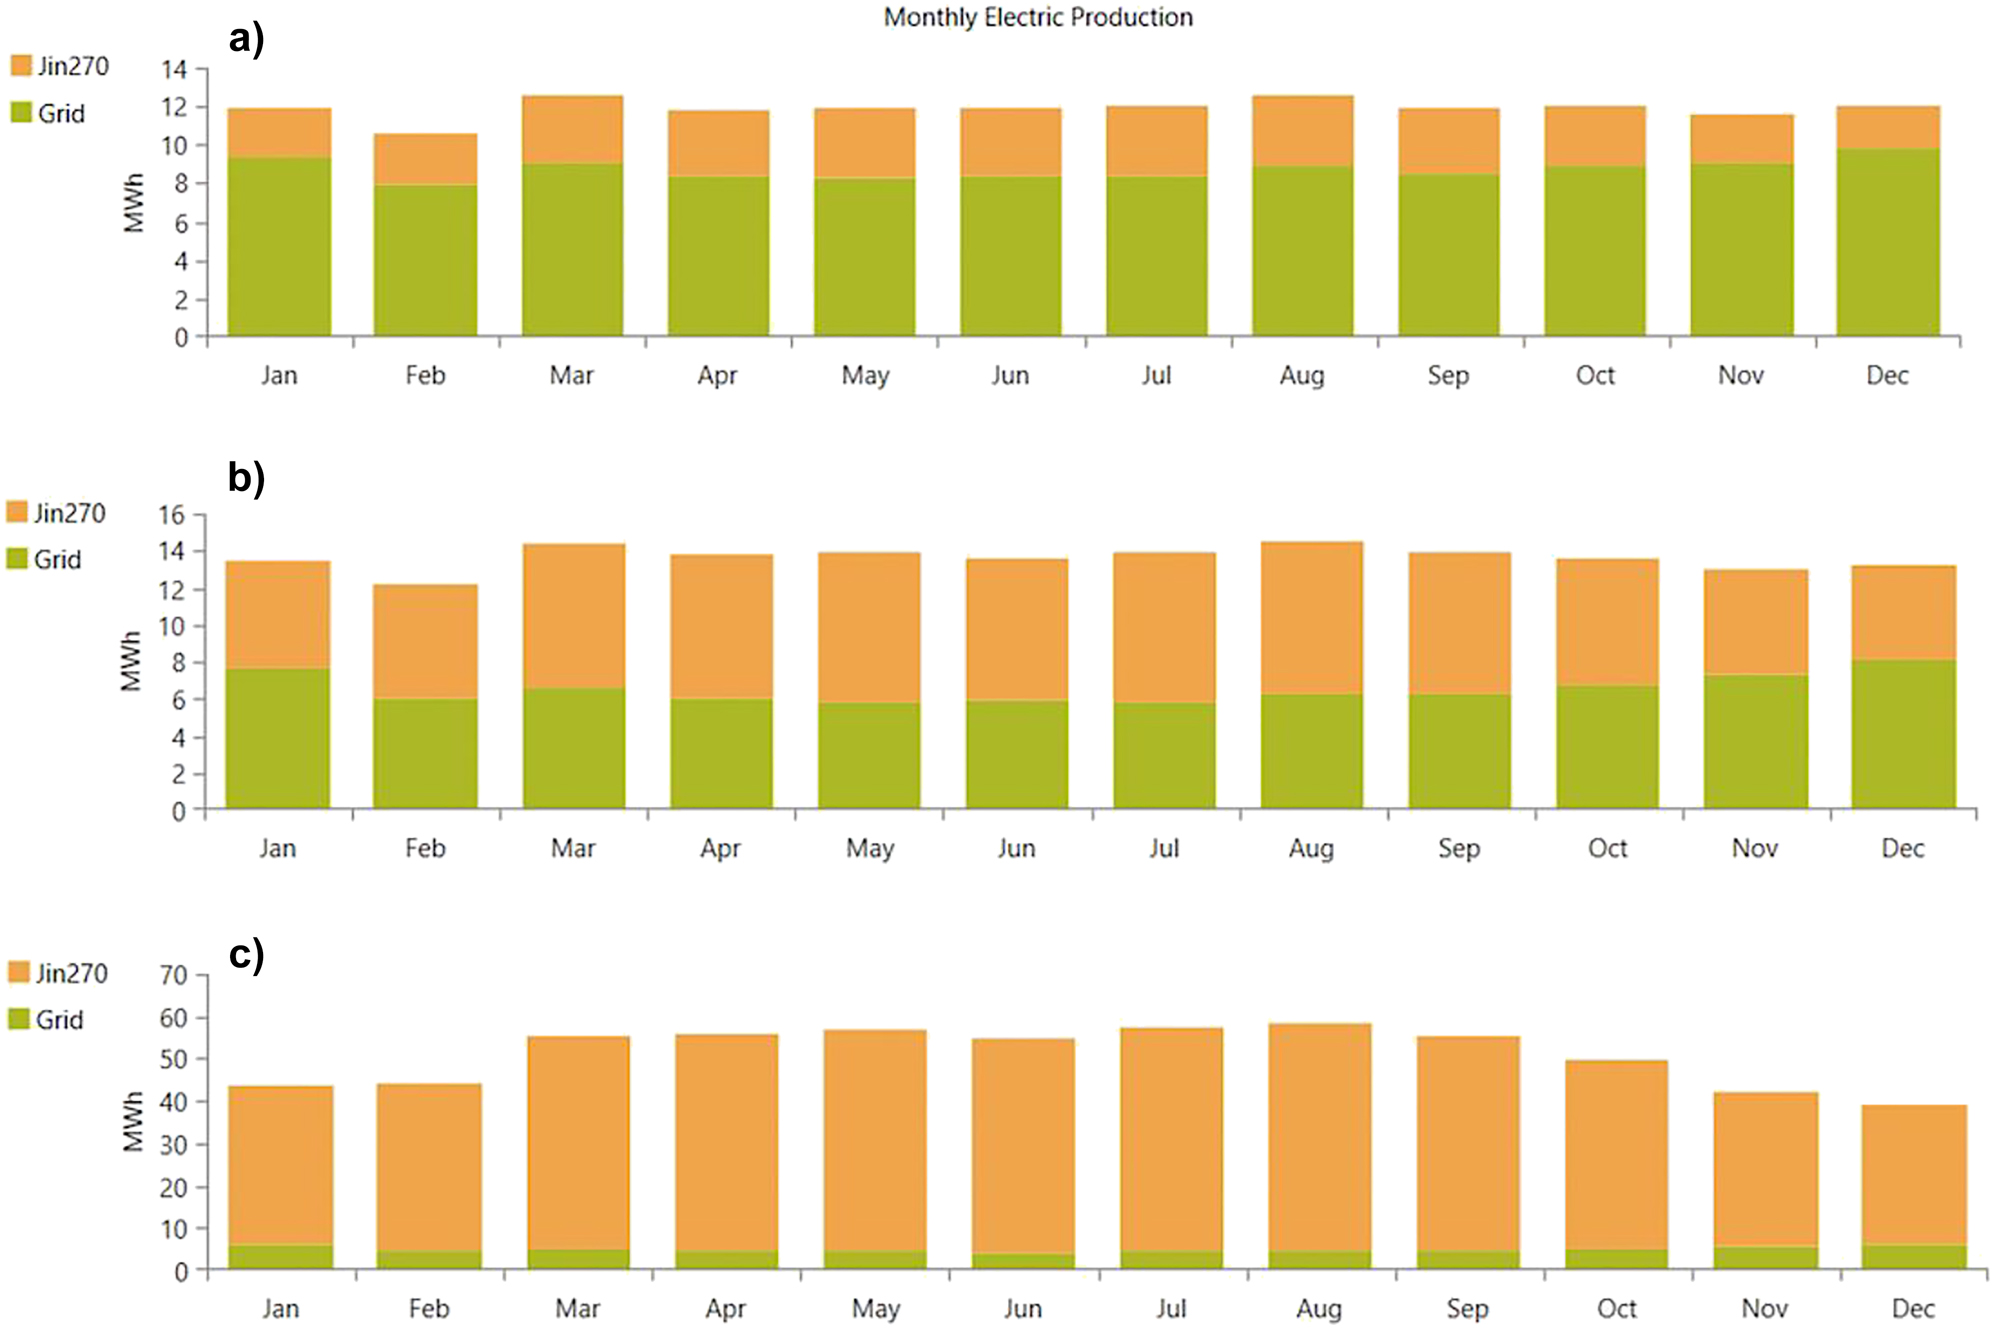
PV production of the presidency carport a) scenario 1 b) scenario 2 c) scenario 3.
The purchased energy represents around 73.5% from the yearly energy demand of the presidency. By applying the HOMER Optimizer for scenario 2 and 3, the proportion of purchased energy was enhanced to 48.1% and 9.8%, respectively. However, this means the PV capacity at University presidency have to be extended to 47 kWp for scenario 2 and to 306 kWp for scenario 3. The LCoE was improved from 1,32 MAD/kWh to 0.967 MAD/kWh in scenario 2 and 0.1653 MAD/kWh in scenario 3. The optimization of the PV production of the presidency PV system is shown in Figures 12b and c. Since there is no more need of parking at the presidency building and the land is insufficient for such construction, the PV system can be extended in the form of rooftop installation. The amount of energy purchased from the local utility grid and sold to it for both scenarios 2 and 3 is illustrated in Figures 13a and b, respectively. In scenario 3, the energy sold is significantly higher than in scenario 2. In scenario 1 the sell back of energy was still not possible. With the new law on renewable energy in Morocco, taken into account in scenario 3, can the University presidency and generally the facilities with PV installations sell back all the energy excess produced instead of only 20% of the surplus in the previous law 13-09. Hence, HOMER Pro estimated a return on invest (ROI) of 9.6% in scenario 3, while for scenarios 1 and 2 the ROI remains impossible.
Table 3 gives a detailed summary of the obtained results for the university facilities considered in this work.
Optimization results of the PV systems in the University Ibn Tofail.
| University Presidency | Faculty of Science | Center for further education | Faculty of Arts | |||||||||
|---|---|---|---|---|---|---|---|---|---|---|---|---|
| Scenario 1 | Scenario 2 | Scenario 3 | Scenario 1 | Scenario 2 | Scenario 3 | Scenario 1 | Scenario 2 | Scenario 3 | Scenario 1 | Scenario 2 | Scenario 3 | |
| PV capacity [kWp] | 21 | 47 | 306 | 60 | 255 | 1857 | 35 | 45 | 254 | 49 | 140 | 952 |
| Converter nominal output [kW] | 20 | 37.2 | 210 | 60 | 188 | 1200 | 30 | 35 | 197 | 40 | 104 | 621 |
| Total NPC over lifetime [MAD] | 2,533,087 | 2,067,586 | 1,253,234 | 16,459,770 | 12,396,730 | 7,862,493 | 2,323,726 | 2,172,025 | 1,921,768 | 8,893,876 | 7,145,158 | 4,946,012 |
| LCOE [MAD/kWh] | 1.32 | 0.967 | 0.1653 | 1.5 | 1.02 | 0.1741 | 1.19 | 1.05 | 0.2954 | 1.43 | 1.04 | 0.2104 |
| Operating cost [MAD/year] | 175266,8 | 126820,3 | −73422,85 | 1,183,316 | 780,542 | −390940,8 | 145839,8 | 127452,4 | −45169,86 | 629,988 | 450387,5 | −154434,3 |
| Initial capital [MAD] | 163306,5 | 352,850 | 2245983,94 | 460,170 | 1843031,25 | 13,148,400 | 351,828 | 448742,5 | 2532509,33 | 375,814 | 1055472,5 | 7034116,88 |
| Return on investment [%] | – | – | 9.6 | – | – | 9.2 | – | – | 6.8 | – | – | 9 |
| AC Load [kWh/year] | 141,248 | 813,476 | 138,729 | 459,754 | ||||||||
| PV production [kWh/year] | 37,849 | 84,709 | 552,186 | 101,813 | 432,704 | 3,151,955 | 59,700 | 76,757 | 433,250 | 82,621 | 236,061 | 1,604,480 |
| PV production [%] | 26.5 | 51.9 | 90.2 | 12.5 | 47.4 | 88.9 | 40.9 | 49.3 | 88 | 17.9 | 46 | 87.7 |
| Grid purchases [kWh/year] | 104,802 | 78,550 | 59,882 | 714,232 | 480,678 | 392,592 | 86,177 | 78,907 | 59,047 | 379,053 | 277,183 | 223,988 |
| Grid purchases [%] | 73.5 | 48.1 | 9.78 | 87.5 | 52.6 | 11.1 | 59.1 | 50.7 | 12 | 82.1 | 54 | 12.3 |
| Unused excess electricity [kWh/year] | 457.1 | 941 | 24,861 | 0 | 4506 | 129,398 | 5953.6 | 426 | 2486 | 271 | 2128 | 58,727 |
| Grid sales [kWh/year] | 0 | 16,882 | 419,593 | 23.7 | 84,695 | 2,526,110 | 0 | 14,982 | 342,467 | 0 | 46,683 | 1,279,071 |
| CO2 emissions [kg/year] | 66,235 | 49,644 | 37,846 | 451,394 | 303,788 | 248,118 | 54,464 | 49,869 | 37,317 | 239,561 | 175,179 | 141,560 |
HOMER Pro can likewise predict the CO2 balance, in the case of the university presidency building moving from scenario 1 to 2 would reduce the balance of CO2 by 16,591 kg/year, while the transition from scenario 1 to 3 would avoid even 28,389 kg/year of CO2 emissions.
To achieve this environmental objective, the University have to increase the initial capital, this means expand the existing PV system with rooftop installation which is less expensive compared to carport installation. Figure 14 shows the cashflow of all scenarios. Despite the increase in the capital investment, the switch to scenario 2 and 3 shows an improvement in the expenses for operating and replacement of devices like the converter at the 15th year of the project lifetime. In scenario 3, it is observable that the excess energy sold to the local electricity grid can cover most of the expenses during the lifespan of the project.
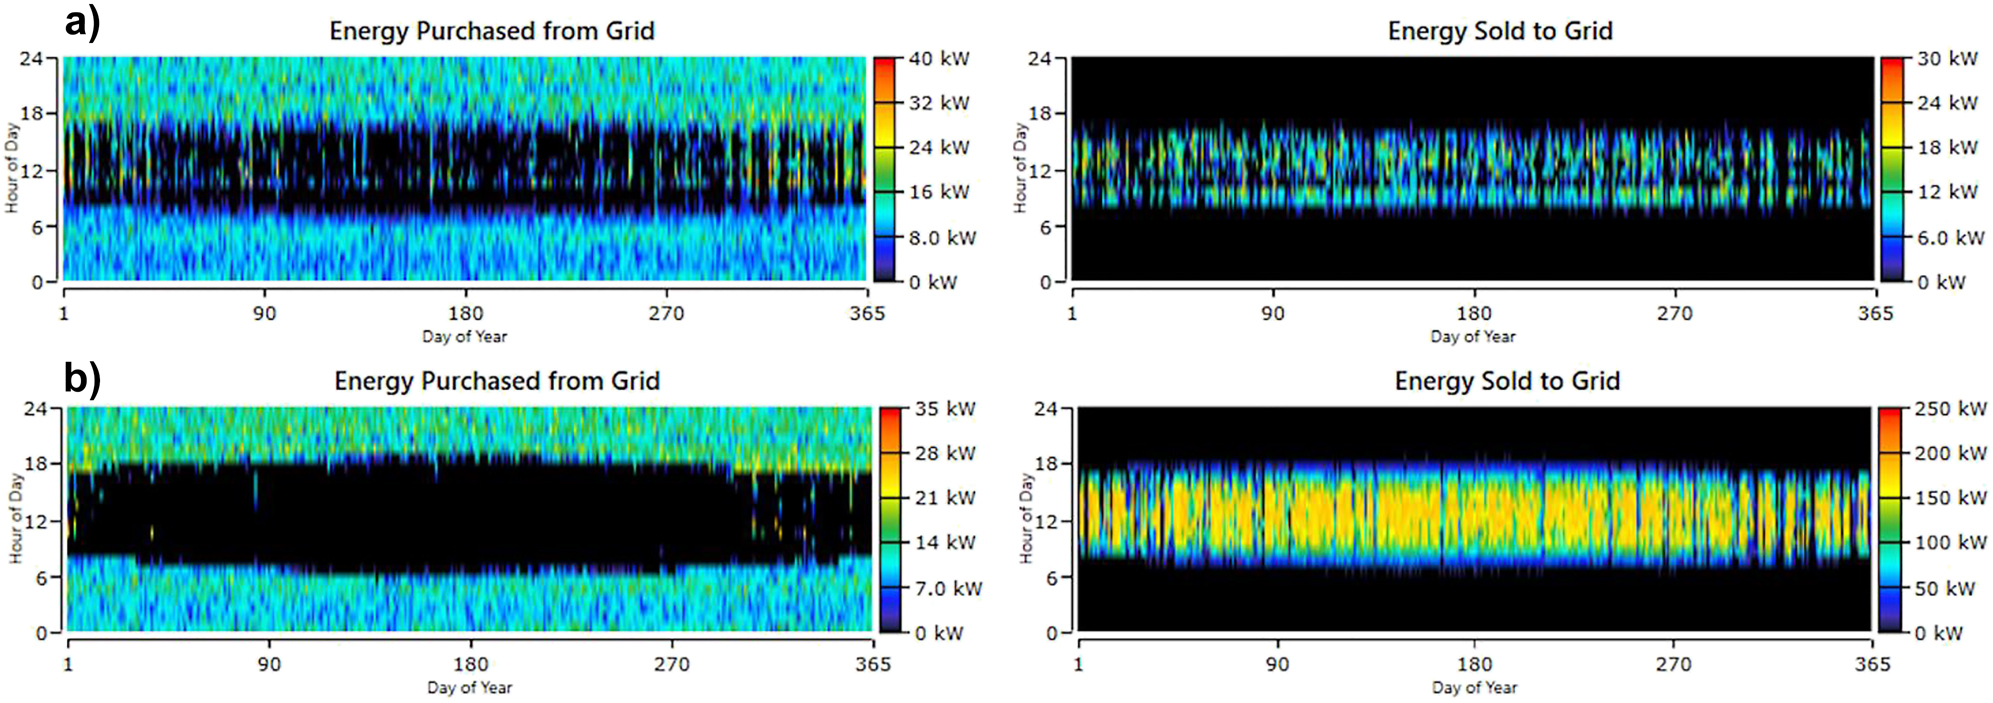
Purchased and sold energy a) scenario 2 b) scenario 3.
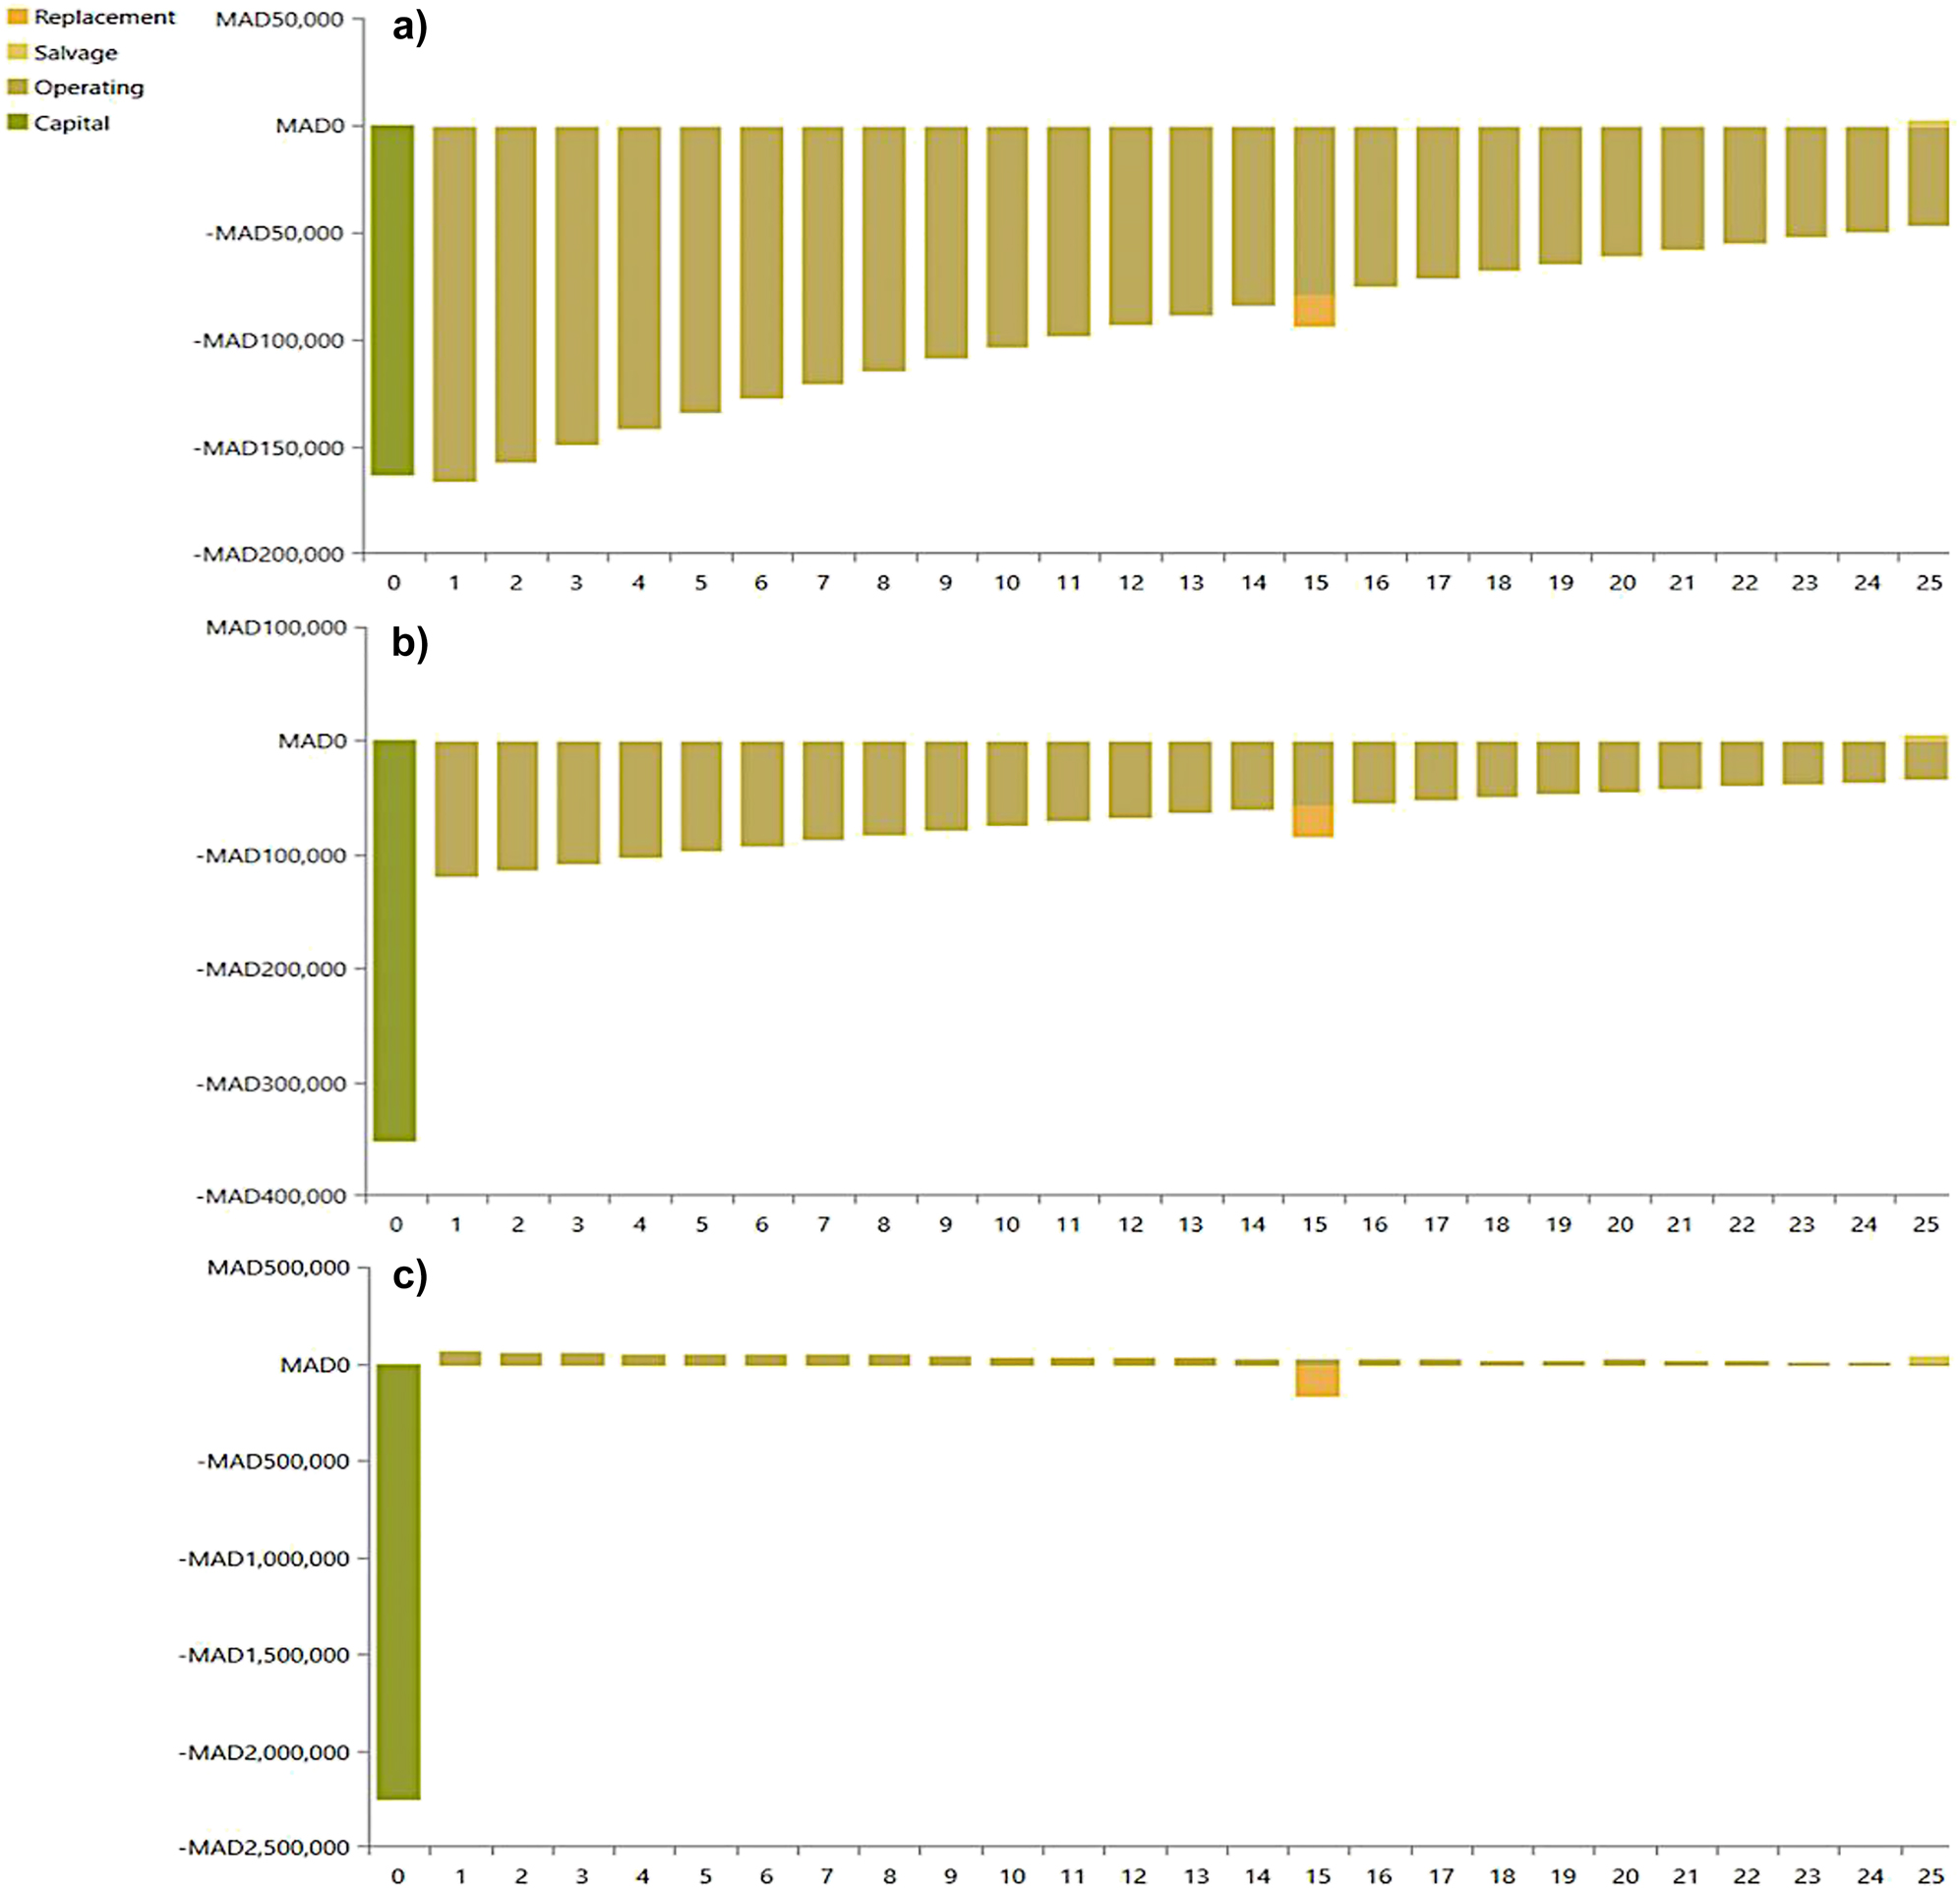
Presidency building discounted cashflow of a) scenario 1 b) scenario 2 c) scenario 3.
Likewise, can the PV system at the faculty of science extended to meet the environmental objective and to reduce the consumption of energy based on the local utility grid. The optimization with HOMER Pro leads to an LCoE of 1,02 MAD/kWh in scenario 2 and 0.1741 MAD/kWh in scenario 3 instead of 1,5 MAD/kWh for the existing configuration. The avoided CO2 emissions moving from scenario 1 to 3 is predicted by 203,276 kg/year. However, the PV capacity of this installation have to be expanded from 60 to 1857 kWp, which can be investigated in a further study whether it is feasible as rooftop installation on the available facility roof surface or not. Figure 15 shows the optimized extension of the PV system of the Faculty of Science from currently 12.5% in scenario 1 to 47.4% and 88.9% in scenario 2 and 3, respectively.
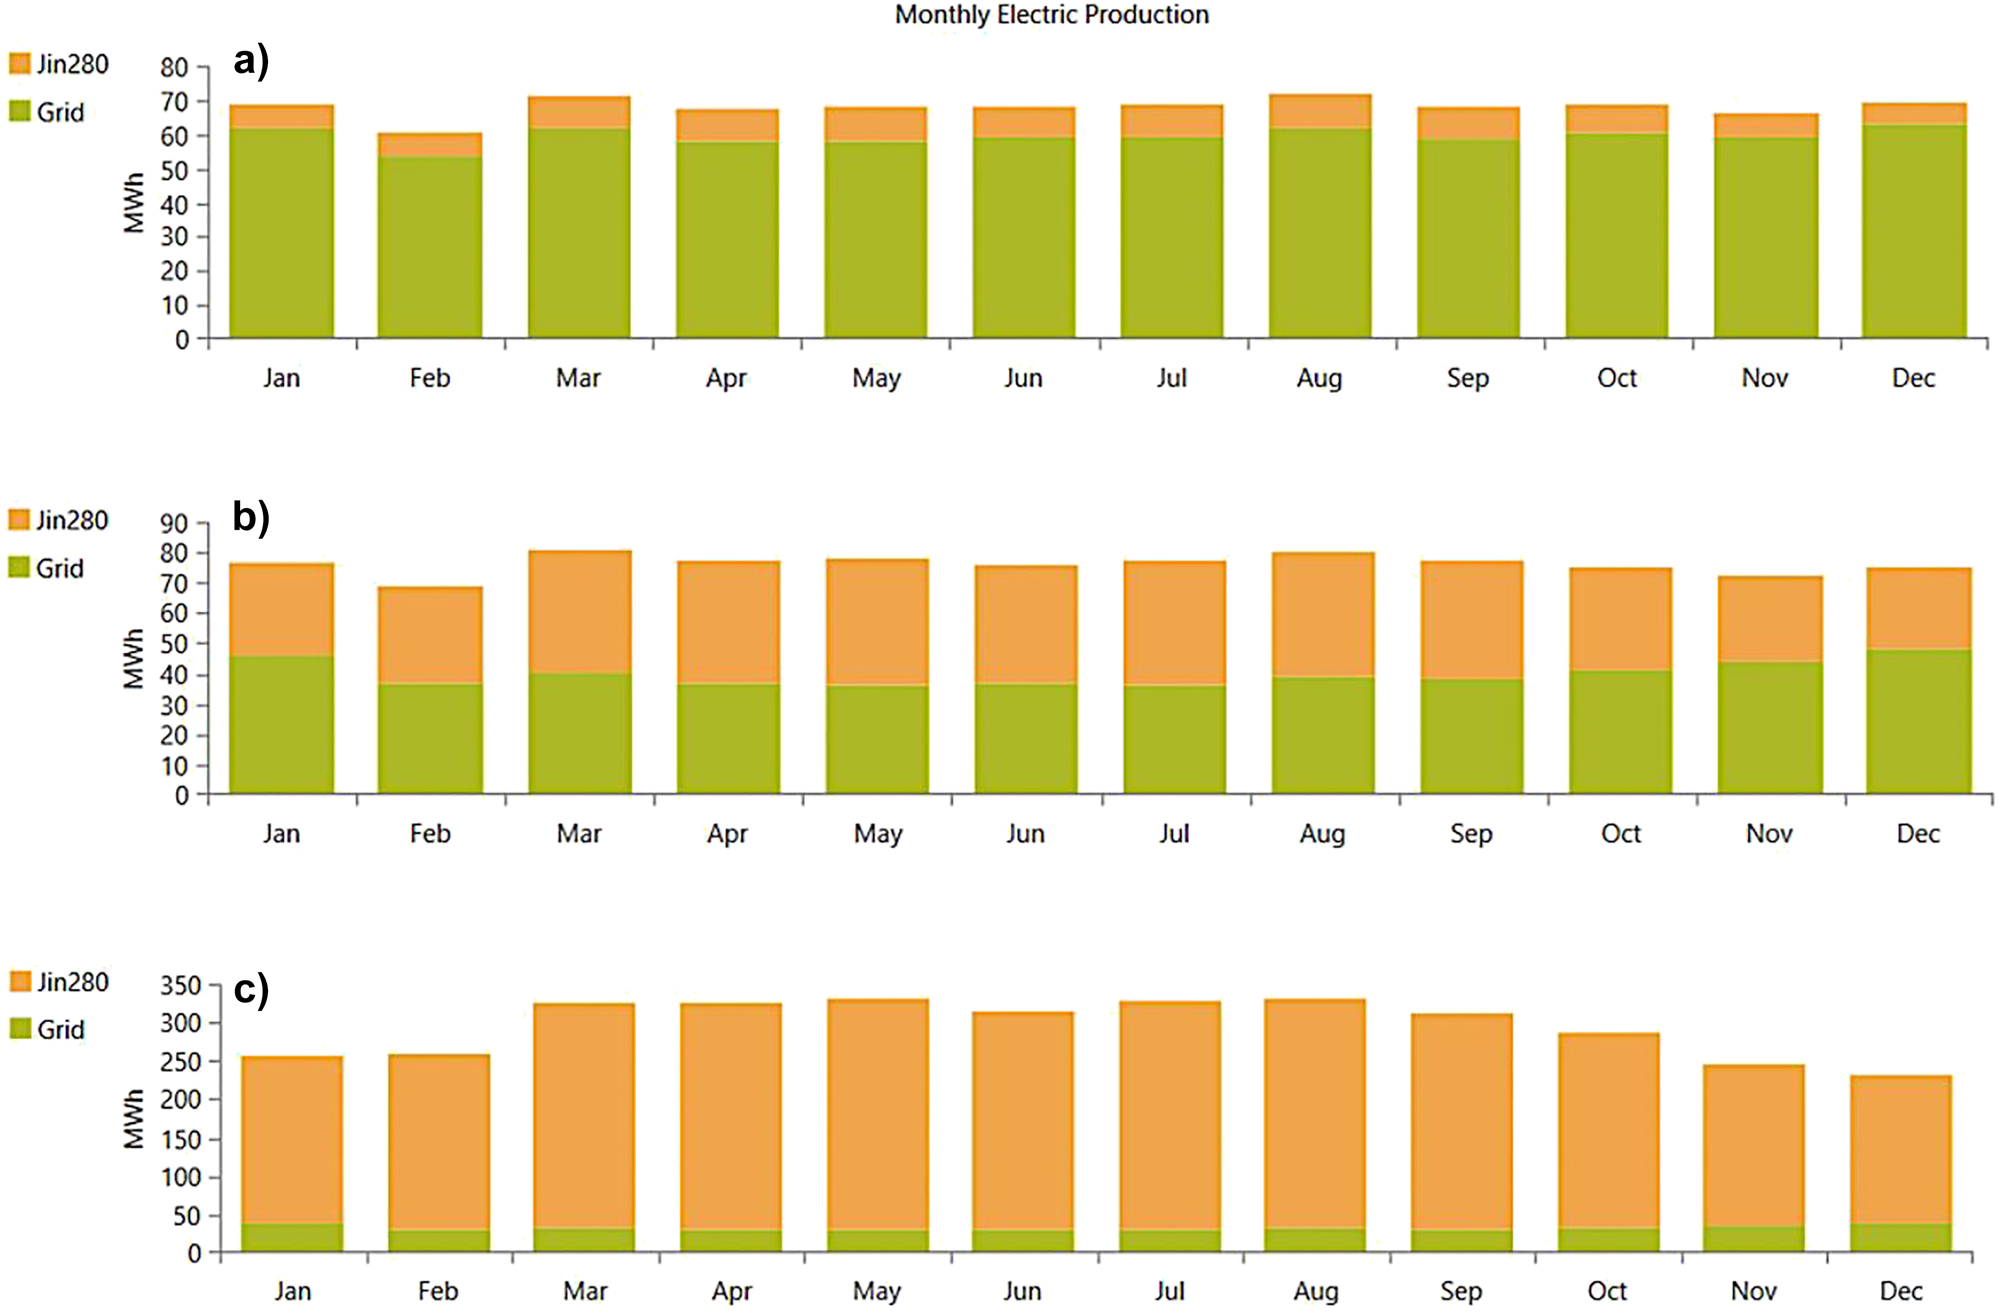
PV production in Faculty of Science a) scenario 1 b) scenario 2 c) scenario 3.
Corresponding to this optimization proposals obtained by HOMER Pro respecting the set constraints, the cashflow for the Faculty of Science was improved despite the high initial capital of investment as shown in Figure 16. Nevertheless, during the lifetime of the project there is no further investment for operating and maintenance in scenario 3, which is covered by the income from selling back the excess energy to the local electricity grid. Figure 17 shows the amount of purchased and sold energy to the grid for scenario 2 (a) and scenario 3 (b).
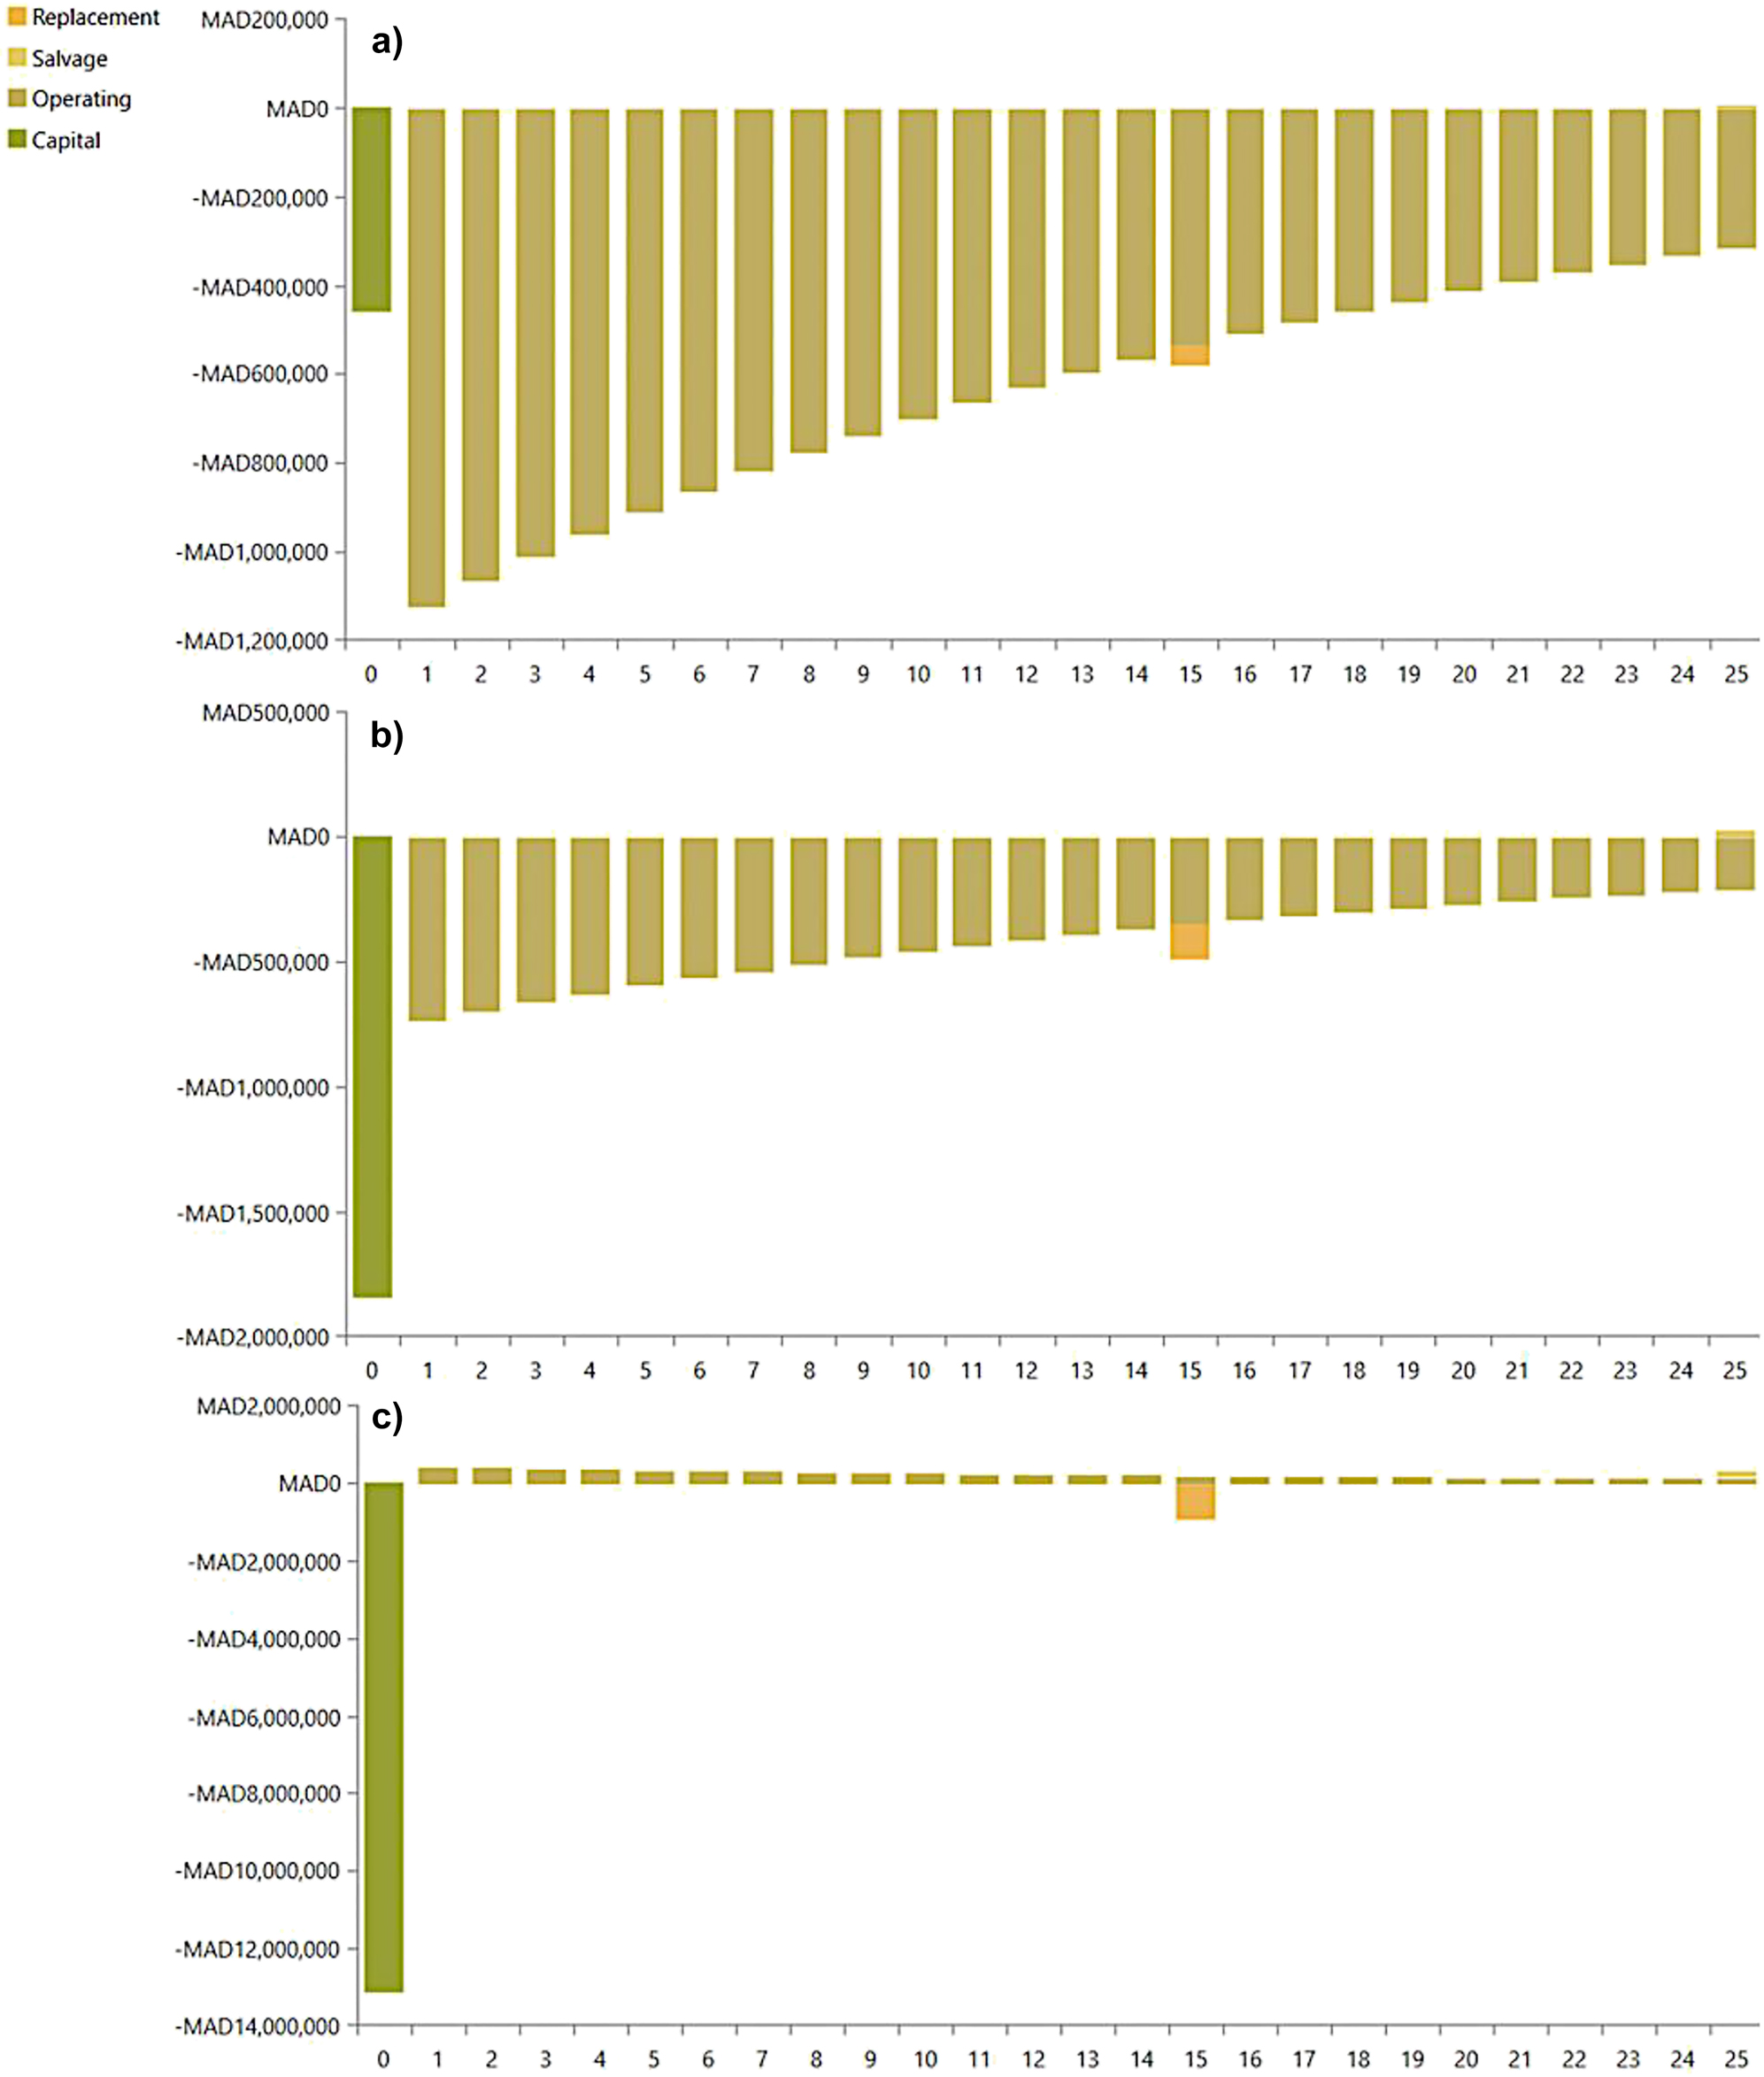
Faculty of Science discounted cashflow of a) scenario 1 b) scenario 2 c) scenario 3.
Purchased and sold energy a) scenario 2 b) scenario 3.
Similarly, the PV installation of the Faculty of Arts can be investigated for expansion, whereby the expansion to 952 kWp instead of 49 kWp leads to a reduction in CO2 emissions to around 98,000 kg/year. The PV system of the Center for further education is approximately similar to the one of the presidency building, for this reason the LCoE achieved is around 0.2954 MAD/kWh and the CO2 emissions are reduced by 17,147 kg/year.
Conclusions
Besides the instructions from the government to the Moroccan universities to rationalize the energy costs since 2021, the University Ibn Tofail in Kenitra has previously set an objective in 2017 to reduce the energy expenses by 40% through the use of photovoltaic arrays. The University has started building photovoltaic carport including charging station for electric vehicles. However, this is far from reaching the 40% target. Furthermore, in November 2021, the Moroccan government passed a new law regarding renewable energy, which allows private households and public service buildings to sell their excess generated energy from renewable sources to the local grid. The previous law 13-09 restricted the amount of surplus energy for sale to a maximum of just 20%. This research work comes to analyze the existing PV facilities and to study the possibilities of upgrading these PV systems. The optimization software HOMER Pro was brought into use, offering excellent capacities. In addition to the simulation of the present PV installations, further simulations can be performed for optimization, taking into account the constraints according to the previous renewable law and the latest one. This optimization software returns several metrics for each scenario studied, for example, the Levelized Cost of Energy, the Net Present Cost and the Return on Invest in case of the optimal sized PV installation. Based on the available meteorological data included in the software, the PV production and the sale of the generated excess energy can as well be predicted and calculated.
In the case of the university facilities equipped with PV systems, the LCoE has been optimized to an impressive 0.1653 MAD/kWh for the presidency building and to 0.2954 MAD/kWh for the Center for Further Education through the use of HOMER Pro. As a result of the optimization, in the case of PV system expansion, CO2 emissions can be significantly reduced by 233,174 kg/year when moving from Scenario 1 to scenario 2. In fact, adopting the proposal in scenario 3 would further decrease the CO2 emissions by 346,813 kg/year. However, to reach this objective, the total installed PV capacity of 165 kWp has to be expanded up to 295% for scenario 2 and even to 2042% for scenario 3. For this purpose, to overcome the high cost associated with the construction of PV carports, the authors of this work propose PV rooftop installations, which will be further explored in another research work involving the use of PVsyst.
-
Author contributions: All the authors have accepted responsibility for the entire content of this submitted manuscript and approved submission.
-
Research funding: None declared.
-
Conflict of interest statement: The authors declare no conflicts of interest regarding this article.
References
Al-Masri, H. M., A. Abu-Errub, W. R. Ayyad, and M. Ehsani. 2016. “On the PV Module Characteristics.” In 2016 International Symposium on Power Electronics, Electrical Drives, Automation and Motion (SPEEDAM), 22–24 June 2016, 901–5. Anacapri Capri Island, Italy: IEEE.10.1109/SPEEDAM.2016.7525948Search in Google Scholar
Ahmed, E. M., H. Norouzi, S. Alkhalaf, Z. M. Ali, S. Dadfar, and N. Furukawa. 2022. “Enhancement of MPPT Controller in PV-BES System Using Incremental Conductance along with Hybrid Crow-Pattern Search Approach Based ANFIS under Different Environmental Conditions.” Sustainable Energy Technologies and Assessments 50: 101812, https://doi.org/10.1016/j.seta.2021.101812.Search in Google Scholar
Ait Errouhi, A., O. Choukai, Z. Oumimoun, and C. El Mokhi. 2022. “Energy Efficiency Measures and Technical-Economic Study of a Photovoltaic Self-Consumption Installation at ENSA Kenitra, Morocco.” Energy Harvesting and Systems, https://doi.org/10.1515/ehs-2021-0081.Search in Google Scholar
Baba, A. O., G. Liu, and X. Chen. 2020. “Classification and Evaluation Review of Maximum Power Point Tracking Methods.” Sustainable Futures 2: 100020, https://doi.org/10.1016/j.sftr.2020.100020.Search in Google Scholar
Boccalatte, A., M. Fossa, and R. Sacile. 2021. “Modeling, Design and Construction of a Zero-Energy PV Greenhouse for Applications in Mediterranean Climates.” Thermal Science and Engineering Progress 25: 101046, https://doi.org/10.1016/j.tsep.2021.101046.Search in Google Scholar
Brunet, C., O. Savadogo, P. Baptiste, M. A. Bouchard, C. Cholez, F. Rosei, C. Gendron, B. Sinclair-Desgagné, and N. Merveille. 2022. “Does Solar Energy Reduce Poverty or Increase Energy Security? A Comparative Analysis of Sustainability Impacts of On-Grid Power Plants in Burkina Faso, Madagascar, Morocco, Rwanda, Senegal and South Africa.” Energy Research & Social Science 87: 102212, doi:https://doi.org/10.1016/j.erss.2021.102212.Search in Google Scholar
Cantoni, R., and K. Rignall. 2019. “Kingdom of the Sun: a Critical, Multiscalar Analysis of Morocco’s Solar Energy Strategy.” Energy Research & Social Science 51: 20–31, https://doi.org/10.1016/j.erss.2018.12.012.Search in Google Scholar
Chen, J., J. Li, B. Ye, X. Zhang, R. D. Tyagi, and X. Gao. 2021a. “Energy Balance Assessment on Chicken Manure for Biogas Production in Rabat-Salé-Zemmour-Zaïr of Morocco.” Journal of Environmental Management 299: 113656, https://doi.org/10.1016/j.jenvman.2021.113656.Search in Google Scholar PubMed
Chen, Z., H. Yu, L. Luo, L. Wu, Q. Zheng, Z. Wu, S. Cheng, and P. Lin. 2021a. “Rapid and Accurate Modeling of PV Modules Based on Extreme Learning Machine and Large Datasets of I-V Curves.” Applied Energy 292: 116929, doi:https://doi.org/10.1016/j.apenergy.2021.116929.Search in Google Scholar
Choukai, O., C. El Mokhi, A. Hamed, and A. Ait Errouhi. 2022. “Feasibility Study of a Self-Consumption Photovoltaic Installation with and without Battery Storage, Optimization of Night Lighting and Introduction to the Application of the DALI Protocol at the University of Ibn Tofail (ENSA/ENCG), Kenitra – Morocco.” Energy Harvesting and Systems, https://doi.org/10.1515/ehs-2021-0080.Search in Google Scholar
Ghani, F., M. Duke, and J. Carson. 2013. “Numerical Calculation of Series and Shunt Resistances and Diode Quality Factor of a Photovoltaic Cell Using the Lambert W-Function.” Solar Energy 91: 422–31, https://doi.org/10.1016/j.solener.2012.09.005.Search in Google Scholar
Komendantova, N. 2021. “Transferring Awareness into Action: A Meta-Analysis of the Behavioral Drivers of Energy Transitions in Germany, Austria, Finland, Morocco, Jordan and Iran.” Energy Research & Social Science 71: 101826, https://doi.org/10.1016/j.erss.2020.101826.Search in Google Scholar
Khalil, L., K. Liaquat Bhatti, M. Arslan Iqbal Awan, M. Riaz, K. Khalil, and N. Alwaz. 2021. “Optimization and Designing of Hybrid Power System Using HOMER Pro.” Materials Today Proceedings 47: S110–5, https://doi.org/10.1016/j.matpr.2020.06.054.Search in Google Scholar
Marzo, A., A. Salmon, J. Polo, J. Ballestrín, G. Soto, G. Quiñones, J. Alonso-Montesinos, E. Carra, M. Ibarra, J. Cardemil, E. Fuentealba, and R. Escobar. 2021. “Solar Extinction Map in Chile for Applications in Solar Power Tower Plants, Comparison with Other Places from Sunbelt and Impact on LCOE.” Renewable Energy 170: 197–211, doi:https://doi.org/10.1016/j.renene.2021.01.126.Search in Google Scholar
Mo, S., Q. Ye, K. Jiang, X. Mo, and G. Shen. 2022. “An Improved MPPT Method for Photovoltaic Systems Based on Mayfly Optimization Algorithm.” Energy Reports 8: 141–50, https://doi.org/10.1016/j.egyr.2022.02.160.Search in Google Scholar
Moghassemi, A., S. Ebrahimi, S. Padmanaban, M. Mitolo, and J. B. Holm-Nielsen. 2022. “Two Fast Metaheuristic-Based MPPT Techniques for Partially Shaded Photovoltaic System.” International Journal of Electrical Power & Energy Systems 137: 107567, https://doi.org/10.1016/j.ijepes.2021.107567.Search in Google Scholar
Singh, A., P. Baredar, and B. Gupta. 2015. “Computational Simulation & Optimization of a Solar, Fuel Cell and Biomass Hybrid Energy System Using HOMER Pro Software.” Procedia Engineering 127: 743–50, https://doi.org/10.1016/j.proeng.2015.11.408.Search in Google Scholar
Shi, Y., Y. Sun, J. Liu, and X. Du. 2021. “Model and Stability Analysis of Grid-Connected PV System Considering the Variation of Solar Irradiance and Cell Temperature.” International Journal of Electrical Power & Energy Systems 132: 107155, https://doi.org/10.1016/j.ijepes.2021.107155.Search in Google Scholar
Sousa, S. M., L. S. Gusman, T. A. S. Lopes, H. A. Pereira, and J. M. S. Callegari. 2022. “MPPT Algorithm in Single Loop Current-Mode Control Applied to Dc–Dc Converters with Input Current Source Characteristics.” International Journal of Electrical Power & Energy Systems 138: 107909, https://doi.org/10.1016/j.ijepes.2021.107909.Search in Google Scholar
Sivakumar, P., A. Abdul Kader, Y. Kaliavaradhan, and M. Arutchelvi. 2015. “Analysis and Enhancement of PV Efficiency with Incremental Conductance MPPT Technique under Non-linear Loading Conditions.” Renewable Energy 81: 543–50, https://doi.org/10.1016/j.renene.2015.03.062.Search in Google Scholar
Wang, Y., M. Gao, J. Wang, S. Wang, Y. Liu, J. Zhu, and Z. Tan. 2021. “Measurement and Key Influencing Factors of the Economic Benefits for China’s Photovoltaic Power Generation: A LCOE-Based Hybrid Model.” Renewable Energy 169: 935–52, doi:https://doi.org/10.1016/j.renene.2021.01.028.Search in Google Scholar
Yaman, K., and G. Arslan. 2021. “A Detailed Mathematical Model and Experimental Validation for Coupled Thermal and Electrical Performance of a Photovoltaic (PV) Module.” Applied Thermal Engineering 195: 117224, https://doi.org/10.1016/j.applthermaleng.2021.117224.Search in Google Scholar
Zhang, Y., P. Hao, H. Lu, J. Ma, and M. Yang. 2022. “Modelling and Estimating Performance for PV Module under Varying Operating Conditions Independent of Reference Condition.” Applied Energy 310: 118527, https://doi.org/10.1016/j.apenergy.2022.118527.Search in Google Scholar
© 2022 Walter de Gruyter GmbH, Berlin/Boston
Articles in the same Issue
- Frontmatter
- Review
- A comprehensive review on electric vehicles: charging and control techniques, electric vehicle-grid integration
- Research Articles
- Evaluation of parameters influencing the performance of photovoltaic-thermoelectric (PV-TE) hybrid system
- Dispatchable power supply from beam down solar point concentrator coupled to thermal energy storage and a Stirling engine
- Modelling, design and parametric analysis of a levitation based energy harvester
- Performance optimization of flywheel using experimental design approach
- Assessment and optimization of photovoltaic systems at the University Ibn Tofail according to the new law on renewable energy in Morocco using HOMER Pro
- Optimizing hybrid power system at highest sustainability
- Preparation of Na2HPO4⋅12H2O-based composite PCM and its application in air insulated box
- The efficiency of linear electromagnetic vibration-based energy harvester at resistive, capacitive and inductive loads
- A numerical investigation of optimum angles for solar energy receivers in the eastern part of Algeria
- Experimental investigation of soiling effects on the photovoltaic modules energy generation
- Frequency domain analysis of a piezoelectric energy harvester with impedance matching network