Techno-economic analysis and design of hybrid renewable energy microgrid for rural electrification
-
Negasa Muleta

 und
Altaf Q H Badar
und
Altaf Q H Badar

Abstract
Electricity is the most sought after resource in this world and is crucial for the development of any community. The power system structure has been changing according to the evolving scientific technologies. A novel concept in this direction is a Microgrid (MG) which is a small power system having generation and distribution with negligible presence of transmission. A MG can operate in off-grid (standalone) or grid-connected mode. The objective of this study is to perform techno-economic analysis and to design a MG model for the purpose of rural electrification. The region being considered has different resources which are capable of providing reliable supply to the load. The proposed model is compared economically with the option of grid extension. The study considers power system reliability and economic feasibility as the primary objectives for MG modelling. The village of Jarre which is located in the eastern part of Ethiopian, Somali region, is selected for this study. Particle Swarm Optimization is implemented for obtaining the most economic and reliable MG having Hybrid Renewable Energy Sources (HRES). The simulation is performed using MATLAB and Homer.
Introduction
Electricity has become a basic necessity all over the world. The most remote regions in underdeveloped countries still lack electric supply. There is a need to provide these regions with electricity. The electric supply can be extended to these regions either through the extension of grid or installation of standalone MG. A detailed analysis is required for selecting the optimal option.
MG is a small power system consisting of its own generation and load with negligible transmission. The MG can operate in off – grid (standalone) or grid – connected mode. Such power system modules improve the reliability, resilience and diversity of the power system. It also reduces carbon emissions and minimizes the cost of operation (Ghenai, Salameh, and Merabet 2020). Micro grids provide a promising solution towards the electrification of rural regions.
The extension of grid requires addition of infrastructure and its maintenance. This extension shall be constructed/installed from the nearest point to the remote region having electricity. The process of extension of grid will include installation of towers, transformers and other equipment as per the requirement. The distance for which this extension is to be implemented plays a very important role, as well.
On the other hand, installation of standalone MG, requires analysis of demand and availability of energy generation resources. The generation of electricity can be through renewable and non-renewable sources. Renewable Energy Sources (RES) like wind, solar, biomass, tidal, geothermal, etc. are continuously replenished through natural processes and should be utilised to the maximum limit. These sources are cheaper in operational cost (Russell 2020; Timilsina 2020) and do not pollute the environment (Le, Chang, and Park 2020) when compared to conventional sources. Benefits of being reliable and safe (Ali et al. 2020) can also be achieved.
A demerit related to the RES is its intermittent generation pattern which is not predictable. This behaviour of RES can create stability problems in the system. To overcome this demerit a hybrid system can be designed, which combines different resources and Energy Storage Systems (ESS). HRES models have been found to be an attractive alternative to single source models.
The provision of electric supply to remote regions is dominated by factors like economics and reliability. These factors also help to determine the performance level of the system. Different Optimization techniques are used in MG proper design and operation of MG. Paper (Nagapurkar and Smith 2019; Ravanbakhshian and Amindoust 2020) deals with Genetic Algorithm (GA) application in MG for economic optimization. Particle Swarm Optimization (PSO) is also used in reliability improvement and cost minimization of renewable MG systems (Ding et al. 2019; Nekkache et al. 2018). GA, Fuzzy Logic Control (FLC), PSO and Artificial Bee Colony (ABC) are applied for energy cost optimization for hybrid resources such as PV, WT, FC, BS and diesel generator (Al-Sakkaf et al. 2019). In addition to above mentioned techniques such as Elephant Herd optimization (EHO) (Prasad, Subbaramaiah, and Sujatha 2019), Differential Evolution (OTCDE) (Kumar, Mandal, and Chakraborty 2019), Firefly Algorithm (FA) (Shayeteh and Moghaddam 2020), Lightning Search Algorithm (LSA) (Al-Nujaimi, Abido, and Al-Muhaini 2018) are some others used in optimization of MG with different objective function.
Sawle, Gupta, and Bohre (2018a) compare GA and PSO for optimization of reliability, cost and participation of renewables for a hybrid renewable system model. PSO is found to optimize the results better than GA. An analytical model using algebraic equations is proposed to determine PV array area and optimal battery storage capacity (Jakhrani et al. 2012). The storage size is optimized for a standalone PV system, in terms of reliability and cost.
In Ethiopia, only 45% of the total population have access to electricity and 11% of its rural population gets electricity through decentralized systems (A and Ethiopia electricity, 2019). To supply power to the rest of the population, standalone (or isolated MG) power supply systems, can be implemented as grid extension is logistically challenging and too costly for the remote areas. The feasibility of establishing a standalone MG is dependent on utilization of resources, their planning, design and operation. The analysis of such a model is based on: costs, reliability and environmental effects. An analysis of cost-benefit and Green House Gas (GHG) emission of a hybrid system model for electrification of a remote rural village in Ethiopia is performed (Gebrehiwot et al. 2019). The comparison of different resources is performed using HOMER software.
In this research, an analyses is performed based on cost and reliability of supply for the rural region of Jarre, Ethiopia. The options considered for electrification of the concerned region are: grid extension and establishment of a MG. The optimal designing of MG is also performed. In Sub-Saharan Africa, the average grid extension cost is estimated to be $20,000/km for Medium Voltage (MV) line. Considering inflation rate and other factors, it escalates up to $25,000/km (Longe et al. 2017). Grid extension feasibility analysis is conducted by comparing break-even point for grid extension and installation of stand alone or isolated MG costs. The cost of grid extension for this study is taken from Ethiopia’s electric utility cost breakdown of MV line construction guideline (It was collected in person and hence no reference has been cited for the same). PSO is implemented using MATLAB to obtain the optimal combination of resources in the MG.
The contributions of this paper are: i) It considers a practical case of rural electrification and provides a feasible solution ii) It presents a justified comparison between the options of grid extension and standalone system based on economic and reliability factors, iii) The research gives more importance to reliability unlike previous research literature and provides a 100% reliable model as a solution for the standalone system and iv) It displays an application of optimization techniques for designing of standalone microgrid systems.
The sections in this paper are organized as: Section II deals with methods of power system integration. Section III discusses the performance evaluation parameters of the power system. Section IV deals with methodology and proposed algorithms. In Section V, the details of the case study are presented along with the analysis and discussion of the optimal model obtained. The final section presents the conclusion.
Rural electrification methods
In this section, we explore the options of availing electricity to remote regions through grid extension method and installation of standalone MG.
Grid extension deals with the installation of all equipments required to bring the grid power to the selected region of Jarre. The costs involved in this process are considered under grid extension. Grid extension may not be applicable everywhere in the rural areas due to limited budget and infrastructure, high cost per connection and the need for energy being supplied first at urban load centres due to economic factors (louis).
In the standalone MG system, different RES are studied which can be a part of this installation. According to the availability of resources, demand of the region and cost of renewable sources, the optimal design of MG can be found. The MG should be autonomous in nature and should be capable of controlling power within the network. A standalone MG system is favorable for remote areas where providing grid connection is not feasible. MG based electrification is favorable than grid extension for the communities that are: far away from the grid, consume a small amount of energy, dispersed and not prioritized for grid extension.
This section is classified into two parts. In the first part, we explore the factors related to the installation of a grid connected systems like Break Even Distance (BED). In the second part, the details of a standalone system consisting of renewable sources and other related equipment’s is presented.
Grid connected power system
The electrical grid is a complex system, designed to provide electricity to the customers in a secure, reliable and economic way. A grid is classified into generation, transmission, and distribution. Grid extension is used for connecting non electrified regions to the existing grid network and spread the electrical connectivity. It requires constructing the required and associated infrastructure between the grid and the region to be included in the grid. During grid extension, there is no compulsion for new generation or storage systems to be installed in the remote region.
BED is the distance at which the total Net Present Cost (NPC) of grid extension and installing a stand-alone system are equal (Walker; Azimoh et al. 2016) and calculated using Equation (1).
Where CNPC:total net present cost power system ($)
El: total annual electrical demand, (kWh/yr)
Cp: cost of power from the grid, ($/kWh)
ComG: O & M cost of grid extension, ($/yr/km)
CcapG: capital cost of grid extension, ($/km)
i: interest rate per year, (%)
n: project life time (yr).
Off-grid/standalone MG power supply system
The most common power supply sources for off-grid power system are the RES that are available in the vicinity of the proposed area. In Ethiopia, Solar and Wind power generations are the most commonly available RES for a standalone MG system. The RES also require certain specific equipment’s and energy storage systems to establish and install a complete standalone system.
Solar PV power
Solar power can be derived through solar panels. It can be utilized either for thermal loads or direct electricity generation.
The power output of the solar PV system (Ppv) is computed for every hour as given in Equation (2) (Sawle, Gupta, and Bohre 2018b).
Where Pr: PV panel rated power (W).
R: radiation factor
Rcr: certain radiation point, usually set as 150 W/m2 (Maleki, Ameri, and Keynia 2015)
Rsr: standard solar radiation at 1000 W/m2
n: number of PV panels.
Harvesting of solar irradiation is optimized by using Mechanical and Electrical Maximum Power Point Tracking (Alharthi et al., 2018; Pakkiraiah and Sukumar 2016). Different techniques can be employed to implement the above methods.
Wind turbine
Wind energy is a clean and abundant form of energy available for rural electrification. The hourly output power of the wind turbine (Pwt) can be evaluated through Equation (3).
Where n: number of turbines
V: instantaneous speed, (m/s)
Vc: cut-in speed, (m/s)
Vr: rated speed, (m/s)
Vf: cut-off wind speed, (m/s)
Pr: rated electrical power, (w)
For this study, the values of 2, 9 and 30 m/s are used for Vc, Vr and Vf, respectively (energy 2020).
The different atmospheric conditions and surface roughness of the site have influence on the vertical profile of winds. The wind speed at different altitude is estimated through different methods. The log law (logarithmic) and power law (exponent) are extrapolating techniques of wind speed to hub height ratio (Donnou et al. 2019).
To increase wind farm’s electrical production performance in a given location, a deep analysis of wind characteristics is required. Wind energy potential in several regions of the world is evaluated through the use of Probability Density Functions (PDF). The Rayleigh, Weibull and Lognormal functions are commonly used to describe the measured wind speed probability distribution curves (Ucar and Balo 2009). To obtain the required energy or to control the wind turbine plants: pitch and stall control are commonly used (Samani et al. 2020).
Battery storage
Storage of electric power is a crucial factor especially for a standalone system. The energy storage system helps in improving the reliability of a system against the backdrop of intermittent renewable energy sources. For the case study being presented, Battery Storage (BS) is considered. It also improves the system stability and resource utilization rate (Zhu, Guo, and Zhao 2021). Battery State of Charge (SOC) is used to measure the level of charge present on an electric battery with respect to its capacity. It is calculated by using Equation (4).
Where
σ: self-discharge rate for 1 h (Maleki, Ameri, and Keynia 2015), 0.0002
An accurate estimation of SOC helps to maintain the battery operation within specified limits. This avoids the chances of battery being fully discharged or overcharged.
Converters
Converters play an important role in integrating the renewable energy sources into the standalone MG. Power coming from the renewable source can be AC or DC. Also the BS can be used for storing excess energy, when generation is more than demand. The power generated from these sources have to be converted such that the its parameters are suitable for consumption or storage. For this purpose the converters are used.
Converter rating (
Charge controller
The charge controller is used to regulate the excessive charging or discharging of BS by limiting the charging or discharging current. Charge controller capacity (Icc) is obtained through the ratio of maximum generation capacity of the resource (Pmax) and battery voltage (Vbatt) as formulated in Equation (6).
There might be a situation in which there is excess generation and the batteries are charged to their maximum capacity. A dump load can be used in such situations, in addition to the charge controller (Salman, Al-Ismail, and Khalid 2020).
Problem formulation
Electrification of a remote rural region can be performed through the extension of the grid or by installation of a standalone MG system. This section presents the different factors associated with the evaluation of these options. For such a project involving planning and operation, the economic cost of the proposed solution is the most influential parameter. Reliability of the system is also one of the important factors that shall affect the power system performance. Another important factor that can be considered, is the pollution occurring due to the planned system. However, in this study, since all the resources are of renewable type, the emission of GHG is insignificant and hence can be neglected.
This section discusses the different factors considered while finding the optimal solution.
Reliability
Power system reliability refers to the ability of a power system to provide a stable and adequate supply. Electrical energy sources such as solar and wind introduce unpredictability in the system due to their intermittent characteristics. The issue of reliability is a matter of great concern for the emerging power systems which employ intermittent sources.
To analyse the off-grid power system reliability: Unmet load and capacity shortage parameters are widely used. Unmet load is load demand that the power supply is unable to satisfy. This usually occurs when supply is quite less than the demand (kWh/year).
The Loss of Power Supply Probability (LPSP) is also widely implemented to assess the system reliability as discussed in (Ma and Javed 2019). LPSP is calculated for a time interval of 0 to T as seen in Equation (7).
where PL: total load demand, (W)
PS: total generated power, (W)
Lower value of LPSP indicates a highly reliable system. The objective of reliability analysis is to design a standalone MG with LPSP as zero, thus making system 100% reliable.
Economic cost
The economics involved in power generation employs different methods to determine the per-unit cost of electrical energy produced. In a power system network, Levelized Cost of Energy (LCOE) ($/kWh/yr) is considered for analyzing the economic performance of various available resources and is formulated as in Equation (8).
where EL: annual energy produced, (kWh/yr),
TAC: Total Annualized Cost of the system, calculated by using Equation (Nekkache et al. 2018).
Ncop: number of components/units used
Com: O & M cost, ($/yr/km)
Ccap: total capital cost, ($/km)
CRep: total replacement cost, ($/km)
n: project lifetime, (yr)
LF: components lifetime, (yr)
i: interest rate per year, (%)
In the case study presented, the model formulation for the given site is a multi-objective function consisting of reliability and cost of energy. The optimal result should have minimized cost, but the reliability should be maximized or LPSP should be minimized. Thus the over all analysis is to minimize the objectives while satisfying the constraints as shown in Equations (10)–(14). The overall objective function is represented as:
Subject to
where
Pbat: battery capacity at time ten
SOCmin: minimum allowable state of charge for BS
SOCmax: maximum allowable state of charge for BS
PL: Peak Load
The constraints are enlisted in Equations (11)–(14). The ± sign in Equation (14) is to imply that the battery may be charging or discharging. The individual resources should together supply the load at all times, thus their total capacity is required to be more than the peak load.
Proposed methodology
The methodology used in the study and the algorithms implemented for obtaining the output of the study are discussed in this section.
Methodology
The methodology applied for obtaining the optimal solution for the electrification of Jarre region in Ethiopia involves evaluation and comparison of costs related to grid extension and installation of standalone system. The optimized specification of standalone MG is obtained through the implementation of Particle Swarm Optimization (PSO). The methodology used to determine the size of power generating units to be installed in the MG is shown in Figure (1).
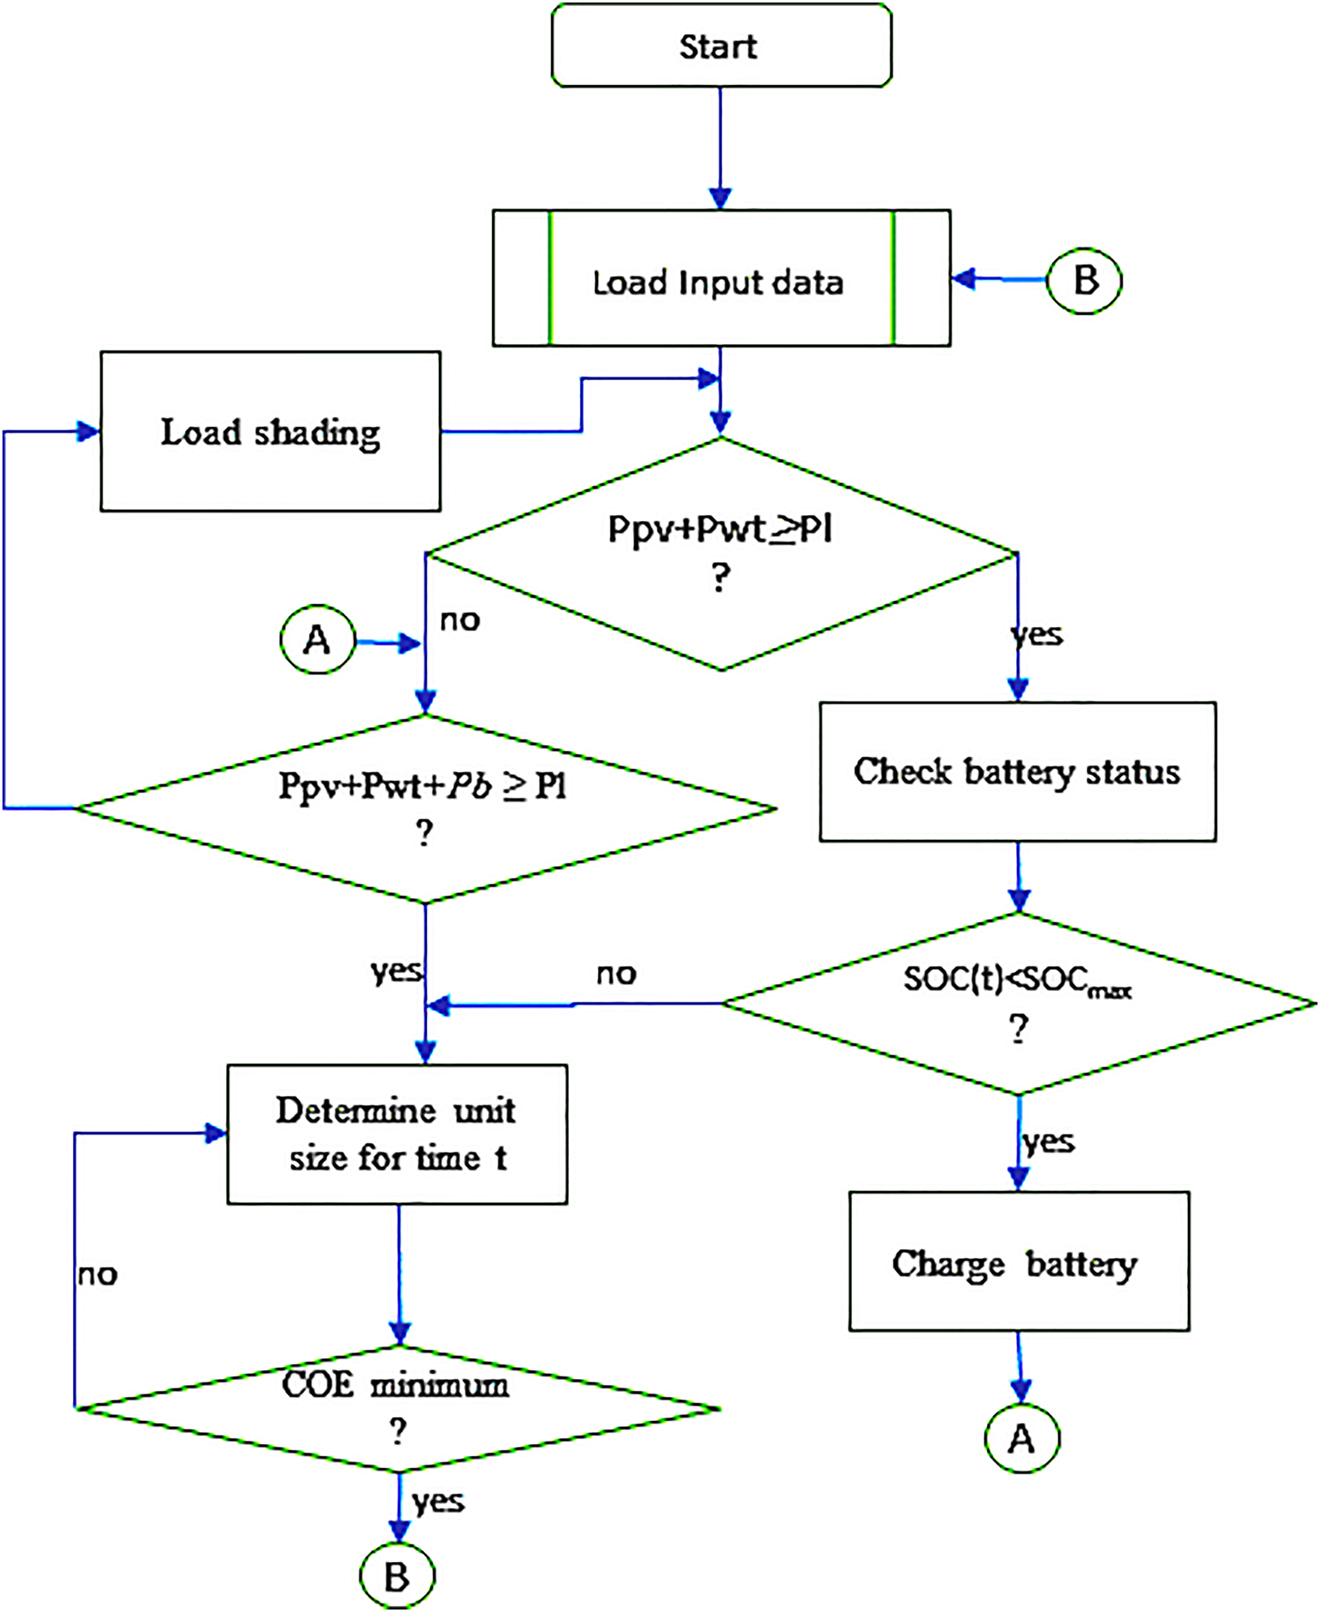
Flowchart of proposed methodology.
For a standalone MG system, the demand requirement at all times should be known. In case, there is excess generation, the demand is supplied and the batteries are charged, simultaneously. On the other hand, in case of generation being less than the demand will require the battery to discharge. The charging or discharging action of batteries shall depend on the state of charge and the generation of the standalone system in that hour. Load shedding can be resorted to as a final solution when renewable generation and battery storage fail to supply the loads. However, presence of load shedding would infer that the reliability of the system is not 100%.
In the analysis of providing electricity to the remote region of Jarre, two options are to be evaluated. In the first option, grid extension is considered. The costs of grid extension can be evaluated directly, based on the distance be the region being considered and the nearest electrified point. In the second option, a standalone MG is proposed to be installed within the given region. The costs related to such a proposed standalone MG shall depend on the number of PV panels, wind turbines and batteries, that shall be a part of it. Optimization technique of Particle Swarm Optimization is employed to find the optimal combination of these components in case of standalone system.
Particle Swarm Optimization (PSO)
PSO is motivated with the movements of school of fishes or flock of birds. It was developed by Kennedy and Eberhart (1995). PSO is a global optimum search algorithm (Ding et al. 2019), that combines the process of exploitation and exploration. It is a robust method and has been implemented for different variations, like (Badar, Umre, and Junghare 2012). During each iteration of the search problem, particle position is updated as:
Particle velocity
Particle velocity gives the difference by which a particle moves from one position to the other in between two iterations. New particle velocity (V(t+1)) for ith particle is calculated by using Equation (15).
New particle position
The new particle position (X(t+1)) for ith particle is calculated by using Equation (16).
where
c1: personal influence coefficient
c2: social influence coefficient
w: inertia
pbest: particle best position
gbest: swarm best position
The flowchart for designing the MG model at Jarre is presented in Figure (2). The initial data including constraints is read first and random particles are generated. The feasibility of the particles is checked in each iteration. Feasibility in this case relates to the combination of renewable sources and batteries being able to satisfy the load at the selected site at any given time. The particles are also checked for their constraint limits. The individual and global best positions are updated and the particles are moved to a new position. In case the stopping criteria is satisfied, the optimal results are printed.
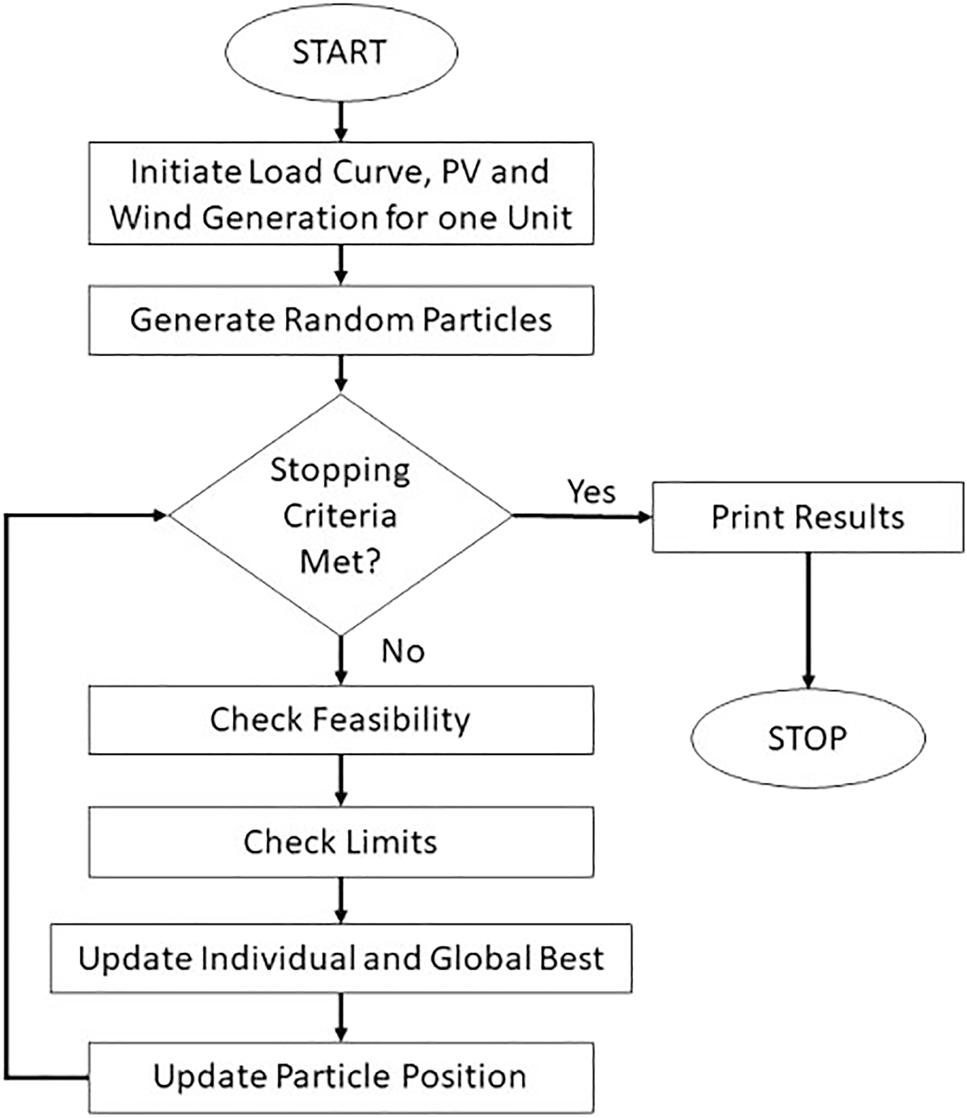
Flowchart for PSO.
The optimization problem being discussed in this research paper deals with finding the optimal combination of the number of PV panels, wind turbines and battery packs for the standalone microgrid system. The objectives of the optimization process is to find an economic and reliable solution. However, the value of LPSP is considered to be 0, to make system 100% reliable. This converts the problem from a multi objective problem to a feasibility problem, since there are very few solutions that can have LPSP as 0.
PSO method is employed due to ease in programming, gives high-quality solutions with stable convergence, adaptability and robustness. As discussed in (Nekkache et al. 2018; Ghorbani et al. 2018), PSO provides credible results for optimization of reliability and operation cost.
Results and discussion
The proposed research work is carried out for obtaining optimal method to provide electricity to Jarre village situated in Somali region of Ethiopia located at 9.6908738 N, 42.7539328 E. The village consists of approximately 150 households. The nearest grid substations are located more than 50 km from the selected site. The renewable sources present in the region can be utilised to install a standalone MG. This MG system should be able to reliably supply the existing load. This study presents a methodology to justify the installation of a standalone system or a grid connected system. Some variations in input data can be expected with the change in the day being considered. The solar and wind data pattern is considered for days having leaner power generation capacity, which would mean that the power generation would be more for other days of the year.
This section presents and discusses the different aspects related to the design of isolated MG model or extension of grid for Jarre village. Pre-feasibility evaluation of the site is done based on weather data including load demand, solar irradiance and wind velocity.
Load profile
Electricity demand of connected households mainly relates to micro-economic theory; income, energy prices and preferences of the household (Louw et al. 2008). At the selected site, there are about 150 households having a daily average load of 3173 kWh/day with 285.5 kW of peak load and a minimum load of 8.25 kW as shown in Figure 3. The common loads used by different households are lighting lamps, TV and radio, mobile charger, refrigerator, ventilation, cooking stoves, etc. Primary school, health post, flour mills and water pumps for drinking and irrigation that operate at morning and afternoon are other loads present in the village.
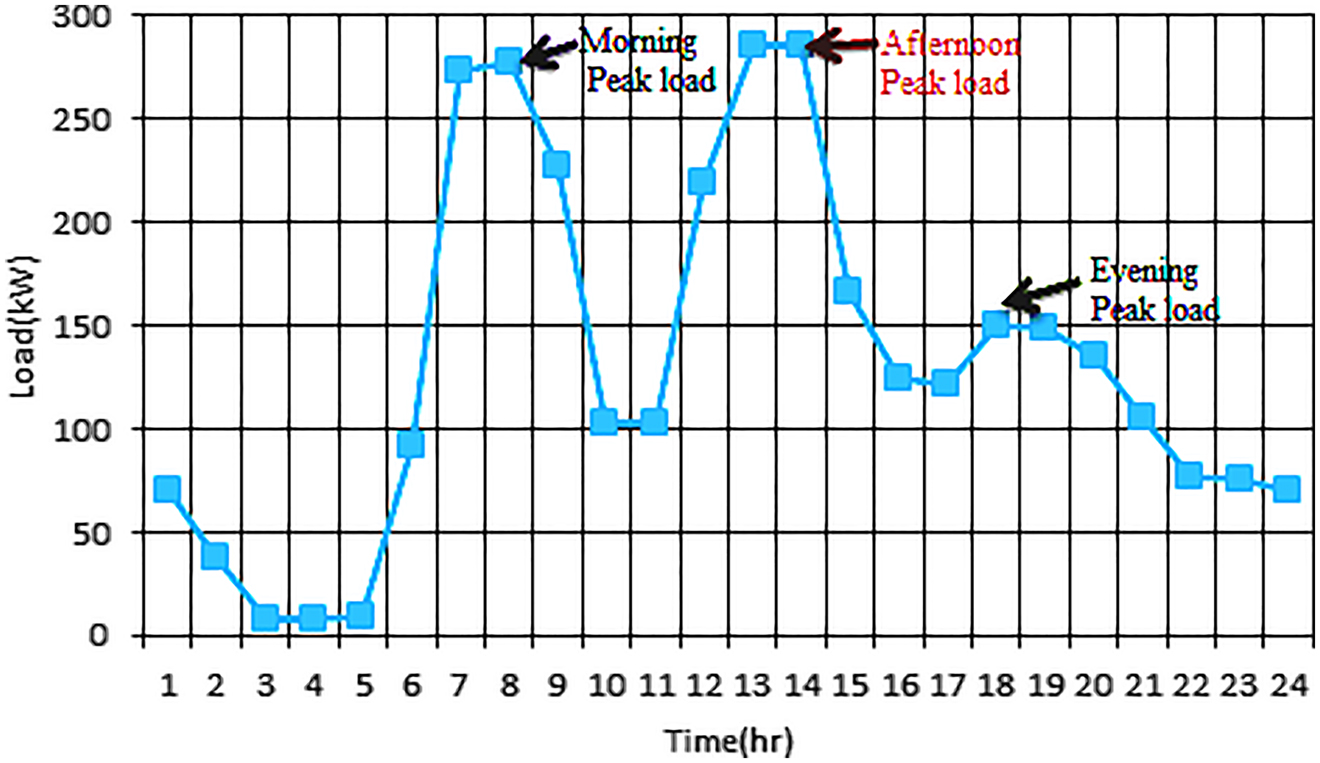
Hourly load variation for Jarre village.
Solar resource
In the power generation from solar PV, solar irradiation and temperature are the main factors that determine the output power of a PV cell. The hourly average solar irradiation of the site is taken from Global Solar Atlas database. From the data base, the least solar irradiation is observed for the month of July and these values are considered during the design process to minimize the chances of energy shortage and is shown in Figure 4. Jarre has an average daily solar irradiation of 6.15 kWh/m2. From the figure it can be observed that the peak occurs at 12 noon.
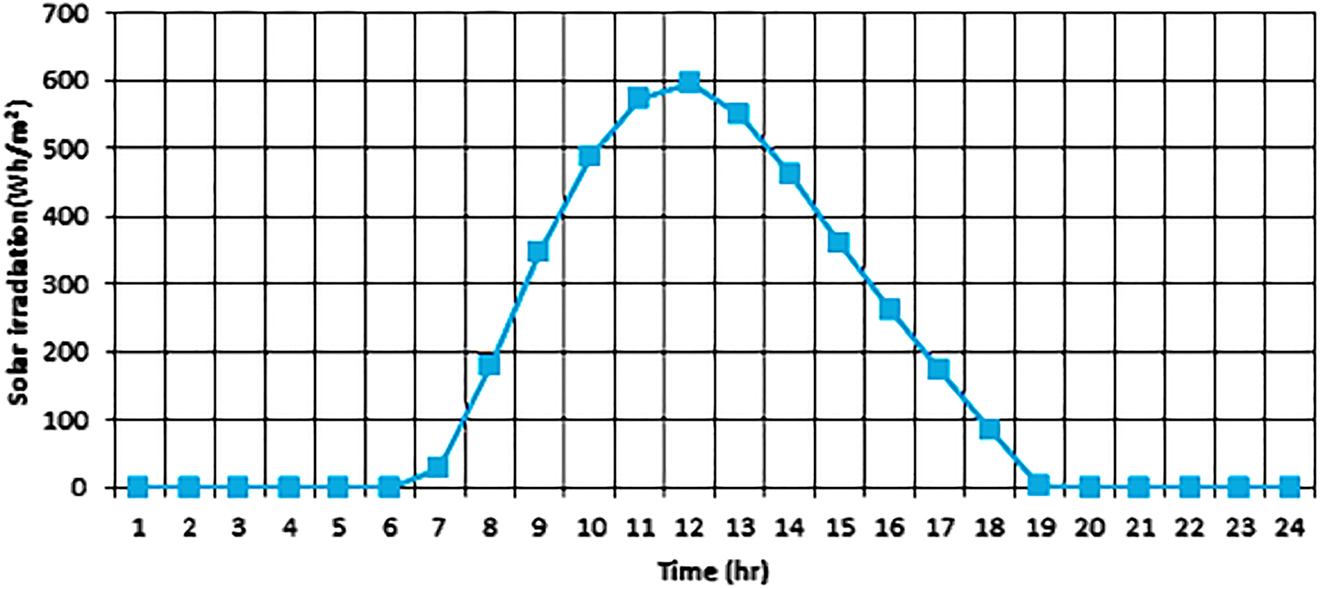
Hourly direct solar irradiation for Jarre village on Earth surface.
Wind resource
As a standard, there are classes of power potential that can be harvested from different wind speed and at different hub height. The classes are mainly influenced by site’s wind speed as summarised in Table 1, taken from world wind speed standards (Wei Tong 2010). Accordingly, Jarre is categorized under class 4 (good) having average wind speed of 5.8 m/s and it is feasible to consider harvesting power from wind turbines.
Classes of wind power from (Wei Tong 2010).
| Power class | Potential | P (W/m2) @10m | V(m/s) @ 10m | P (W/m2) @50m | V(m/s) @50m |
|---|---|---|---|---|---|
| 1 | Poor | <100 | <4.4 | <200 | <5.6 |
| 2 | Marginal | 100–150 | 4.4–5.1 | 200–300 | 5.6–6.4 |
| 3 | Moderate | 150–200 | 5.1–5.6 | 300–400 | 6.4–7.0 |
| 4 | Good | 200–250 | 5.6–6.0 | 400–500 | 7.0–7.5 |
| 5 | Excellent | 250–300 | 6.0–6.4 | 500–600 | 7.5–8.0 |
| 6 | Excellent | 300–350 | 6.4–7.0 | 600–800 | 8.0–8.8 |
| 7 | Excellent | >400 | >7.0 | >800 | >8.8 |
The daily wind speed of the site is taken as shown in Figure (5). It represents the wind profile of 9th April, 2021 at the selected site.
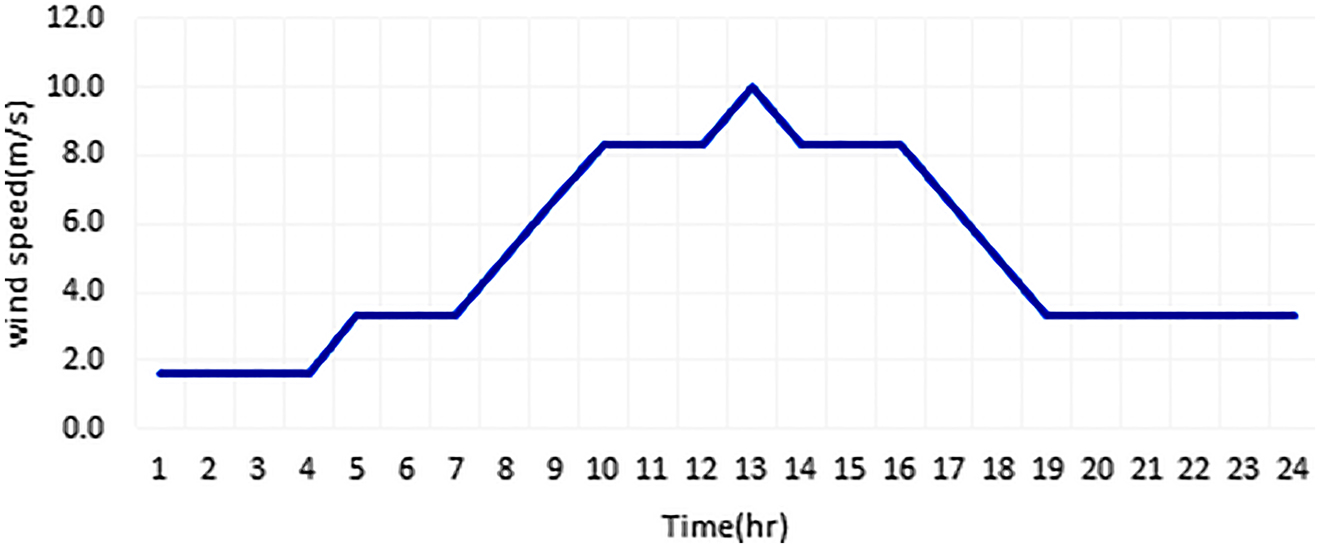
Wind speed in Jarre village with hub height of 10 m from (World weather online (2021).
Grid extension cost
In the extension of grid, the cost of MV transmission line is only considered along with its accessories. The costs related to Low Voltage (LV) line construction is neglected as it would be required for the grid extension as well as the standalone system. The total cost of constructing the MV transmission line for 1 km is summarized in Table 2. The data is presented in dollars converted from Ethiopian Birr.
Cost breakdown for grid extension per km.
| Activities list | Costs ($) |
|---|---|
| Material cost | 16,091.62 |
| Labour cost | 2237.14 |
| Overhead cost | 808.97 |
| Total cost | 19,137.74 |
| Reserve cost (20% of total cost) | 3827.55 |
| Grand total | 22,965.28 |
The distance from the village to the nearest substation connected to the grid is approximately 50 km. Considering the costs from Table 2, the total costs involved in extension of the grid to Jarre is
Standalone system
The cost of standalone hybrid resource is taken from the present cost of components in the market and listed in Table 3. The load curve for the selected site is presented in Figure 3. It can be observed that there are multiple peaks in the curve. However, the peak at noon is the highest and is considered for setting the limits for the number of solar panels, wind turbines and batteries that can be installed in the standalone MG system.
Costs of components with accessories for off-grid supply.
| Comp | Rating | Cap ($/kW) | Rep ($/kW) | O&M ($/kW/yr) | Life span (yr) |
|---|---|---|---|---|---|
| Solar PV | 1 kW | 1000 | 0 | 5 | 20 |
| Wind turbine | 10 kW | 4500 | 0 | 9 | 20 |
| Battery | 100 Ah (1.2 kWh) | 150 | 150 | 2 | 5 |
| Converter | 300 kW | 1000 | 1000 | 0 | 10 |
The PSO is executed for obtaining the optimal combination for the number of PV panels, Wind turbines and batteries with an objective of minimizing the cost. The output is also required to satisfy the constraint of LPSP = 0 i.e., the load should be satisfied at all times. PSO is executed 40 times for compilation of the results and in each execution it considers the performance of the system for 48 h. The first 24 h of the simulation is used to find the initial state of charge of the batteries at the beginning of the day. MATLAB is used to apply the PSO technique.
For analysis purpose two cases are assumed: 1) Ideal case – SOCmin is taken as zero while SOCmax is 100%. The efficiency of battery and converter is considered as 100% with zero self-discharge rate in Equation (4) and 2) Practical case – efficiency of battery and converter is taken as 90%, while self-discharge rate is considered as 10−4. As age of the batteries increase, their SOC capacity declines, resulting in a narrower range of SOC (Raj, Rodrigues, and Abraham 2020). Thus, in the second case, for the analysis of standalone system, SOCmax is taken as 90% and SOCmin as 20%.
Ideal system
Figure 6 shows the variation of cost with respect to variations in the number of panels, turbines and batteries for 40 executions in a sorted order. The minimum cost of standalone system is found to be 0.10368$/kWh with 164 solar panels, 57 wind turbines and 128 battery packs, required to cover the given load, for the ideal case. The total energy balance during the day between the load, energy generated by RES and the charging and discharging of batteries is presented in Figure (8a). It can be observed that the battery is discharged thrice within the day corresponding to the peaks in the load curve.
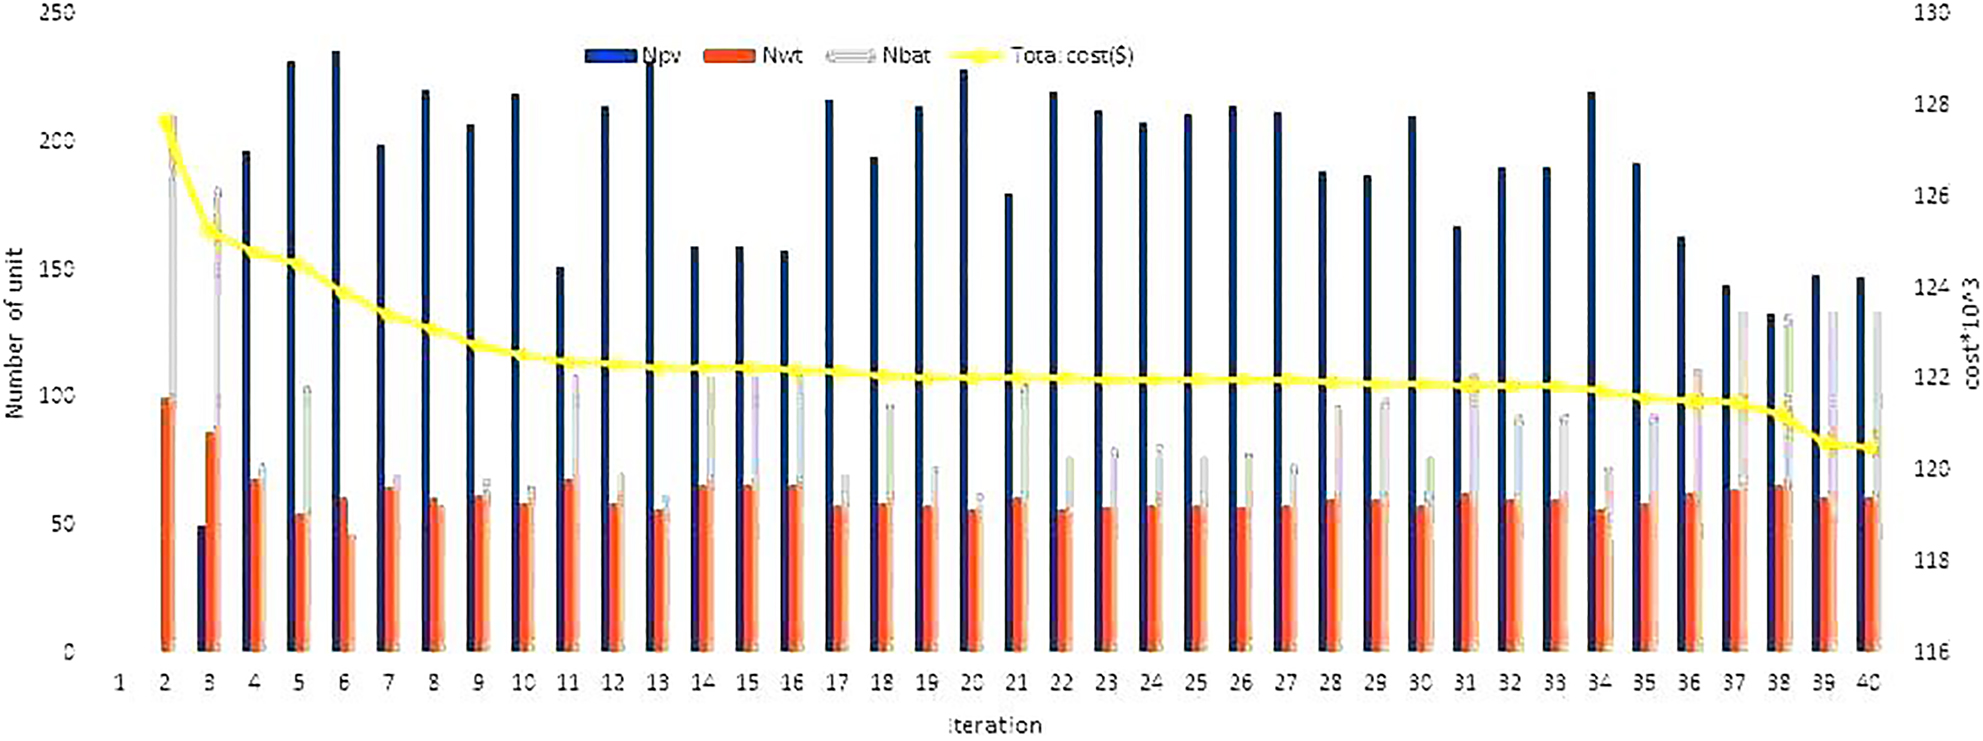
Variation of total costs for ideal case results.
Practical system
The number of PV panels, wind turbines and storage batteries obtained through PSO for the practical case are 215, 55 and 182, respectively. The variation of costs with respect to number of PV panels, wind turbines and battery packs for 40 iterations of PSO is shown in Figure 7 in a sorted order. The optimal COE for the system is obtained as 0.11025 $/kWh in this case. Similar to the Ideal case, the total energy available through renewable resources and batteries against the demand of the day is given in Figure 8b. In the practical case, the battery discharge is more for the first load peak and lesser for the second peak as compared to the ideal case.
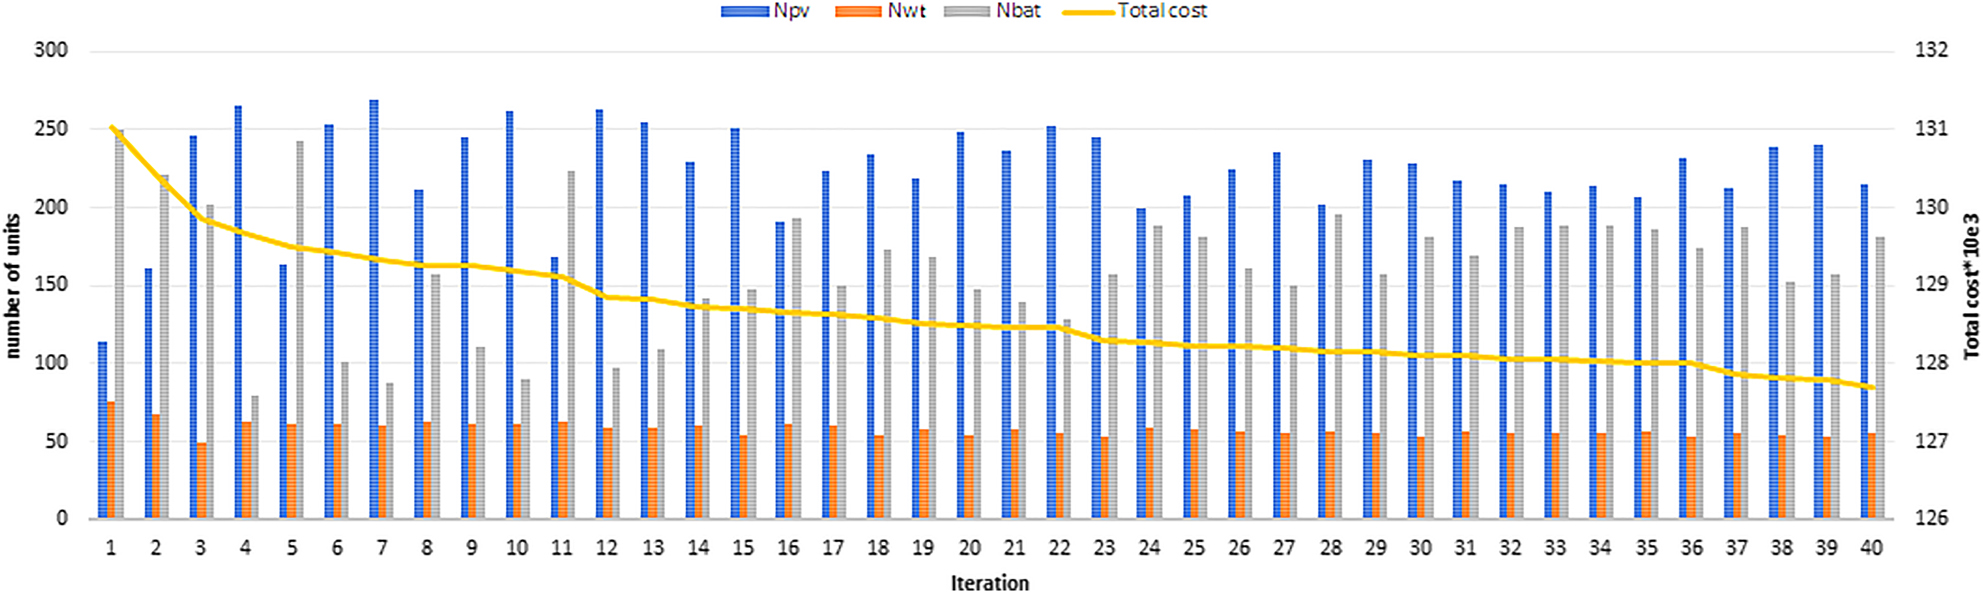
Variation of total costs for practical case results. (a) Power demand and supply characteristic for ideal case. (b) Power demand and supply characteristic for practical case.
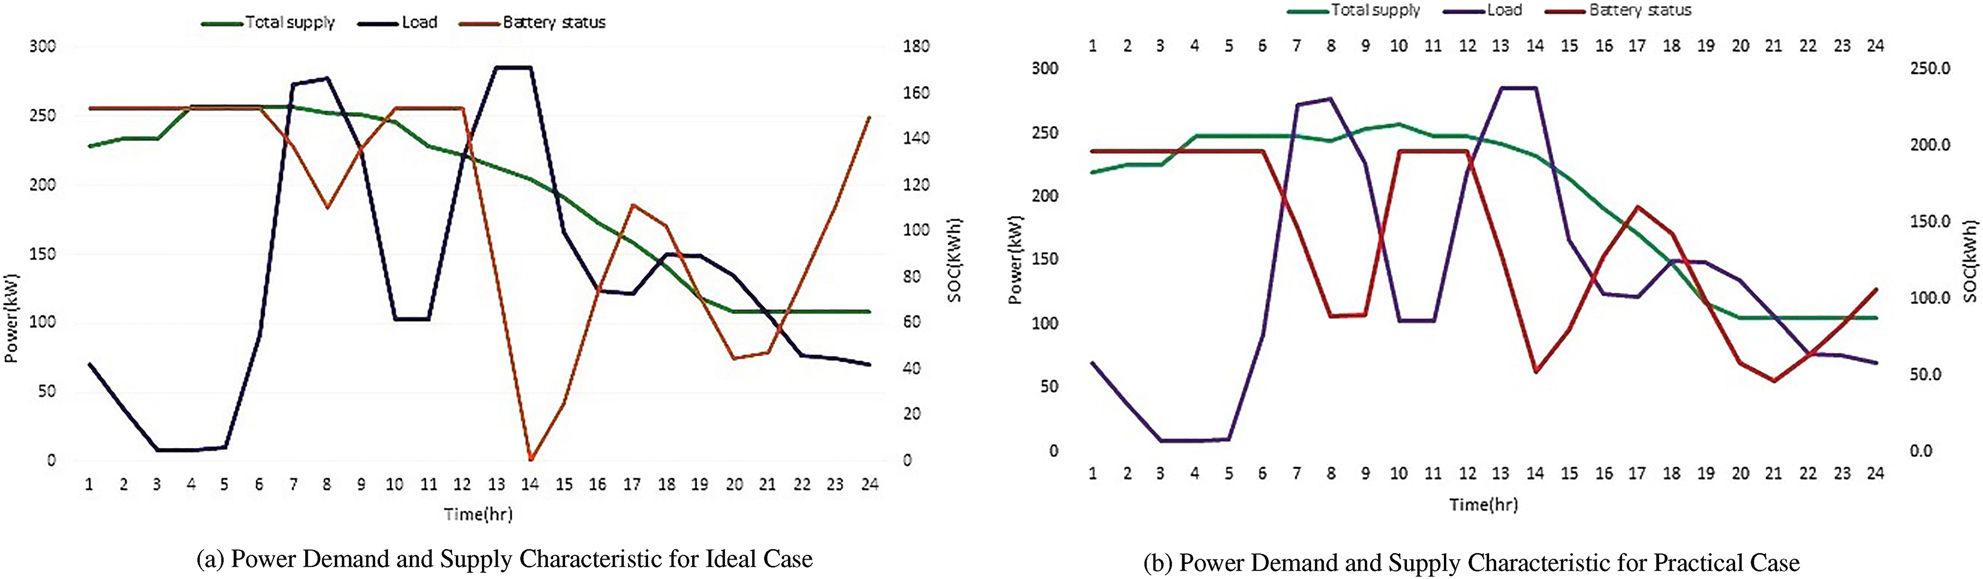
Comparison of energy and demand in different cases.
The optimal results are summarized in Table 4, for both the cases. In the table, NPV is the number of PV panels, NWT is the number of wind turbines and NBAT is the number of battery packs. The objective function is minimized while considering all constraints. The combination of RES and battery packs is so formed that the value of LPSP is 0. Thus, the reliability of the system is also satisfied with no scarcity of supply.
Optimal results for different cases.
| Cases | NPV | NWT | NBAT | Converter | COE ($/kWh) | LPSP |
|---|---|---|---|---|---|---|
| Ideal | 164 | 57 | 128 | 1 | 0.10368 | 0 |
| Practical | 215 | 55 | 182 | 1 | 0.11025 | 0 |
The COE for grid extension at Jarre village is found to be 0.362 $/kWh whereas the cost of installing a standalone system is 0.10368 $/kWh for ideal battery operating conditions and 0.11025 $/kWh for practical conditions.
Another method to compare the feasibility of the off-grid power supply system for the site, with respect to grid extension is through BED. BED is considered by taking present cost of stand alone system and grid extension costs as listed in Tables 2 and 3. As shown in Figure 9, BED is found to be 31.6 km. As the village is at a more distance from the grid, application of off-grid power supply system is more feasible for the selected site.
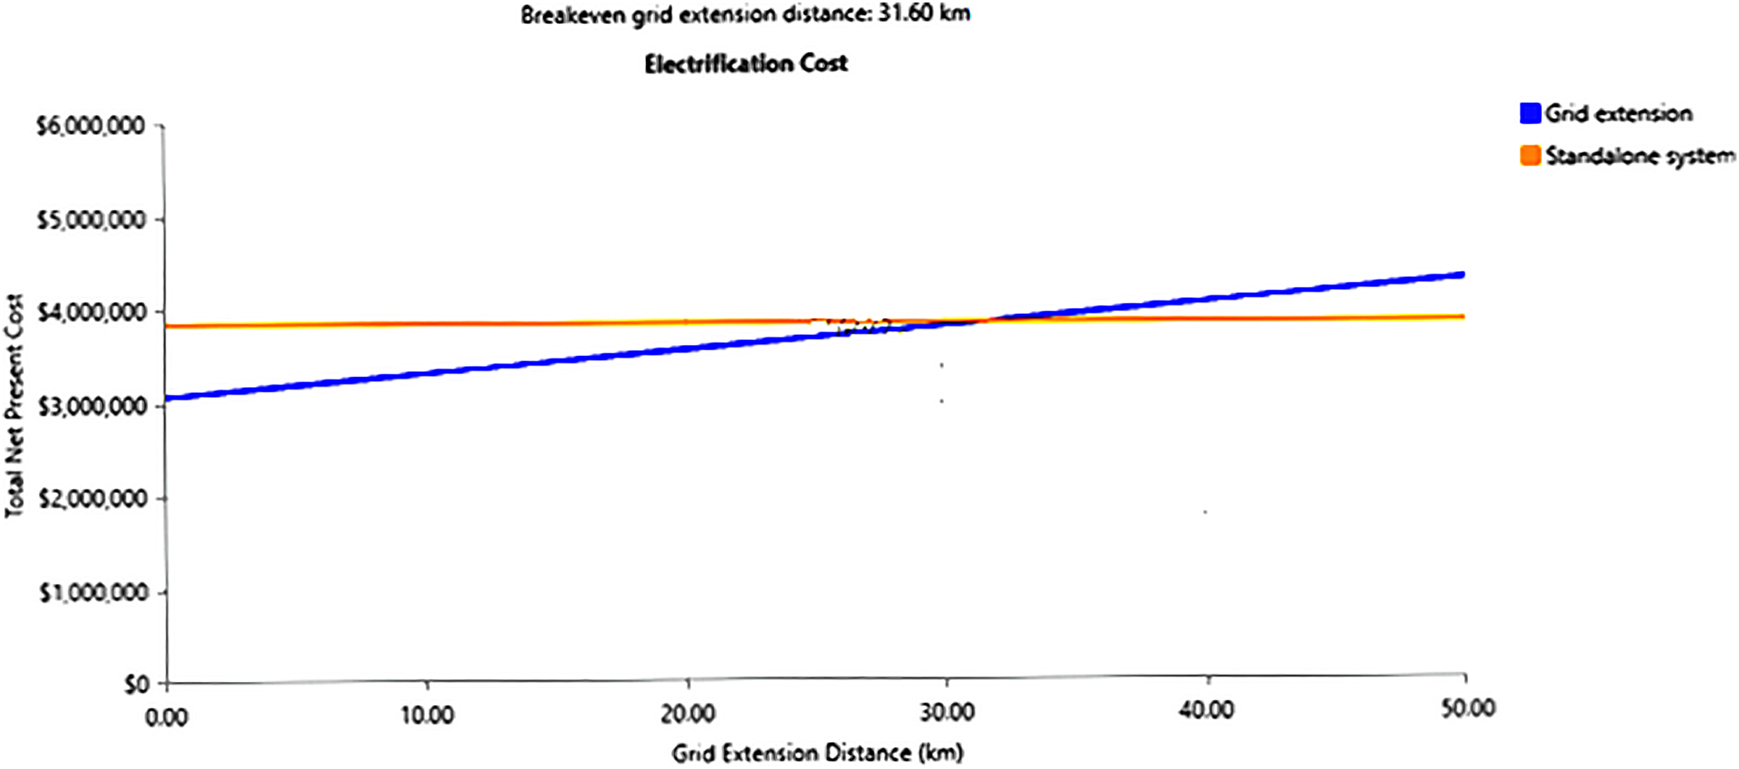
Grid extension cost for break even distance analysis.
Conclusions
A feasibility study is performed for the electricity supply to a remote village of Jarre in Ethiopia. The village has a lower level of load but has a high availability of RES. A comparison of grid extension and standalone MG system is performed. Optimal combination of RES combined with battery packs is found to be more economical than extension of grid. It can be observed that standalone system installation costs is 69.5–71.3% lesser than grid extension costs. While considering the off grid system, reliability and economic cost are considered as the objectives. BED is also analysed for the village based on its distance from the nearest substation. Standalone system is found to be far more economical as compared to the option of grid extension. PSO has been implemented for obtaining the optimal combination of RES and battery units.
-
Author contributions: All the authors have accepted responsibility for the entire content of this submitted manuscript and approved submission.
-
Research funding: None declared.
-
Conflict of interest statement: The authors declare no conflicts of interest regarding this article.
References
Ali, L., S. M. Muyeen, H. Bizhani, and A. Ghosh. 2020. “Comparative Study on Game-Theoretic Optimum Sizing and Economical Analysis of a Networked Microgrid.” Energies 12 (20): 4004.10.3390/en12204004Suche in Google Scholar
Al-Sakkaf, S., M. Kassas, M. Khalid, and M. A. Abido. 2019. “An Energy Management System for Residential Autonomous DC Microgrid Using Optimized Fuzzy Logic Controller Considering Economic Dispatch.” Energies 12 (8): 1457.10.3390/en12081457Suche in Google Scholar
Al-Nujaimi, A., M. Abido, and M. Al-Muhaini. 2018. “Distribution Power System Reliability Assessment Considering Cold Load Pickup Events.” IEEE Transactions on Power Systems 33 (4): 4197–206.10.1109/TPWRS.2018.2791807Suche in Google Scholar
IEA. 2019. Ethiopia Electricity Access Solutions by Type in the Africa Case. Also available at https://www.iea.org/articles/ethiopia-energy-outlook.Suche in Google Scholar
Azimoh, C. L., P. Klintenberg, F. Wallin, B. Karlsson, and C. Mbohwa. 2016. “Electricity for Development: Mini-Grid Solution for Rural Electrification in South Africa.” Energy Conversion and Management 110: 268–77.10.1016/j.enconman.2015.12.015Suche in Google Scholar
Alharthi, Y. Z., M. K. Siddiki, and G. M. Chaudhry. 2018. “Economic Analysis and Environmental Impacts of a Hybrid PV System in Arid Climate Considering Different Types of Solar Trackers.” Smart Grid and Renewable Energy 9 (10): 199.10.4236/sgre.2018.910013Suche in Google Scholar
Badar, A. Q., B. Umre, and A. Junghare. 2012. “Reactive Power Control Using Dynamic Particle Swarm Optimization for Real Power Loss Minimization.” International Journal of Electrical Power & Energy Systems 41 (1): 133–6.10.1016/j.ijepes.2012.03.030Suche in Google Scholar
Ding, Z., H. Hou, G. Yu, E. Hu, L. Duan, and J. Zhao. 2019. “Performance Analysis of a Wind-Solar Hybrid Power Generation System.” Energy Conversion and Management 181: 223–34.10.1016/j.enconman.2018.11.080Suche in Google Scholar
Donnou, H. E., A. B. Akpo, C. A. Kouchadé, B. B. Kounouhewa, G. H. Houngue, G. F. Nonfodji, and J. Djossou. 2019. “Vertical Profile of Wind Diurnal Cycle in the Surface Boundary Layer over the Coast of Cotonou, Benin, under a Convective Atmosphere.” Advances in Meteorology 2019: 1–18, https://doi.org/10.1155/2019/753082.Suche in Google Scholar
R. energy. 2020. “Wind Turbine Technology.” Also available at https://www.ryse.energy/10kw-wind-turbines/.Suche in Google Scholar
Ghenai, C., T. Salameh, and A. Merabet. 2020. “Technico-economic Analysis of off Grid Solar PV/Fuel Cell Energy System for Residential Community in Desert Region.” International Journal of Hydrogen Energy 45 (20): 11460–70.10.1016/j.ijhydene.2018.05.110Suche in Google Scholar
Gebrehiwot, K., M. A. H. Mondal, C. Ringler, and A. G. Gebremeskel. 2019. “Optimization and Cost-Benefit Assessment of Hybrid Power Systems for Off-Grid Rural Electrification in Ethiopia.” Energy 177: 234–46.10.1016/j.energy.2019.04.095Suche in Google Scholar
Ghorbani, N., A. Kasaeian, A. Toopshekan, L. Bahrami, and A. Maghami. 2018. “Optimizing a Hybrid Wind-PV-Battery System Using GA-PSO and MOPSO for Reducing Cost and Increasing Reliability.” Energy 154: 581–91.10.1016/j.energy.2017.12.057Suche in Google Scholar
Jakhrani, A. Q., A.-K. Othman, A. R. H. Rigit, S. R. Samo, and S. A. Kamboh. 2012. “A Novel Analytical Model for Optimal Sizing of Standalone Photovoltaic Systems.” Energy 46 (1): 675–82.10.1016/j.energy.2012.05.020Suche in Google Scholar
Kumar, S., K. K. Mandal, and N. Chakraborty. 2019. “A Novel Opposition-Based Tuned-Chaotic Differential Evolution Technique for Techno-Economic Analysis by Optimal Placement of Distributed Generation.” Engineering Optimization: 1–22.10.1080/0305215X.2019.1585832Suche in Google Scholar
Kennedy, J., and R. Eberhart. 1995. “Particle Swarm Optimization.” In Proceedings of ICNN’95-International Conference on Neural Networks, Vol. 4, 1942–8. IEEE.10.1109/ICNN.1995.488968Suche in Google Scholar
Le, T.-H., Y. Chang, and D. Park. 2020. “Renewable and Nonrenewable Energy Consumption, Economic Growth, and Emissions: International Evidence.” Energy Journal 41 (2).10.5547/01956574.41.2.thleSuche in Google Scholar
Longe, O., N. Rao, F. Omowole, A. Oluwalami, and O. Oni. 2017. “A Case Study on Off-Grid Microgrid for Universal Electricity Access in the Eastern Cape of South Africa.” International Journal of Energy Engineering 7 (2): 55–63.Suche in Google Scholar
D. H. louis. “Why the Power Grid Is Not Any Where?” Also available at https://energypedia.info/wiki/Grid␣Extension␣vs␣OffΩgrid,Island/␣Isolated␣System.Suche in Google Scholar
Louw, K., B. Conradie, M. Howells, and M. Dekenah. 2008. “Determinants of Electricity Demand for Newly Electrified Low-Income African Households.” Energy Policy 36 (8): 2812–8.10.1016/j.enpol.2008.02.032Suche in Google Scholar
Maleki, A., M. Ameri, and F. Keynia. 2015. “Scrutiny of Multifarious Particle Swarm Optimization for Finding the Optimal Size of a PV/Wind/Battery Hybrid System.” Renewable Energy 80: 552–63.10.1016/j.renene.2015.02.045Suche in Google Scholar
Ma, T., and M. S. Javed. 2019. “Integrated Sizing of Hybrid PV-Wind-Battery System for Remote Island Considering the Saturation of Each Renewable Energy Resource.” Energy Conversion and Management 182: 178–90.10.1016/j.enconman.2018.12.059Suche in Google Scholar
Nagapurkar, P., and J. D. Smith. 2019. “Techno-economic Optimization and Environmental Life Cycle Assessment (LCA) of Microgrids Located in the US Using Genetic Algorithm.” Energy Conversion and Management 181: 272–91.10.1016/j.enconman.2018.11.072Suche in Google Scholar
Nekkache, A., B. Bouzidi, A. Kaabeche, and Y. Bakelli. 2018. “Hybrid PV-Wind Based Water Pumping System Optimum Sizing: A PSO-LLP-LPSP Optimization and Cost Analysis.” In 2018 International Conference on Electrical Sciences and Technologies in Maghreb (CISTEM), 1–6. IEEE.10.1109/CISTEM.2018.8613606Suche in Google Scholar
Prasad, C. H., K. Subbaramaiah, and P. Sujatha. 2019. “Cost–Benefit Analysis for Optimal DG Placement in Distribution Systems by Using Techno-economic Optimization and Environmental Life Cycle Assessment (LCA) of Microgrids Located in the US Using Genetic Algorithm Elephant Herding Optimization Algorithm.” Renewables: Wind, Water, and Solar 6 (1): 2.10.1186/s40807-019-0056-9Suche in Google Scholar
Pakkiraiah, B., and G. D. Sukumar. 2016. “A New Modified Artificial Neural Network Based MPPT Controller for the Improved Performance of an Asynchronous Motor Drive.” Indian Journal of Science and Technology 9 (45): 1–10.10.17485/ijst/2016/v9i45/105313Suche in Google Scholar
Ravanbakhshian, M., and A. Amindoust. 2020. “Developing a Mathematical Model of Location Decision Optimization for Solar Cells Using Genetic Algorithm.” Energy Sources, Part A: Recovery, Utilization, and Environmental Effects 42 (5): 521–35.10.1017/9781108783453.011Suche in Google Scholar
Russell, B. 2020. “Renewables Have Won, the Citizen’s Guide to Climate Success: Overcoming Myths that Hinder Progress.” 200.10.1080/15567036.2019.1587096Suche in Google Scholar
Raj, A., M.-T. F. Rodrigues, and D. P. Abraham. 2020. “Rate-dependent Aging Resulting from Fast Charging of Li-Ion Cells.” Journal of the Electrochemical Society 167 (12): 120517, https://doi.org/10.1149/1945-7111/abace9.Suche in Google Scholar
Shayeteh, F., and R. K. Moghaddam. 2020. “Optimization of Kalagh Ashian’s Photovoltaic Water Pump System Using a New Proposed Multi-Objective Firefly Algorithm.” Journal of Control, Automation and Electrical Systems 31 (3): 648–64.10.1007/s40313-020-00570-3Suche in Google Scholar
Sawle, Y., S. Gupta, and A. K. Bohre. 2018. “Techno-economic Scrutiny of HRES through GA and PSO Technique.” International Journal of Renewable Energy Technology 9 (1–2): 84–107.10.1504/IJRET.2018.090106Suche in Google Scholar
Sawle, Y., S. Gupta, and A. K. Bohre. 2018. “Socio-techno-economic Design of Hybrid Renewable Energy System Using Optimization Techniques.” Renewable Energy 119: 459–72.10.1016/j.renene.2017.11.058Suche in Google Scholar
Samani, A. E., J. D. De Kooning, N. Kayedpour, N. Singh, and L. Vandevelde. 2020. “The Impact of Pitch-To-Stall and Pitch-To-Feather Control on the Structural Loads and the Pitch Mechanism of a Wind Turbine.” Energies 13 (17): 4503.10.3390/en13174503Suche in Google Scholar
Salman, U. T., F. S. Al-Ismail, and M. Khalid. 2020. “Optimal Sizing of Battery Energy Storage for Grid-Connected and Isolated Wind-Penetrated Microgrid.” IEEE Access 8: 91129–38, https://doi.org/10.1109/ACCESS.2020.2992654.Suche in Google Scholar
Timilsina, Govinda R. 2020. “Demystifying the Costs of Electricity Generation Technologies; World Bank, Washington, DC. © World Bank.” Policy Research Working Paper (9303), https://openknowledge.worldbank.org/handle/10986/34018.10.1596/1813-9450-9303Suche in Google Scholar
Ucar, A., and F. Balo. 2009. “Evaluation of Wind Energy Potential and Electricity Generation at Six Locations in turkey.” Applied Energy 86 (10): 1864–72.10.1016/j.apenergy.2008.12.016Suche in Google Scholar
Walker, M. “Why We Created Homer Grid: Understanding the Differences between Homer Grid and Homer Pro.” Also available at https://microgridnews.com/homer-grid-vs-homer-pro.Suche in Google Scholar
Wei Tong, U., and Kollmorgen Corp. 2010. Wind Power Generation and Wind Power Generation and Wind Turbine Design Wind Turbine Design. WIT Press.Suche in Google Scholar
World Weather Online. 2021. Also available at https://www.worldweatheronline.com.Suche in Google Scholar
Zhu, W., J. Guo, and G. Zhao. 2021. “Multi-objective Sizing Optimization of Hybrid Renewable Energy Microgrid in a Stand-Alone Marine Context.” Electronics 10 (2).10.3390/electronics10020174Suche in Google Scholar
© 2021 Walter de Gruyter GmbH, Berlin/Boston
Artikel in diesem Heft
- Frontmatter
- Research Articles
- Optimized routing with efficient energy transmission using Seline Trustworthy optimization for waste management in the smart cities
- Effectiveness of line type and cross type piezoelectric patches on active vibration control of a flexible rectangular plate
- Energy visibility of a modeled photovoltaic/diesel generator set connected to the grid
- Techno-economic analysis and design of hybrid renewable energy microgrid for rural electrification
- The comparison of triboelectric power generated by electron-donating polymers KAPTON and PDMS in contact with PET polymer
- Investigation of aerodynamic interaction between the balloon and the ducted wind turbine in airborne configuration
- Experimental investigation on treated transformer oil (TTO) and its diesel blends in the diesel engine
- Frequency response locking of electromagnetic vibration-based energy harvesters using a switch with tuned duty cycle
- Evaluation of energy generation in Iraqi territory by solar photovoltaic power plants with a capacity of 20 MW
- Review
- Quantitative analysis of DC–DC converter models: a statistical perspective based on solar photovoltaic power storage