
Energy visibility of a modeled photovoltaic/diesel generator set connected to the grid
-
Majid K. Abbas
 ,
Marek Jaszczur
,
Marek Jaszczur

Abstract
The paper presents a technical and economic analysis for two energy systems (conventional and renewable) with grid connection. The investigation was carried out using an experimental measurement for the desired load and weather data (solar irradiance and ambient temperature), were 5.1 kWh the daily energy consumption as measured and 4.6 kWh/m2/day the annual average of the solar irradiance. The simulation process was done by using MATLAB and HOMER software at a 1 min time step resolution. The economic optimization objective presented for two energy system scenarios (i) photovoltaic/grid and (ii) diesel/grid, takes into account the economic aspects and component prices based on the Iraqi market and regulations. The diesel generator, very popular in rural areas, is designed to work during the same period as the photovoltaic system (only during day hours). The yearly operating hours were recorded at 4380 h/year, and energy generation was approx. 2349 kWh/year while fuel consumption was 1826 L/year. The results showed that the photovoltaic system in scenario (i) can generate about 7895 kWh, and for the diesel generator in scenario (ii), it can generate approximately 2346 kWh. Furthermore, for scenario (i) the levelized net present cost is $1079 and the cost of energy is about $0.035/kWh, while for scenario (ii) the levelized net present cost is $12,287 and the cost of energy is $0.598/kWh. The use of solar energy is highly recommended compared to diesel generators due to the lowest cost and delivery of energy to the grid. Furthermore, it can capture carbon dioxide by about 5295 kg/year.
Introduction
Renewable energy is energy generated from natural resources that do not run out and are constantly renewed, such as wind, water and solar radiation etc. Renewable energy generally does not generate waste like the burning of fossil fuels, which are harmful to the environment and lead to increased global warming as well as generating carbon dioxide (CO2) (Jaszczur et al. 2020). Solar energy is the most promising source among renewable energy resources, because of its availability on most of the earth’s sites. Photovoltaic (PV) systems generate electricity from solar energy and feed the desired load as well as support the national grid system during the daytime and periods of high solar radiation (Styszko et al. 2019). Many applications are conducted to use solar energy and can reduce energy taken from the grid or from generators by decreasing the consumption of diesel or gasoline by generators.
In the literature, several research studies can be found analyzing PV power systems for different purposes and applications. A renewable energy PV system designed and optimized to supply a load for a typical flat in Poland was investigated by Ceran et al. (2017). The authors used experimental load and weather data to set up a system size and found that the presented approach is effective, which can meet the electrical load and reduce annual energy taken from the grid by about 66%. Palej et al. (2019), the optimized renewable energy system consists of the photovoltaic system with two objectives (environmental and economic). The results clearly showed the use of an economic objective system with the lowest net present cost and high CO2 emissions, while a system with the highest net present cost and the lowest CO2 emissions was also clearly shown. Hassan (2021) designed an optimized PV system in two scenarios, on/grid and off/grid, for micro energy systems applications in Iraq. The study was carried out using experimental electrical load and weather data (solar irradiance, ambient temperature, and wind speed) to supply renewable energy to a typical household in Iraq. The author uses MATLAB as a simulation and optimization tool to obtain the optimum system capacity that can meet the desired load. For the daily electrical energy consumption of about 7.1 kWh, the author investigated different PV system capacities between 2.275 and 5.98 kWp. The results showed that the selected design can meet the desired load and feed the grid with the excess energy in on/grid scenarios. Furthermore, the author tested the economic visibility for both scenarios and conditioned the off/grid PV system to be more expensive than the on/grid PV system; for off/grid, the total cost is $6244, and the cost of energy is $0.19/kWh, while for on/grid, the total cost is $6115, and the cost of energy is $0.18/kWh.
Abdulateef (2014) investigated the feasibility of designing an off-grid/solar PV system to supply electrical energy to a residential unit in Malaysia. The study aimed to design a system that could meet daily energy consumption of 35 kWh. The simulation process is carried out using MATLAB at a 1 h resolution. The results showed that the optimal capacity for the PV system is 11 kWp with 23.6 kWh batteries that can supply 38 kWh per day based on the intensity of solar radiation intensity in the selected site. Huang et al. (2019) evaluated a numerical method for designing an off-grid/off-grid photovoltaic system with daily energy consumption of 15 kWh for a rural site. The method used for sizing the system included three steps: the first, a mathematical model for PV/battery; the second step, designing the energy management strategy with a priority to feed the electrical load (load following strategy); the power management strategy was set for the protection of system components; and the third step, establishing the optimization model with MATLAB Simulink. The results demonstrate that the designed system is highly reliable to feed the desired energy. Riza, Gilani, and Aris (2015) investigated the optimization of an off-grid photovoltaic system with the storage batteries used to feed the night lighting system. The authors used an economic optimization objective with two dispatch strategies: load following and cycle charging. The presented results showed that the cycle charging strategy is more effective than a load-following strategy for such a system, because the electrical load profile depends on the energy stored by the batter (working only during the night), while during the day, about 90% of the energy generated by the PV component is used to charge the batteries. Olcan (2015) optimized the off-grid/grid PV system with batteries used to supply energy to the water pumping system. The author used techno-economic optimization for sizing system components. The results demonstrated that the techno-economic optimization objective is more reliable than the genetic algorithm. Li et al. (2021) optimized an off-grid PV/battery system consisting of 115 kW of photovoltaic units and 80 battery units (200 A–24 V/unit) to supply power to feed residential buildings in China. The presented study evaluates the capacity of the system capacity at three optimization objectives (technical, economic, and environmental). In this investigation, the authors focused on using solar energy to develop green buildings in the future. The results demonstrated the suggested system is the most economical at a total cost of about $28,041 and an energy cost of 0.069 $/kWh, whereas it can capture 26,609 kg/yr of CO2 compared with Chinese conventional energy.
Puranen, Kosonen, and Ahola (2021) investigated the technical feasibility of a grid-based photovoltaic system for a single-family house in Finland’s northern climates. The authors tested two storage systems: a battery and a fuel cell with hydrogen energy storage. The investigated PV system was considered on the roof of the building with a capacity of 21 kWp, which was combined for the first investigation with 20 kWh batteries and the second investigation with three fuel cell capacities of 4, 5, and 7 kW. The results showed that the use of a fuel cell as a storage unit is more effective than using batteries. Haffaf et al. (2021) measured, monitored, and simulated the performance of the 2.4 kWp photovoltaic system set up with grid connection in France. The simulation process was performed using three different software packages: PV Watts, PVGIS, and HOMER. The results showed the estimated energy produced by about 968.4, 3246.4, and 1382.7 kWh for the operating periods 2018 and 2020 operating periods, respectively. During the life span of the project (20 years), for the year 2018, the estimated energy that can be generated is approximately 5597.6 kWh and the avoidance of CO2 emissions is estimated at 4.17 tons. Guichi et al. (2021) evaluated the optimum control strategy for solar PV systems under conditions of partially shaded conditions. The authors used the supervisory controller to ensure that microgrid PV systems could rapidly and precisely deliver the amount of energy they needed to the grid. The converter control strategy is based on the combination of two algorithms: the intermediate power point tracker algorithm and particle swarm optimization algorithm. The results showed that the use of an intermediate power point tracker algorithm in the inverter provides rapid and high-efficiency control. Li et al. (2017) analyzed five solar tracking modes to evaluate the performance of an off-grid solar PV system used for a residential unit in China. The study compared the performance of the off-grid PV system with a capacity of 2.02 kWp PV capacity at five positioning strings: fixed tilt, seasonal tilt adjustment, vertical axis tracking system, horizontal axis tracking system, and two-axis tracking system. The results represented that the yearly maximum missing solar energy (134.68 kWh/yr) at the positioning of the tilt angle β = 25°, azimuth angle α = 0°, while for the two-axis tracking system is the maximum solar energy can be collected. The investigation found that the monthly average performance ratio for the fixed tilted (0.689) and minimal for the two-axis tracking system (0.596). Esfahani and Yoo (2016) used the Genetic Algorithm and pinch analysis to size an off-grid, battery less photovoltaic system for a water desalination system. The analysis was carried out based on multi-objective optimization (technical and economics), combining genetic algorithms and numerical tools to minimize three objective functions to minimize the total cost of the system in order to obtain the optimal number of membranes, photovoltaic modules, and size of the water storage tank. The results showed that the system cost $13,652 and could supply fresh water at 10 m3/day. Akinyele and Rayudu (2016) carried out a comprehensive technoeconomic analysis for an optimized off/grid small community PV system. The author’s used techno-economic analysis for sizing system can feed daily load by 175 kWh/d at 1% annual load growth in Nigeria. The results clearly showed the optimum with a PV power system capacity of 50–62.7 kWp, supplying energy of approximately 98.91–99.56% for a desired load with a low energy loss probability of 0.44–1.09%. Monjezi et al. (2020) optimized a small-scale off-grid PV system used to feed the reverse osmosis desalination system work in reverse osmosis in Egypt. The PV system was sized according to the capacity of the desalination system with 5 m3/day using experimental weather data (solar irradiance and ambient temperature) for one year. The simulation results show that the efficiency of the PV system decreases during the summer session and increases during the winter session due to the rising temperature of the PV cell. Furthermore, the modeled results illustrated that using a reverse osmosis method helps to reduce 0.12 kWh/m3 in electricity energy consumption and can help reduce 6% of the required solar panel area. Okundamiya (2021) sized optimized photovoltaic systems with hydrogen energy to satisfy the electrical load demand for the university laboratory connected to unreliable grid energy. The study aimed to shift the conventional grid energy system to a sustainable energy system. The design and optimization process were carried out using HOMER and adopted the energy balance strategy. The hourly simulation resolution was performed using a 22-year averaged solar irradiance at the selected site in Naejeria. The results clearly showed that the combination of a 54.7 kWp PV system, a 14 kW AC/DC inverter, a 7.0 kW fuel cell system with a 3.0 kW electrolyzer, and an 8 kg hydrogen storage tank can sustainably feed the electrical load at a high renewable energy fraction of 96.7% at a cost of $0.0418/kWh. Said et al. (2021) compared the performance of six main PV system configurations for the USA used for the domestic sector. In addition, the effect of the reduction of battery backup size from 24 to 12 h has been tested. The results demonstrated that the central grid PV system configuration was comparatively more efficient than the off-grid PV system, which was supported by technological and economic aspects and more environmentally friendly, reducing 229–237 tons of CO2 emissions.
Rodrigues et al. (2016) investigated the comparison of techno-economic feasibility for 1 and 5 kW PV systems in 13 countries for different scenarios in Europe. The results show that for the on/grid scenario, the 5 kWp PV system is the most profitable in Italy, and for the off/grid scenario, the 1 kWp is the most viable investment in Germany. Al-Waeli et al. (2017) investigated the environmental and economic feasibility of the off-grid/grid photovoltaic system used to feed the water pumping in the rural Omani regions of Oman. The simulation process conducted using HOMER software shows that the PV systems cost about 0.309 $/kWh, which is more economic than using diesel generation energy of 0.79 $/kWh. In addition, the use of photovoltaic systems is more sustainable than fossil fuel. Al Hania et al. (2011) evaluated an experimental study for an on-grid PV system with models made from thin-film amorphous silicon in the United Arab Emirates. The results showed that the short circuit current drops by 1.18%/°C and the open circuit voltage decreases by 0.065%/°C with increasing ambient temperature. In addition, accumulative dust is more likely to affect photovoltaic performance than ambient temperature. Touati, Al-Hitmi, and Bouchech (2013) evaluated an experimental study for two photovoltaic systems with technologies (monocrystalline and amorphous silicon) in a desert region. The results clearly showed that the performance of both technologies is more affected by accumulative dust than ambient temperature and relative humidity. Furthermore, the amorphous technology was found to be highly affected by the ambient temperature and relative humidity compared to the monocrystalline technology.
This paper demonstrated the visibility, for comparison, of the use of renewable energy (solar energy) and conventional energy (Diesel Generator [DG]) to feed the desired load for the Directorate of Engineering Works at Diyala Police Department. The modeled systems consisted of two scenarios: (i) scenario consisted of (PV/grid) and (ii) scenario consisted of (DG/grid) which was optimized using economical optimization. The energy price purchase/sell back with the economic aspects has been set based on the Iraqi market.
Suggested system description
The capacity of the PV system in scenario (i) was calculated at 4.28 kW and was constructed with a 5.5 kW converter. The setting of the energy strategy for the generated solar energy during the day is called (load following), whose priority is serving the desired load and delivering excess energy that can be delivered to the grid. During the simulation process, the tilt angle of the system’s tilt angle and azimuth angle were set according to the yearly optimum setting for Diyala, the azimuth angle (α = 0°) facing south and the tilt angle (β = 30°).
Scenario (ii) designed the 5.0 kW DG connected to the grid to serve the desired load, and the working hours have been scheduled for the same period of PV energy generated in scenario (i) (during day hours only), which does not send energy to the grid during the operation period. Both scenarios are optimized for the economic (low cost of energy) using an experimental measurement for the solar irradiance and desired load where the simulation process carried out by MATLAB and HOMER at (1°min) resolution, the economic aspects, and energy prices are taken based on the Iraqi regulations. Table 1 shows the specifications of the selected components, and Table 2 shows the economic aspects of the selected components.
PV system components specifications.
| PV module (LONGI) | |
| Type | LONGI (LR6-60OPG) |
| Max. power | 345 W |
| Tolerance | ±5 |
| Voltage at PMax (VMP) | 31.6 V |
| Current at PMax (IMP) | 10.92 A |
| Open circuit voltage (VOC) | 38.3 V |
| Short circuit current (ISO) | 11.72 A |
| Operating temperature | −40 to +85 °C |
| Temperature coefficient of power | −0.35%/°C |
| Module efficient | 19.7% |
| Solar inverter (Soropower) | |
| Type | REVO II 5.5 kW |
| Rate power | 5500 W |
| DC input | 48 VDC, 130 A |
| AC output | 54 VDC |
| Efficiency | 93.5% |
| Diesel generator (Caterpillar) | |
| Type | CAT |
| Capacity | 5 kW |
PV system components economic specifications.
| Component | Capital ($) | Replacement ($) | O&M | Life span |
|---|---|---|---|---|
| PV module | 110 | 100 | 10/yr | 20 yr |
| Solar inverter | 450 | 400 | 10/yr | 15 yr |
| Diesel generator | 2000 | 2000 | 0.05 ($/h) | 300,000 h |
Experimental data used
Charge demand
For the period of January 1, 2020 to December 31, 2020, experimental measurements of the electrical AC load for a selected office in Baqubah were conducted using a smart meter with a data transmitter. Two refrigerators with 1.6 kW, three computers with 0.26 kW each, a vacuum cleaner with 1.8 kW, copying equipment with 0.7 kW, two printers with 0.13 kW, five ceiling fans with 0.3 kW each, and LED lamps (with 8–20 W) are used for illumination. In 2020, the annual electricity consumption was 1884.94 kWh. The temporal load resolution is calculated as follows: (1 min). Figure 2 (a) and (b) show the monthly averaged electricity consumption for the full year and the daily power distribution for two chosen days. The results demonstrate that instantaneous power fluctuates greatly, varying more than 500% from the daily normal power of 250 W. In comparison to the annual average value, the monthly average energy consumption fluctuates by no more than 10% month to month.

Investigated system scenarios (i) PV/grid and (ii) DG/grid.

Electrical power for two selected days (a) and monthly averaged energy consumption (b).
Solar radiation
Pyranometers on a horizontal plane recorded global solar radiation for the city of Baqubah at latitude and longitude (33.7733° N, 45.1495° E). The experimental data for Figure 3 (a) and (b) were acquired from the Iraqi Meteorological Organization and Seismology (IMOS) at 5 min resolution for the period January 1, 2020 to December 31, 2020. The results show that the monthly averaged solar radiation and daily solar radiation distribution vary significantly by month.

Incident solar radiation for selected days (a) and monthly averaged (b).
Mathematical modeling
Power of photovoltaic
The electric power generated by a PV system is highly dependent on the total solar radiation that is incident on the PV modules. The power output from the PV system in this work is based on local experimental measurement of solar radiation calculated according to the following equation (Hassan et al. 2016):
where CPV is the rated capacity of the PV array (kW), Πς denotes the PV derating factor (%), GT,t is incident solar radiation (kW/m2), GT,STC is incident solar radiation (kW/m2) standard temperature conditions (STC), αp denotes the PV cell temperature coefficient of power (%/°C) taken – 0.35%/°C in this work (LONGI), TC,t is the temperature of the PV module (°C) and TC,STC is the temperature of the PV module (°C) at STC.
To ensure the accuracy of the current computations, the impact of module temperature Tc on the PV power is evaluated.
Load balance equation
The simultaneous load balance equation for the PV/Grid system ensures that the electricity demand is satisfied at any time from the photovoltaic system or from the grid, according to the formulation:
Scenario (i).
where PLoad,t is the instantaneous electrical load (kW), PFromthe grid, t is the instantaneous power taken from the grid (kW), PPV,t is the instantaneous power generated by the photovoltaic system (kW), where t denotes instantaneous time.
The simultaneous load balance equation, which describes the power flows between the system components, is defined as follows:
Scenario (ii).
where PDG,t is the instantaneous power generated by DG (kW).
The simultaneous load balance equation, which describes the power flows between the system components, is defined as follows:
Cost of energy
The cost of energy (COE) is the average price of energy in $ (or another currency) per kilowatt-hour (kWh). This cost in energy systems is governed by a number of elements, including the original capital cost, the operation and maintenance expenses, the depreciation period, the amount of energy produced, and the possibility for a decreasing trend in equipment costs with increasing volumes (Hassan 2020; Jaszczur, Hassan, and Palej 2019). It is as follows for a system that is linked to the grid.
where Eprim,AC,DC denotes the principal AC & DC load serviced, Egrid,sales, denotes total grid sales and Cann,tot denotes the total annualized cost of the system, which includes the annualized costs of each system component as well as the overall yearly cost of the system.
Annualized costs of each system component
Include the initial capital cost of each component over the project’s lifetime. It can be calculated using the following equation (Abdulateef et al. 2021):
where: Rproj is the project lifetime, Ccap is the initial capital cost of the component, CRF() is the capital recovery factor calculated as follows (Jaszczur et al. 2021):
where N denotes the number of years and i denotes the real interest rate in percent.
where h is the nominal interest rate (the rate at which you could get a loan) and fe is the annual inflation rate.
Total net present cost
Total net present cost (NPC) of the system is the present value of all expenses spent over its life span, deducted from the present value of all revenue collected during that period. Capital expenses, replacement costs, operation and maintenance (O & M) costs, fuel costs, pollution fines, and the cost of buying electrical energy from the grid are included with these costs. Revenues are comprised of salvage value and grid sales. Calculate using the following formula (Jaszczur, Hassan, and Palej 2019):
Cost of operation and maintenance (O&M)
The cost of operation and maintenance (O&M) combines the system fixed operating costs and the cost of system maintenance.
C cs is a capacity shortfall penalty applied to the system for any capacity shortages that occur during the year, while Ecs is a total capacity shortage or yearly capacity shortage that occurred throughout the year.
Life cycle cost
The life cycle cost (LCC) of hybrid power systems is the overall cost incurred during the system’s productive life, including the original capital cost, installation cost, operation and maintenance cost, replacement cost, fuel cost, and salvage value. Generally, the superior system has a lower LCC (Ceran et al. 2021; Hassan et al. 2021; Jaszczur and Hassan 2020; Shaahid 2011; Shaahid and Elhadidy 2003; Shaahid et al. 2010; Shaahid, Al-Hadhrami, and Rahman 2014), which is computed as follows:
Results and discussion
The study was conducted using two optimization objectives: economic and technical. The analysis was conducted using the experimentally determined electrical load for a 1 min time step resolution and the proposed systems for scenarios (i) and (ii) (see Figure 1). The optimization method was implemented as a simulation of the system’s functioning, with all simulations including energy balance calculations. At each time step of the simulation, the outcomes compare the electric demand to the energy that the system can provide compute the energy flows from each system component. The results of these energy balance computations were analyzed for each system scenario. The design may then be evaluated to see whether it is acceptable.
The project has a 20-year life span, and the yearly discount rate is 6%, the annual inflation rate is 4%, and the interest nominal rate is 4%. Grid energy costs were calculated using Iraqi prices throughout the measurement period and were equivalent to 0.0.35 $/kWh for energy purchase and 0.11 $/kWh for energy selling. In (a) and (b), Figure 4 compares the power flow between two scenarios (i) and (ii) on the specified sunny day (01.06.2020). Figure 4(c) and (d) depict the energy flow comparison between two scenarios for the same day. In scenario (i) the extra energy created is intended to be used to power the grid. As depicted in Figure 4(a) and (c), the energy generated by the PV system increases as the sun rises and peaks at noon, before gradually decreasing until evening, when the expected energy generated by the 5.0 kW PV system for the selected day is approximately 35.05 kWh, the daily energy consumption is 4.45 kWh, the expected energy can be delivered to the grid at approximately 29.07 kWh, and the energy taken is approximately 4.45 kWh.
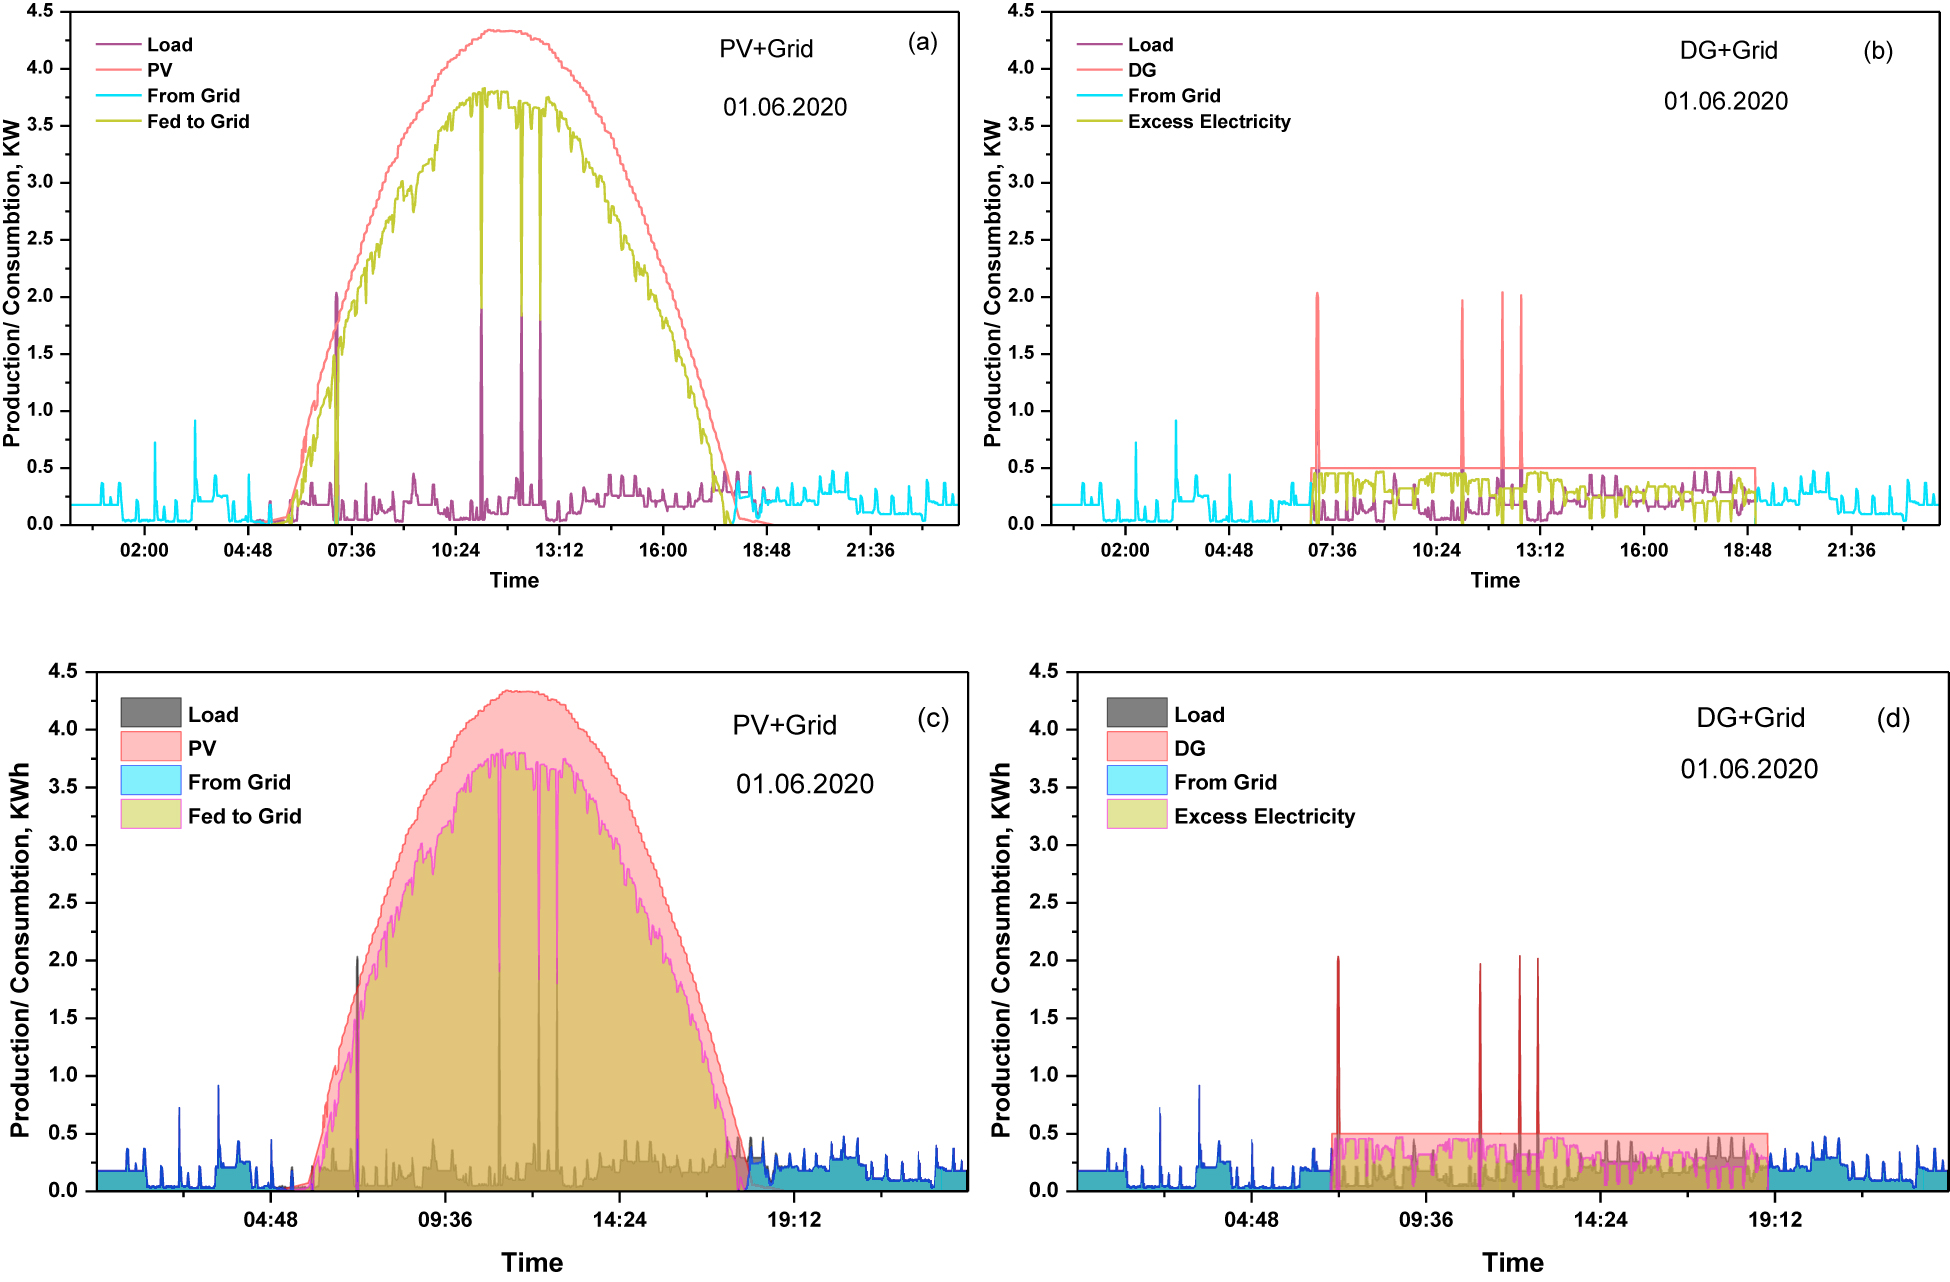
The power and energy flow distribution for the selected sunny day 01.06.2020.
Figure 4(b) and (d) show the distribution of the power and energy flow for the scenario (ii), where the DG is designed to work only for the same period as the PV system, and the set does not deliver energy to the grid. For the selected day of 10.06.2020, the expected energy generated by DG is approximately 6.21 kWh, the excess energy is approximately 3.74 kWh, and the energy taken from the grid is approximately 1.94 kWh (refer to Table 3).
Daily energy flow distribution in (kWh) for the selected sunny day 01.06.2020.
| Scenario | Load | PV | DG | From grid | Fed to grid | Excess energy |
|---|---|---|---|---|---|---|
| i | 4.45 | 35.05 | – | 1.98 | 29.07 | 0 |
| ii | 4.45 | – | 6.21 | 1.94 | – | 3.70 |
Figure 5 shows the comparison of the power flow between two scenarios (i) and (ii) for the selected partly cloudy day (02.05.2020) in (a) and (b), respectively. Figure 5(c) and (d) show the comparison of the energy flow between scenarios for the same day. For scenario (i), the excess of the energy generated is designed to feed the grid. It is very clear from Figure 4(a) and (c) that the energy generated by the PV system fluctuates due to the fluctuation of the solar irradiance, which is why the energy generated is less than a sunny day, which is expected to be approximately 23.05 kWh and the daily energy consumption is 4.89 kWh, the expected energy can be delivered to the grid at approximately 17.99 kWh and the energy taken from the grid during the night period is approximately 2.32 kWh (refer Table 4 and Figure 5(a)).

The power and energy flow distribution for the selected sunny day 02.05.2020.
Daily energy flow distribution in (kWh) for the selected cloudy day 02.05.2020.
| Scenario | Load | PV | DG | From grid | Fed to grid | Excess energy |
|---|---|---|---|---|---|---|
| i | 4.98 | 23.05 | – | 2.32 | 17.99 | – |
| ii | 5.89 | – | 6.58 | 1.94 | – | 3.50 |
Figure 5(b) and (d) show the distribution of the power and energy flow distribution for scenario (ii), where the DG is designed to work only for the same period as the PV system, and the set does not deliver energy to the grid. For the selected day of 02.05.2020, the expected energy generated by DG is approximately 6.58 kWh, the excess energy is approximately 3.5 kWh, and the energy taken from the grid is approximately 1.94 kWh (see Table 4).
Figure 6(a) and (b) show the monthly energy flow distribution for the scenario (i) Figure 6(a) and for scenario (ii) in Figure 6(b). For scenario (i), the lowest energy is generated by the PV system in winter months (January and December) and the highest energy is generated in summer months (July) (refer to Figure 6(a)). For scenario (ii), the energy generated by the DG system fluctuates from winter to summer, which depends on the energy consumption each month (refer Figure 6(b)).

Monthly energy flow distribution for two scenarios.
The yearly energy produced by each component is shown in Figure 7(a) and (b). The estimated energy produced by the PV system is approximately 7895 kWh, while the expected energy generated by the DG system is approximately 2346 kWh. In scenario (i) about 89% of the energy produced by the PV system feeds the required load, whereas in scenario (ii), approximately 75% of the energy generated by the DG system feeds the applied loads (refer to Figure 7(b)).

Annual energy flow distribution for two scenarios.
Figure 8(a) and (b) with Tables 5 and 6 show the annual cost for both scenarios. For scenario (i), the total annual cost of the system is approximately ($94) due to the profit of the energy feed to the grid of about ($235) (refer Table 5), while the annual cost for scenario (ii) is approximately ($1071) due to the cost of fuel, which is recorded at ($639) per year (refer Table 6), where the fuel prices are taken at $0.35/L.

The annual cost for two scenarios.
The PV/Grid system annual cost.
| Component | Capital ($/yr) | Replacement ($/yr) | O&M ($/yr) | Fuel ($/yr) | Salvage ($/yr) | Total ($/yr) |
|---|---|---|---|---|---|---|
| PV | −139 | 0 | −145 | 0 | 0 | −284 |
| Grid | 0 | 0 | 235 | 0 | 0 | 235 |
| Converter | −31 | −12 | −8 | 0 | 6 | −45 |
| System | −170 | −12 | 82 | 0 | 6 | −94 |
The DG/Grid system annual cost.
| Component | Capital ($/yr) | Replacement ($/yr) | O&M ($/yr) | Fuel ($/yr) | Salvage ($/yr) | Total ($/yr) |
|---|---|---|---|---|---|---|
| DG | −174 | −60 | −131 | −639 | 49 | −956 |
| Grid | 0 | 0 | −115 | 0 | 0 | −115 |
| System | −174 | −60 | −247 | −639 | 49 | −1071 |
Figure 9(a) and (b) with Tables 7 and 8 show the total NPC for both scenarios. For scenario (i), the total NPC of the system is approximately $1079 due to the profit of the energy feed to the grid (refer to Table 7), while the annual cost for scenario (ii) is approximately $1287 due to the cost of fuel (refer to Table 8).

The total NPC for two scenarios.
The PV/Grid system total NPC cost.
| Component | Capital ($) | Replacement ($) | O&M ($) | Fuel ($) | Salvage ($) | Total ($) |
|---|---|---|---|---|---|---|
| PV | −1594 | 0 | −1662 | 0 | 0 | −3257 |
| Grid | 0 | 0 | 2696 | 0 | 0 | 2696 |
| Converter | −360 | −134 | −92 | 0 | 67 | −519 |
| System | −1954 | −134 | −942 | 0 | 67 | −1080 |
The DG/Grid system total NPC.
| Component | Capital ($) | Replacement ($) | O&M ($) | Fuel ($) | Salvage ($) | Total ($) |
|---|---|---|---|---|---|---|
| DG | −2000 | −690 | −1507 | −7330 | 564 | −10,963 |
| Grid | 0 | 0 | 1324 | 0 | 0 | 1324 |
| System | −2000 | −690 | −2831 | −7330 | 564 | −12,287 |
Conclusions
In this research, we give a comparison of two energy systems that are connected to the grid. The evolution process is carried out with the use of experimental data on solar irradiance and electrical load. The simulation process is carried out with the help of MATLAB and HOMER at a time-step resolution of 1 min. On the basis of Iraqi market and regulatory conditions, the economic optimization aim is provided for two energy system scenarios (i) PV/grid and (ii) DG/grid, taking into consideration the economics and component prices.
The DG was designed to work during the same period as the PV system (only during day hours), where the yearly operating hours were recorded at 4380, which can produce 2349 kWh/year and consume 1826 letters/year. The results showed that the PV system in scenario (i) can generate approximately 7895 kWh of energy, and for DG in scenario (ii), it can generate approximately 2346 kWh of energy. Furthermore, scenario (i) levelized NPC ($1079) and COE ($0.035/kWh), while scenario (ii) levelized NPC ($12,287) and COE ($0.598/kWh) and the amount of pollution due to the fuel consumption described in Table 9 (Palej et al. 2019). The use of solar energy is highly recommended over DG due to the lowest cost and participation in grid energy support.
Pollutant due to fuel consumption in scenario (i).
| Pollutant | Emissions (kg/yr) |
|---|---|
| Carbon dioxide | 5295 |
| Carbon monoxide | 11.9 |
| Unburned hydrocarbons | 1.31 |
| Particulate matter | 0.895 |
| Sulfur dioxide | 11.8 |
| Nitrogen oxides | 107 |
-
Author contributions: All the authors have accepted responsibility for the entire content of this submitted manuscript and approved submission.
-
Research funding: None declared.
-
Conflict of interest statement: The authors declare no conflicts of interest regarding this article.
References
Abdulateef, A. M., M. Jaszczur, Q. Hassan, R. Anish, H. Niyas, K. Sopian, and J. Abdulateef. 2021. “Enhancing the Melting of Phase Change Material Using a Fins–Nanoparticle Combination in a Triplex Tube Heat Exchanger.” Journal of Energy Storage 35: 102227, https://doi.org/10.1016/j.est.2020.102227.Search in Google Scholar
Abdulateef, J. 2014. “Simulation of a Solar Off-Grid Photovoltaic System for a Residential Unit.” International Journal of sustainable and green Energy 4 (3): 29–33.Search in Google Scholar
Akinyele, D. O., and R. K. Rayudu. 2016. “Comprehensive Techno-Economic and Environmental Impact Study of a Localised Photovoltaic Power System (PPS) for Off-Grid Communities.” Energy Conversion and Management 124: 266–79, https://doi.org/10.1016/j.enconman.2016.07.022.Search in Google Scholar
Al Hanai, T., R. B. Hashim, L. El Chaar, and L. A. Lamont. 2011. “Environmental Effects on a Grid-Connected 900 W Photovoltaic Thin-Film Amorphous Silicon System.” Renewable Energy 36 (10): 2615–22, https://doi.org/10.1016/j.renene.2010.06.010.Search in Google Scholar
Al-Waeli, A. H., A. H. Al-Kabi, A. Al-Mamari, H. A. Kazem, and M. T. Chaichan. 2017. “Evaluation of the Economic and Environmental Aspects of Using a Photovoltaic Water Pumping System.” In 9th International Conference on Robotic, Vision, Signal Processing and Power Applications, 715–23. Singapore: Springer.10.1007/978-981-10-1721-6_78Search in Google Scholar
Caterpillar. Diesel Generator. Also available at https://www.cat.com/.Search in Google Scholar
Ceran, B., Q. Hassan, M. Jaszczur, and K. Sroka. 2017. “An Analysis of Hybrid Power Generation Systems for a Residential Load.” In E3S Web of Conferences, Vol. 14, 01020. EDP Sciences. https://doi.org/10.1051/e3sconf/20171401020.Search in Google Scholar
Ceran, B., A. Mielcarek, Q. Hassan, J. Teneta, and M. Jaszczur. 2021. “Aging Effects on Modelling and Operation of a Photovoltaic System with Hydrogen Storage.” Applied Energy 297: 117161, https://doi.org/10.1016/j.apenergy.2021.117161.Search in Google Scholar
Esfahani, I. J., and C. Yoo. 2016. “An Optimization Algorithm-Based Pinch Analysis and GA for an Off-Grid Batteryless Photovoltaic-Powered Reverse Osmosis Desalination System.” Renewable Energy 91: 233–48, https://doi.org/10.1016/j.renene.2016.01.049.Search in Google Scholar
Guichi, A., S. Mekhilef, E. M. Berkouk, and A. Talha. 2021. “Optimal Control of Grid-Connected Microgrid PV-Based Source Under Partially Shaded Conditions.” Energy 230: 120649, https://doi.org/10.1016/j.energy.2021.120649.Search in Google Scholar
Haffaf, A., F. Lakdja, D. O. Abdeslam, and R. Meziane. 2021. “Monitoring, Measured and Simulated Performance Analysis of a 2.4 kWp Grid-Connected PV System Installed on the Mulhouse Campus, France.” Energy for Sustainable Development 62: 44–55, https://doi.org/10.1016/j.esd.2021.03.006.Search in Google Scholar
Hassan, Q. 2020. “Optimisation of Solar-Hydrogen Power System for Household Applications.” International Journal of Hydrogen Energy 45 (58): 33111–27, https://doi.org/10.1016/j.ijhydene.2020.09.103.Search in Google Scholar
Hassan, Q. 2021. “Evaluation and Optimization of Off-Grid and On-Grid Photovoltaic Power System for Typical Household Electrification.” Renewable Energy 164: 375–90, https://doi.org/10.1016/j.renene.2020.09.008.Search in Google Scholar
Hassan, Q., M. K. Abbas, A. M. Abdulateef, J. Abulateef, and A. Mohamad. 2021. “Assessment the Potential Solar Energy with the Models for Optimum Tilt Angles of Maximum Solar Irradiance for Iraq.” Case Studies in Chemical and Environmental Engineering 4: 100140, doi:https://doi.org/10.1016/j.cscee.2021.100140.Search in Google Scholar
Hassan, Q., M. Jaszczur, E. Przenzak, and J. Abdulateef. 2016. “The PV Cell Temperature Effect on the Energy Production and Module Efficiency.” Contemporary Problems of Power Engineering and Environmental Protection 33.Search in Google Scholar
Huang, Z., Z. Xie, C. Zhang, S. H. Chan, J. Milewski, Y. Xie, Y. Yang, and X. Hu. 2019. “Modelling and Multi-Objective Optimization of a Stand-Alone PV-Hydrogen-Retired EV Battery Hybrid Energy System.” Energy Conversion and Management 181: 80–92, https://doi.org/10.1016/j.enconman.2018.11.079.Search in Google Scholar
Jaszczur, M., and Q. Hassan. 2020. “An Optimisation and Sizing of Photovoltaic System with Supercapacitor for Improving Self-Consumption.” Applied Energy 279: 115776, https://doi.org/10.1016/j.apenergy.2020.115776.Search in Google Scholar
Jaszczur, M., Q. Hassan, A. M. Abdulateef, and J. Abdulateef. 2021. “Assessing the Temporal Load Resolution Effect on the Photovoltaic Energy Flows and Self-Consumption.” Renewable Energy 169: 1077–90, https://doi.org/10.1016/j.renene.2021.01.076.Search in Google Scholar
Jaszczur, M., Q. Hassan, and P. Palej. 2019. “An Optimisation of the Hybrid Renewable Energy Systems.” In E3S Web of Conferences, Vol. 113, 03022. EDP Sciences. https://doi.org/10.1051/e3sconf/201911303022.Search in Google Scholar
Jaszczur, M., Q. Hassan, P. Palej, and J. Abdulateef. 2020. “Multi-Objective Optimisation of a Micro-Grid Hybrid Power System for Household Application.” Energy 202: 117738, https://doi.org/10.1016/j.energy.2020.117738.Search in Google Scholar
Li, C., Y. Zheng, Z. Li, L. Zhang, L. Zhang, Y. Shan, and Q. Tang. 2021. “Techno-Economic and Environmental Evaluation of Grid-Connected and Off-Grid Hybrid Intermittent Power Generation Systems: A Case Study of a Mild Humid Subtropical Climate Zone in China.” Energy 230: 120728, https://doi.org/10.1016/j.energy.2021.120728.Search in Google Scholar
Li, C., D. Zhou, W. Yu, H. Wang, D. Zhu, M. Sun, and G. Li. 2017. “Performance of Off-Grid Residential Solar Photovoltaic Power Systems Using Five Solar Tracking Modes in Kunming, China.” International Journal of Hydrogen Energy 42 (10): 6502–10, https://doi.org/10.1016/j.ijhydene.2017.01.033.Search in Google Scholar
LONGI. LONGI PV Modules. Also available at https://en.longi-solar.com/.Search in Google Scholar
Monjezi, A. A., Y. Chen, R. Vepa, A. E. H. B. Kashyout, G. Hassan, H. E. B. Fath, A. E. Kassem, and M. H. Shaheed. 2020. “Development of Off-Grid Solar Energy Powered Reverse Osmosis Desalination System for Continuous Production of Freshwater with Integrated Photovoltaic Thermal (PVT) Cooling.” Desalination 495: 114679, https://doi.org/10.1016/j.desal.2020.114679.Search in Google Scholar
Okundamiya, M. S. 2021. “Size Optimization of a Hybrid Photovoltaic/Fuel Cell Grid-Connected Power System Including Hydrogen Storage.” International Journal of Hydrogen Energy 46 (59): 30539–46.10.1016/j.ijhydene.2020.11.185Search in Google Scholar
Olcan, C. 2015. “Multi-Objective Analytical Model for Optimal Sizing of Stand-Alone Photovoltaic Water Pumping Systems.” Energy Conversion and Management 100: 358–69, https://doi.org/10.1016/j.enconman.2015.05.018.Search in Google Scholar
Palej, P., H. Qusay, S. Kleszcz, R. Hanus, and M. Jaszczur. 2019. “Analysis and Optimization of Hybrid Renewable Energy Systems.” Polityka Energetyczna 22, https://doi.org/10.33223/epj/109911.Search in Google Scholar
Puranen, P., A. Kosonen, and J. Ahola. 2021. “Technical Feasibility Evaluation of a Solar PV Based Off-Grid Domestic Energy System with Battery and Hydrogen Energy Storage in Northern Climates.” Solar Energy 213: 246–59, https://doi.org/10.1016/j.solener.2020.10.089.Search in Google Scholar
Riza, D. F. A. L., S. I. U. H. Gilani, and M. S. Aris. 2015. “Standalone Photovoltaic Systems Sizing Optimization Using Design Space Approach: A Case Study for Residential Lighting Load.” Journal of Engineering Science & Technology 10 (7): 943–57.Search in Google Scholar
Rodrigues, S., R. Torabikalaki, F. Faria, N. Cafôfo, X. Chen, A. R. Ivaki, H. Mata-Lima, and F. J. S. E. Morgado-Dias. 2016. “Economic Feasibility Analysis of Small Scale PV Systems in Different Countries.” Solar Energy 131: 81–95, https://doi.org/10.1016/j.solener.2016.02.019.Search in Google Scholar
Said, Z., A. Mehmood, A. Waqas, A. A. Hachicha, and R. Loni. 2021. “Central Versus Off-Grid Photovoltaic System, the Optimum Option for the Domestic Sector Based on Techno-Economic-Environmental Assessment for the United Arab Emirates.” Sustainable Energy Technologies and Assessments 43: 100944, https://doi.org/10.1016/j.seta.2020.100944.Search in Google Scholar
Shaahid, S. M. 2011. “Review of Research on Autonomous Wind Farms and Solar Parks and their Feasibility for Commercial Loads in Hot Regions.” Renewable and Sustainable Energy Reviews 15 (8): 3877–87, https://doi.org/10.1016/j.rser.2011.07.017.Search in Google Scholar
Shaahid, S. M., L. M. Al-Hadhrami, and M. K. Rahman. 2014. “Review of Economic Assessment of Hybrid Photovoltaic-Diesel-Battery Power Systems for Residential Loads for Different Provinces of Saudi Arabia.” Renewable and Sustainable Energy Reviews 31: 174–81, https://doi.org/10.1016/j.rser.2013.11.055.Search in Google Scholar
Shaahid, S. M., I. El-Amin, S. Rehman, A. Al-Shehri, F. Ahmad, J. Bakashwain, and L. M. Al-Hadhrami. 2010. “Techno-Economic Potential of Retrofitting Diesel Power Systems with Hybrid Wind-Photovoltaic-Diesel Systems for Off-Grid Electrification of Remote Villages of Saudi Arabia.” International Journal of Green Energy 7 (6): 632–46, https://doi.org/10.1080/15435075.2010.529408.Search in Google Scholar
Shaahid, S. M., and M. A. Elhadidy. 2003. “Opportunities for Utilization of Stand-Alone Hybrid (Photovoltaic + Diesel + Battery) Power Systems in Hot Climates.” Renewable Energy 28 (11): 1741–53, https://doi.org/10.1016/s0960-1481(03)00013-2.Search in Google Scholar
Soropower. Solar Inverter Type. Also available at https://www.soropower.com/.Search in Google Scholar
Styszko, K., M. Jaszczur, J. Teneta, Q. Hassan, P. Burzyńska, E. Marcinek, N. Łopian, and L. Samek. 2019. “An Analysis of the Dust Deposition on Solar Photovoltaic Modules.” Environmental Science and Pollution Research 26 (9): 8393–401, https://doi.org/10.1007/s11356-018-1847-z.Search in Google Scholar PubMed PubMed Central
Touati, F. A., M. A. Al-Hitmi, and H. J. Bouchech. 2013. “Study of the Effects of Dust, Relative Humidity, and Temperature on Solar PV Performance in Doha: Comparison between Mono. and Amor. PVS.” International Journal of Green Energy 10 (7): 680–9, doi:https://doi.org/10.1080/15435075.2012.692134.Search in Google Scholar
© 2021 Walter de Gruyter GmbH, Berlin/Boston
Articles in the same Issue
- Frontmatter
- Research Articles
- Optimized routing with efficient energy transmission using Seline Trustworthy optimization for waste management in the smart cities
- Effectiveness of line type and cross type piezoelectric patches on active vibration control of a flexible rectangular plate
- Energy visibility of a modeled photovoltaic/diesel generator set connected to the grid
- Techno-economic analysis and design of hybrid renewable energy microgrid for rural electrification
- The comparison of triboelectric power generated by electron-donating polymers KAPTON and PDMS in contact with PET polymer
- Investigation of aerodynamic interaction between the balloon and the ducted wind turbine in airborne configuration
- Experimental investigation on treated transformer oil (TTO) and its diesel blends in the diesel engine
- Frequency response locking of electromagnetic vibration-based energy harvesters using a switch with tuned duty cycle
- Evaluation of energy generation in Iraqi territory by solar photovoltaic power plants with a capacity of 20 MW
- Review
- Quantitative analysis of DC–DC converter models: a statistical perspective based on solar photovoltaic power storage