Everyday referenced use of a digital temperature sensor – how well do alternative ice cubes really cool a drink?
-
Timo Fleischer

 ,
Julia Feichtner
,
Julia Feichtner

Abstract
In this paper, the cooling effect of alternative ice cubes made of granite, soapstone and ceramic is experimentally examined with the help of a digital temperature sensor and compared with that of a conventional ice cube. Digital sensors can be integrated in an everyday referenced way in the sense of inquiry-based learning during experimentation in chemistry lessons, since the use of ice cubes is a typical everyday situation that many students know and is therefore well suited for everyday referenced chemistry lessons. The advantages of digital sensors include the easy recording of measured values, the automatic creation of tables and graphs, and the direct link between the experiment and the representation. The results of the experiment reveal that the water ice cube has by far the greatest cooling effect compared to the alternative ice cubes. The entire cooling process of the ice cubes is explained and calculated, which essentially consists of three sub-steps: heating the ice cubes to melting temperature, melting the ice cubes, mixing the melted ice cube with the drink. The comparison of calculated and experimentally measured values shows that the cooling effect of all ice cubes could be determined very accurately experimentally using the digital temperature sensor.
1 Introduction
Who does not know the following situation:
Imagine it is a hot summer day. You want to make yourself comfortable with friends or family and have a refreshing drink. However, it was forgotten to put the drink in the refrigerator. In such a dilemma, you are just happy if there are still chilled ice cubes or alternative ice cubes made of ceramic, granite and/or soapstone in the freezer and you can thus cool the temperature of your drink at least by a few degrees Celsius.
This is a typical everyday situation that almost everybody knows and is therefore very well suited as an everyday referenced introduction to chemistry lessons. The importance and meaningfulness of everyday references in chemistry teaching is emphasized by several studies (Apotheker, 2019; Childs et al., 2015; Ulusoy & Onen, 2014; Wanjek, 2000). Students themselves emphasize the importance of everyday references by saying that they can improve their chemistry experiences by more practical and student-centered education. Chemistry education then seem less abstract and senseless for the students since the content learned can be applied in everyday life. Especially students who e.g., not aiming for a career in chemistry related jobs, recognize the importance of chemistry through everyday references (Barke et al., 2012; Broman & Simon, 2015).
In recent years, you can increasingly find so-called ice cube alternatives made of ceramic, soapstone or granite in supermarkets or online stores. These are advertised as reusable, undiluting and with excellent cooling performance (e.g. Amazon, 2023; Servusmarktplatz, 2023). But how well do these alternative ice cubes really cool a drink compared to a conventional (water) ice cube? Do these alternative ice cubes keep their advertising promise or is it just marketing? In this paper, the cooling effect of these ice cubes is experimentally tested with the help of a digital temperature sensor, thus demonstrating how digital measurement sensors can be integrated in a meaningful and everyday referenced way during experimentation in chemistry education.
2 Benefits of digital measurement sensors
The advantages of digital sensors include, for example, the fast and easy acquisition of measured values. This offers the possibility to repeat measurements. Such measurement repetitions often cannot take place in everyday science lessons due to time constraints. Data representations in tables and graphs, which are usually time-consuming to create and can cause some problems for learners (Von Kotzebue et al., 2015), are created automatically here. This allows more time for an independent interpretation of the data and for an in-depth examination of the phenomena and content presented (Lampe et al., 2015). Here, the cooling effect of the different types of ice cubes. While this puts the construction of the table or graph somewhat in the background, the graphical representation of the data during the experimental procedure establishes a link between the experiment and the representation (Beichner, 1990). For example, changes in variables can be viewed and internalized directly on the graph. In the past, this type of measurement was not possible or could only be performed by experts. However, due to advancing technology, it is now possible to work with (relatively) low-cost sensors in the classroom. This allows (traditional) school experiments to be extended and/or supplemented in a useful way (Lampe et al., 2015; Wejner & Wilke, 2022). So far, digital measurement sensors have mainly been used in physics education (Pietzner, 2009), but are also increasingly being integrated into chemistry education (Papadimitropoulos et al., 2021).
3 Everyday referenced inquiry-based learning
Inquiry-based learning is a widely accepted teaching and learning approach in science education. Here, students’ self-directed experiments are very central (Baur et al., 2020; Eckhardt et al., 2013). Inquiry learning can be applied to any basic scientific form of knowledge acquisition and includes all steps of a research process. In the natural sciences, there is usually a research cycle that is followed step by step in inquiry learning (e.g. Arnold et al., 2013). The experiments are integrated into the structure of the lesson. This integration takes place in the sense of the idealized process of a hypothetical-deductive cognition process. Depending on their level of experience, learners formulate (independently): 1. research questions, 2. hypotheses, 3. plan the design of the experiment, 4. conducting the experiment, 5. evaluate the experiment (Arnold et al., 2014; Kremer et al., 2019). The extent to which all steps have to take place in order to be able to speak of inquiry-based learning is viewed differently depending on the subject didactics and is also controversially discussed within these didactics (Deibl & Virtbauer, 2020).
In the experiment presented in this paper on the cooling effect of alternative ice cubes compared to a normal ice cube, the (1.) research question arises from the everyday reference, i.e. the advertising for alternative ice cubes: “Enjoy your drinks ice cold and undiluted. Because your new ice cubes do not melt. So the cubes are ideal for lemonade, …, and much more. Simply place the cooling stones in the ice compartment for a few hours. So they can be used again and again” (Amazon, 2023). “The reusable ice cubes made of Lower Austrian granite provide a particularly attractive image in the glass and cool excellently without diluting drinks” (Servusmarktplatz, 2023). A coherent research question would thus be: How well do these alternative ice cubes (ceramic, granite, soapstone) really cool a drink (in this case still mineral water) compared to a conventional/normal (water) ice cube?
Since the advertising calls them “ice cubes” and promotes a very good cooling effect, a coherent (2.) hypothesis in the lesson would thus be: The alternative ice cubes (ceramic, granite, soapstone) cool the drink (still mineral water) at least as good as the normal (water) ice cube.
The (3.) planning of the experiment (4.) conducting the experiment and (5.) evaluation of the experiment is presented below.
4 Planning and conducting the experiment
In order to test the cooling effect of the different ice cube variants, the experiment should be planned and set up as shown in Figure 1.
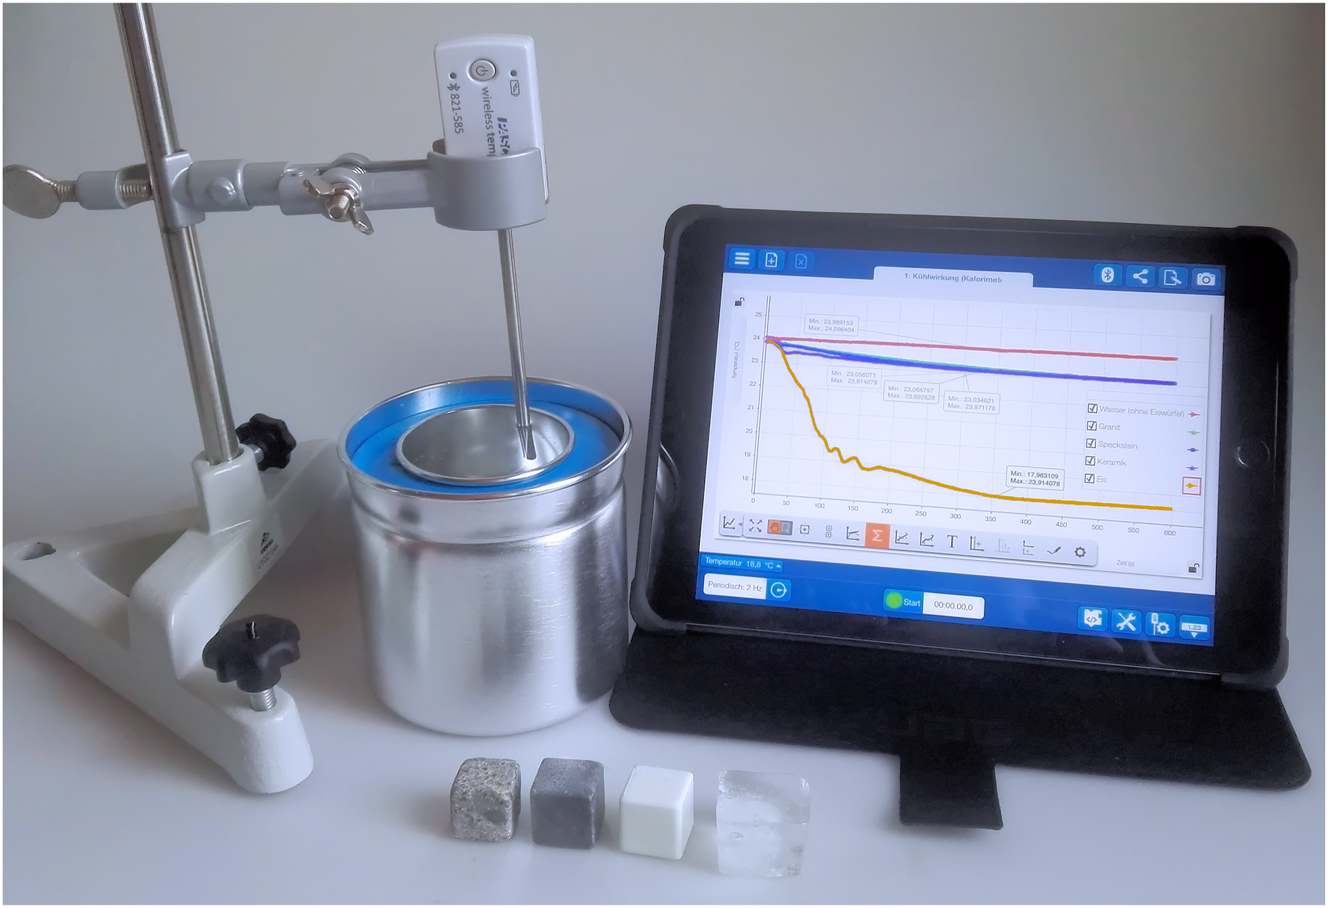
Set-up of the experiment.
The following substances and materials are needed for the experiment:
200 ml still mineral water (for each measurement)
ice cubes (granite, soapstone, ceramic, ice)
freezer
tripod material
graduated cylinder
crucible tongs
dewar vessel (alternatively a drinking glass or beaker)
tablet
digital temperatur sensor with matching app (here Pasco smart temperatur sensor, SPARKvue app)
In preparation for the experiment, the different ice cube variants should be placed in the freezer for at least one day so that all ice cubes have an initial temperature of −18.00 C°. The 200 ml of still mineral water should be measured with a graduated cylinder and should also be placed in the room in which the experiment is to be conducted for at least one day so that the still mineral water has a uniform starting temperature.
The temperature sensor is fixed with a tripod and connected to the associated app. 200 ml of still mineral water is placed in the dewar vessel. The sensor tip is placed so that it protrudes into the liquid. A marking on the tripod ensures that the temperature sensor is in the same position for each measurement. Data recording is started as soon as an ice cube is added to the still mineral water. This should be done on the most direct way from the freezer into the dewar vessel with the help of the crucible tongs and not with the hands, so that the ice cube does not already heat up due to the room temperature and body heat. After 10 min, the measurement process is stopped. This measurement period was chosen because in everyday life you want to drink the chilled drink after 10 min at the latest if you are thirsty. The whole procedure is repeated with all ice cube variants.
5 Evaluation of the experiment – the cooling effect of ice cubes
During the experiment, the app automatically records the measured values determined with the digital temperature sensor. The temperature curve is automatically illustrated graphically as a function of time (see Figure 2). Two measured values were recorded per second.
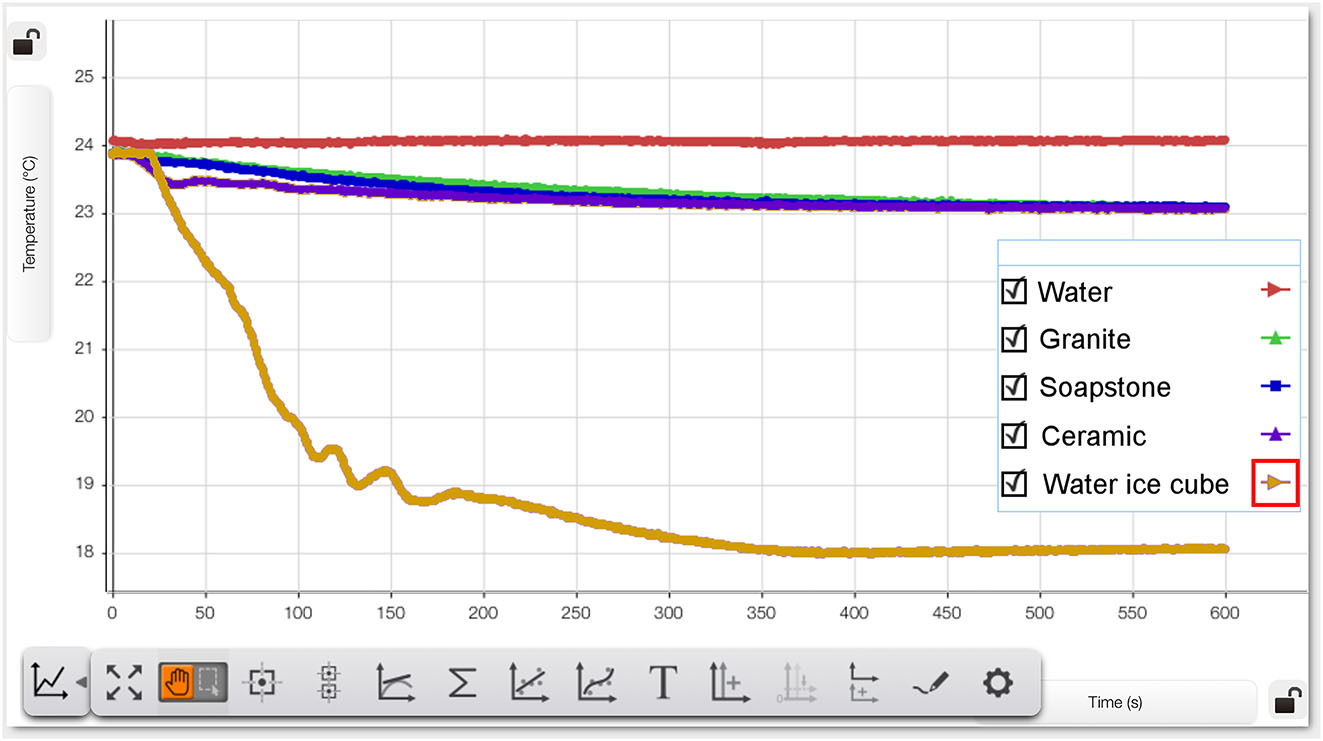
Measured cooling effect of the different ice cube variants. Red line: water without ice cubes. Green line: granite ice cube. Blue line: soapstone ice cube. Dark purple line: ceramic ice cube. Orange line: Water ice cube.
Figure 2 (screenshot from the app) shows the cooling effect of the different ice cubes as a function of time. The starting temperature of all measurement series was almost identical and ranged between 23.86 °C and 23.89 C°. This is a realistic drink temperature if you forgot to put the drink in the refrigerator on a hot summer day. Initially, it can be seen that for each ice cube variant, the still mineral water shows a reduction in temperature. It is immediately noticeable when looking at the graphs that the water ice cube (orange line) produces by far the fastest and most effective temperature reduction reaching the 18.00 °C mark. With the ice cube alternatives – granite, soapstone and ceramic – the temperature of the still mineral water did not fall below the 23.00 °C mark after 10 min.
All measured values can be automatically displayed as a table via the app. For a better comparison of the cooling effect, Table 1 shows the respective temperature values at intervals of 75 s each.
Measured cooling effect of the different ice cubes.
| Granite | Soapstone | Ceramic | Ice | |
|---|---|---|---|---|
| 0 s | 23.89 °C | 23.88 °C | 23.86 °C | 23.87 °C |
| 75 s | 23.68 °C | 23.64 °C | 23.44 °C | 21.19 °C |
| 150 s | 23.52 °C | 23.40 °C | 23.30 °C | 19.17 °C |
| 225 s | 23.38 °C | 23.27 °C | 23.21 °C | 18.67 °C |
| 300 s | 23.27 °C | 23.20 °C | 23.14 °C | 18.23 °C |
| 375 s | 23.20 °C | 23.14 °C | 23.12 °C | 18.00 °C |
| 450 s | 23.14 °C | 23.10 °C | 23.08 °C | 18.02 °C |
| 525 s | 23.11 °C | 23.10 °C | 23.08 °C | 18.03 °C |
| 600 s | 23.08 °C | 23.10 °C | 23.06 °C | 18.06 °C |
| ∆T max | 0.81 °C | 0.78 °C | 0.80 °C | 5.87 °C |
Table 1 shows that the water ice cube has by far the greatest cooling effect with a temperature reduction of ∆T max = 5.87 °C. The ice cube alternatives, on the other hand, have hardly any cooling effect with ∆T max = 0.81 °C for granite, ∆T max = 0.78 °C for soapstone and ∆T max = 0.80 °C for ceramic. Over the measurement period of 10 min, the water ice cube cools the still mineral water by approximately 5.07 °C more than the ice cube alternatives.
But why do the ice cubes alternatives cool the drink so much worse than water ice cubes? To explain this, the entire cooling process for ice cubes must be considered, which essentially consists of three sub-steps, which can be considered energetically separate from each other: (1.) heating the ice cubes to melting temperature, (2.) melting of the ice cubes and (3.) mixing the melted ice cube with the drink (Stöcker, 1994). For simplicity, it is assumed that heat is only transferred between the ice cube and the drink. The heat transfer from the environment is neglected here. To minimize this heat transfers in the experiment, an insulated Dewar vessel was used instead of a glass or beaker.
The ice cube heats up to its melting temperature of T I = 0.00 °C. Using the specific heat capacity of ice, with c I = 2.09 kJ/(kg K), and its mass m I = 0.013 g (classic ice cube shape, see Figure 1), the amount of heat Q I required for this process can be determined (Stöcker, 1994). Based on the temperature of the ice cube in the freezer (−18.00 °C), the temperature increase is ∆T I = 18.00 °C.
Q I = 0.49 kJ is therefore extracted from the still mineral water, as this is required to heat the ice cube by 18 °C. The temperature reduction in this step can be determined using the specific heat capacity of water c W = 4.19 kJ/(kg K) and the mass of the still mineral water m W = 0.20 kg (Stöcker, 1994):
By heating the ice cube to melting temperature, the still mineral water is cooled by 0.58 °C.
The temperature reduction of the drink due to the melting (heat of fusion Q m ) of the ice cubes can be determined by means of the latent heat (specific heat of fusion) of the ice cube with q m = 333.50 kJ/kg (Stöcker, 1994):
The still mineral water is thus deprived of Q m = 4.34 kJ, since this is required for the melting of the ice cube. The temperature reduction of the still mineral water due to melting is calculated equivalently to equation (2), with the result ∆T melting = 5.17 °C. The melting of the ice cube cools the still mineral water by 5.17 °C.
The temperature reduction of the still mineral water due to the mixing of the melted ice cube can be determined with the help of Richmann’s mixing rule (Stöcker, 1994):
Since the specific heat capacity of water is used for both the melted ice cube and the still mineral water, the mixing temperature T final depends only on the two masses m W and m m (m m = mass melted water = m I ) (Stöcker, 1994):
With T W = 18.12 °C after steps (1.) and (2.) and T m = 0.00 °C, the final temperature of the still mineral water, that was cooled with an ice cube, is T final = 17.01 °C (∆T max = 6.86 °C).
Since no melting process takes place with the alternative ice cubes made of granite, soapstone and ceramic, the cooling of the still mineral water is based only on the mixing process, which can be calculated according to Richmann’s mixing rule, see equation (4). The specific heat capacities (Clauser, 2013; Kuchling & Kuchling, 2022; Schweizer-fn, 2022), masses and temperatures of the alternative ice cubes are shown in Table 2. The final temperatures of the still mineral water, calculated according to richmann’s mixing rule, as well as the maximum cooling effect of the ice cube alternatives are also shown in Table 2.
Calculated cooling effect of the alternative ice cubes.
| Granite | Soapstone | Ceramic | |
|---|---|---|---|
| Specific heat capacity (kJ/(kg*K)) | 0.83 | 0.84 | 0,92 |
| Mass (kg) | 0.023 | 0.023 | 0.022 |
| Temperature drink (°C) | 23.89 | 23.88 | 23.86 |
| Temperature ice cube (°C) | −18.00 | −18.00 | −18.00 |
| T final (°C) | 22.96 | 22.94 | 22.89 |
| ∆T max (°C) | 0.93 | 0.94 | 0.97 |
6 Evaluation in the classroom
The experiment was evaluated in two lower secondary school classes (n = 35, age range 12–14). Before the experiment was conducted independently by the students in small groups of 3–4 people, the students were given the original advertising for the alternative ice cubes (see Section 5). Based on the advertising, the students were asked to hypothesize how good the cooling effect of these ice cubes is compared to a normal water ice cube (worse, equally good or better cooling effect) and also to indicate whether they would buy an alternative ice cube variant to cool a drink. 74.3 % of the students hypothesized that the alternative ice cubes would cool just as well (34.3 %) or better (40.0 %) than the normal ice cubes and 25.7 % that the alternative ice cubes have a poorer cooling effect. 42.9 % of the students would buy the ice cubes themselves. After conducting the experiment independently using the digital temperature sensor and tablet, the students were asked to verify their hypotheses. 90.3 % of the students now stated that the alternative ice cubes cool worse than the normal ice cubes, which corresponds to the result of the experiment, 9.7 % of the students stated that the cooling effect was equal to the normal ice cube. No student attributed a better cooling effect to the alternative ice cubes. This shows an increase in learning for most of the students with regard to the cooling effect, i.e. that the alternative ice cubes cool much worse than the normal ice cubes. After the experiment, only 8.8 % of students would still buy the alternative ice cubes to cool their drink, which is a noticeable decrease compared to prior to the experiment. The extent to which the digital temperature sensor and the resulting graphs in measuring the cooling effect helped the students to understand the experiment (cooling effect) (see Figure 2) was measured using a five-point Likert scale (“1 = strongly disagree”, “5 = strongly agree”; M = 4.02, SD = 1.19). 82.9 % of all students stated that the digital temperature sensor and the resulting graphs of the measurement helped them to interpret/undertstand the results (42.9 % strongly agree, 40.0 % mostly agree). Only 8.6 % of the students stated that they did not find the graphs, they received using the digital temperature sensor, helpful. In addition, 82.8 % of the students stated that they would like to do more experiments with digital sensors and tablets in future lessons (five-point Likert scale “1 = strongly disagree”, “5 = strongly agree”; M = 4.31, SD = 0.99). In terms of conducting the experiment, 85.7 % of the students stated that they found it easy to conduct, 14.3 % found it moderately difficult and no one found it difficult. Finally, the students were asked to briefly evaluate the advertisements presented to them based on their knowledge of the cooling effect of the alternative ice cubes from the experiment. The majority of the students addressed the advertising critically and argued that the advertising does not keep its promise of a good cooling effect, e. g., “I don’t think it is true what the advertising says, because the alternative ice cubes didn’t work well in the experiment”, “it is not real what the advertising says”, “it is a good idea but it is all fake”, “it is not true that they cool excellently”, “I don’t think the advertising is entirely true because the ice cubes don’t really cool” or “the advertising is good, but the stones are not”. Here, again, it can be seen that the majority of students are now able to critically evaluate the advertising for the ice cubes, which postulates a good cooling effect, based on the knowledge they have gained from this experiment. Finally, when asked what the students liked, almost all of them liked the experiment and thought it was good that they could observe the temperature development (cooling effect) directly on the tablet with the help of the digital temperature sensor, e.g. “seeing the temperature on the tablet”, “the image on the ipad”, “measuring and seeing how it develops”, “everything, e.g. the difference between the ice cubes”, “I liked everything” and “I think it was exciting and cool.”
The teacher (who teaches both classes) was asked about the added value of the digital temperature sensor and tablet in the experiment, the relevance to everyday life and the reuse of this experiment in chemistry lessons. With regard to the added value, the teacher stated that the students can see directly in the form of the graph what happens during the experiment and the result can be interpreted directly. Moreover, the teacher regards it as positive that this experiment integrates a topic from the students’ everyday lives and that the use of digital media is also practiced. However, the teacher also notes that this reference to everyday life will not be equally interesting for all students, as not all students are familiar with the alternative ice cubes. This is also confirmed by the students (70.6 % of students did not know the alternative ice cubes before the experiment, 29.4 % already knew them; 23.5 % of students have the alternative ice cubes at home), who nevertheless predominantly rate this reference to everyday life as positive. 45.7 % of the students found the everyday reference good, 42.9 % medium and only 11.4 % poor. The teacher also positively emphasizes the reference to advertising, as the evaluation of advertising is part of the lower secondary school curriculum. Finally, in response to the question of whether this experiment will be used again, the teacher stated that it would definitely be used again in chemistry lessons.
7 Discussion
In this paper, the cooling effect of a normal ice cubes compared to alternative ice cubes made of granite, soapstone and ceramic was experimentally tested with the help of a digital temperature sensor, thus demonstrating how digital measurement sensors can be integrated in a meaningful and everyday referenced way during experimentation in chemistry education (Apotheker, 2019; Childs et al., 2015; Ulusoy & Onen, 2014; Wanjek, 2000). The results of the classroom evaluation show that most students found the conduction of the experiment easy and were able to measure and understand the much poorer cooling effect of the alternative ice cubes using the digital temperature sensor and were therefore able to critically assess the advertising for these ice cubes. Furthermore, the majority of students also liked the everyday reference. The article shows that it is possible to integrate this experiment in the widely accepted teaching and learning approach of inquiry-based lerning and that it is possible to thematize this approach in an everyday referenced way (Arnold et al., 2014; Kremer et al., 2019).
With regard to the research question, concerning how well the alternative ice cubes (ceramic, granite, soapstone) really cool a drink (in this case still mineral water) compared to a conventional (water) ice cube, results allow the following conclusions:
Based on the conducted experiment (see Figure 2 and Table 1) it could be shown that the water ice cubes have the gratest cooling effect and that the alternative ice cubes have hardly any cooling effect. With an almost identical output temperature of the still mineral water of approximately 23.90 °C, the water ice cube cools the drink more than five degree Celsius better than the alternative ice cubes. Due to the ice cube advertising that promises a good cooling effect for the alternative ice cubes, a thoroughly logical hypothesis would be that the alternative ice cubes (ceramic, granite, soapstone) cool the still mineral water at least as good as the normal (water) ice cube (as claimed in the advertisement), which was also assumed by the majority of the students. The experiment shows, that this hypothesis can be rejected which was also recognized by most students.
However, if the students already had knowledge about the underlying processes of the cooling effect of ice cubes (see three sub-steps of the cooling process), the hypothesis could also have been formulated that the alternative ice cubes cannot have a good cooling effect because the melting process is missing here. This process is the main contributor to the cooling, as shown in the calculated evaluation of the cooling effect of the ice cubes (Stöcker, 1994). Students of this study who have assumed that the alternative ice cubes cool worse than the normal ice cubes cannot normally have any knowledge of the sub-steps of the entire cooling process. Therefore, these will either result from personal experience (alternative ice cubes at home) or from skepticism about the advertising. However, for the reason of completeness and to show the high accuracy of the digital sensor, these calculations were nevertheless presented in this paper, even if their calculations are only discussed in upper secondary chemistry lessons. Since the alternative ice cubes do not melt their cooling effect is significantly lower than that of the normal (water) ice cube (see Tables 1 and 2), because the cooling of the still mineral water is based only on the mixing process, which can be calculated according to Richmann’s mixing rule (Stöcker, 1994). With almost identical specific heat capacities and masses of the alternative ice cubes (see Table 2), this results in an almost identically low cooling effect of these ice cubes for the still minaral water (see Figure 1, Tables 1 and 2).
The slight discrepancy between the measured and calculated (ideal conditions) cooling effect (∆T max) of 0.99 °C for the normal (water) ice cube and 0.12–0.16 °C for the alternative ice cubes can be explained by the heat transfer with the environment, which cannot be entirely excluded in the experiment. To minimize this heat transfer, an isolated dewar vessel can be used for the experiment. To conduct the experiment, however, the vessel must be open at the top. This results in a heat transfer with the environment, especially at the surface of the still mineral water. Nevertheless, the results show that the cooling effect of all ice cubes could be determined very accurately experimentally with the help of the digital temperature sensor, which is a benefit of digital measurement sensors (Lampe et al., 2015). Digital data acquisition is particularly useful when, as in this experiment, the data is recorded over a longer period of time and a comparison between several series of measurements is to be carried out, displayed in parallel (see Figure 1) and evaluated (see Figure 1 and Table 1) (Kerzendorfer, 2015; Lampe et al., 2015). By simultaneously visualizing the data, in this case the cooling effect of the different types of ice cubes, which is possible by means of the app, the investigated cooling effect can be made visible directly during the experiment in the form of graphs. The graphical representation of the data during the experimental procedure establishes a link between the experiment and the representation (Beichner, 1990). This supports an essential function of experiments, namely to illustrate phenomena and/or processes (and the associated content for the evaluation). Both the teacher and the students positively emphasize this feature of the digital temperature sensor. The collected data (see Figure 1 and Table 1) can be used for the evaluation of the experiment in an uncomplicated, clear and accurate way (Barke et al., 2018; Kerzendorfer, 2015; Lampe et al., 2015; Nerdel, 2017).
8 Conclusions
How likely students or their parents think about the underlying processes involved in the cooling effect of ice cubes when they want to buy such well-advertised alternative ice cubes made of granite, soapstone or ceramic, and are thus able to reflect on a potential purchasing decision? It is therefore all the more important to make chemistry education as relevant to everyday life as possible and to enable the students to apply their knowledge from the lessons in everyday life. Thus, for example, students should be able to critically assess the advertising for these alternative ice cubes after conducting the experiment (as most of the students did) and a wrong purchase with regard to the cooling effect of these alternative ice cubes (in reviews, people complain about their low cooling effect) could be avoided. Taken together, this paper shows how digital measurement sensors can be integrated in a meaningful and everyday referenced way in the spirit of inquiry-based learning during experimentation in chemistry education.
Acknowledgments
The authors thank all schools, teachers, and students.
-
Research ethics: Participation was anonymous, i.e., all data were collected and analyzed anonymously, on a voluntary basis. All study participants were informed about the scientific purpose of the study. Due to all these measures in the implementation of this study an audit by an ethics committee was waived.
-
Research funding: None declared.
-
Author contributions: All authors have accepted responsibility for the entire content of this manuscript and approved its submission.
-
Competing interests: Authors state no conflict of interest.
-
Informed consent: Informed consent was obtained from all individuals included in this study.
-
Data availability: The data presented in this study are available on request from the corresponding author. The data are not public due to the ongoing research.
References
Amazon. (2023). Rosenstein & Söhne Cooling Stones. Retrieved January 24, 2023, from https://www.amazon.de/Rosenstein-S%C3%B6hne-K%C3%BChlsteine-Dauer-Eisw%C3%BCrfel-Speckstein/dp/B0068GV8I8 10.1109/MMM.2023.3284797Search in Google Scholar
Apotheker, J. (2019). The irresistible use of contexts in chemistry education. Israel Journal of Chemistry, 59(6–7), 608–617. https://doi.org/10.1002/ijch.201800081 Search in Google Scholar
Arnold, J., Kremer, K., & Mayer, J. (2013). Wissenschaftliches Denken beim Experimentieren – Kompetenzdiagnose in der Sekundarstufe II [Scientific thinking while experimenting – competence diagnosis in secondary school]. Erkenntnisweg Biologiedidaktik, 11, 7–20.Search in Google Scholar
Arnold, J., Kremer, K., & Mayer, J. (2014). Schüler als Forscher – experimentieren kompetenzorientiert unterrichten und beurteilen [Students as researchers – teaching and assessing experimentation in a competence-oriented way]. MNU Journal, 67(2), 83–91.Search in Google Scholar
Barke, H.-D., Harsch, G., Kröger, S., & Marohn, A. (2018). Chemiedidaktik kompakt – Lernprozesse in Theorie und Praxis [Didactics of chemistry compact – learning processes in theory and practice]. Berlin, Heidelberg: Springer Spektrum.10.1007/978-3-662-56492-9Search in Google Scholar
Barke, H.-D., Harsch, G., & Schmid, S. (2012). Everyday life and chemistry. In H.-D. Barke, G. Harsch, & S. Schmid (Eds), Essentials of Chemical Education (pp. 217–243). Berlin, Heidelberg: Springer..10.1007/978-3-642-21756-2_8Search in Google Scholar
Baur, A., Hummel, E., Emden, M., & Schröter, E. (2020). Wie offen sollte offenes experimentieren sein? Ein Plädoyer für das geöffnete experimentieren [How open should open experimentation be? A plea for open experimentation]. MNU journal, 72, 125–128.Search in Google Scholar
Beichner, R. J. (1990). The effect of simultaneous motion Presentation and graph generation in a Kinematics lab. Journal of Research in Science Teaching, 27(8), 803–815. https://doi.org/10.1002/tea.3660270809 Search in Google Scholar
Broman, K., & Simon, S. (2015). Upper secondary school students’ choice and their ideas on how to improve chemistry education. International Journal of Science and Mathematics Education, 13, 1255–1278. https://doi.org/10.1007/s10763-014-9550-0 Search in Google Scholar
Childs, P. E., Hayes, S. M., & O’Dwyer, A. (2015). Chemistry and everyday life: Relating secondary school chemistry to the current and future lives of students. In I. Eilks, & A. Hofstein (Eds), Relevant Chemistry Education – From Theory to Practice (pp. 33–54). Rotterdam: Sense Publishers.10.1007/978-94-6300-175-5_3Search in Google Scholar
Clauser, C. (2013). Einführung in die Geophysik. Globale physikalische Felder und Prozesse in der Erde [Introduction to Geophysics. Global physical fields and processes in the Earth]. Berlin, Heidenberg: Springer Spektrum.10.1007/978-3-642-04496-0Search in Google Scholar
Deibl, I., & Virtbauer, L. (2020). Forschendes Lernen an außerschulischen Lernorten –Schüler*innen erforschen die Welt der Bienen [Inquiry-based learning at extracurricular learning sites -students explore the world of bees]. In A. Eghtessad, T. Kosler, & C. Oberhauser (Eds), transfer Forschung – Schule Band 6 (pp. 27–43). Bad Heilbrunn: Julius Klinkhardt.Search in Google Scholar
Eckhardt, M., Urhahne, D., Conrad, O. & Harms, U. (2013). How effective is instructional support for learning with computer simulations? Instructional Science 2013, 41, 205-124, https://doi.org/10.1007/s11251-012-9220-y Search in Google Scholar
Kerzendorfer, E. (2015). Computergestützter Chemieunterricht – messen, Auswerten und Simulieren mit PC, Notebook und Tablet/Smartphone – TEIL 1 [Computer-supported chemistry teaching – measuring, evaluating and simulating with PC, notebook and tablet/smartphone – PART 1]. Chemie & Schule, 30, 5–9.Search in Google Scholar
Kremer, K., Möller, A., Arnold, J., & Mayer, J. (2019). Kompetenzförderung beim Experimentieren [Competence promotion during experimentation]. In J. Groß, M. Hammann, P. Schmiemann, & J. Zabel (Eds), Biologiedidaktische Forschung: Erträge für die Praxis. Berlin, Heidelberg: Springer Spektrum..10.1007/978-3-662-58443-9_7Search in Google Scholar
Kuchling, H., & Kuchling, T. (2022). Taschenbuch der Physik [Physics paperback]. München: Carl Hanser Verlag.10.3139/9783446473645Search in Google Scholar
Lampe, H.-U., Liebner, F., Urban-Woldron, H., & Tewes, M. (2015). Innovativer naturwissenschaftlicher Unterricht mit digitalen Werkzeugen [Innovative science teaching with digital tools]. In MNU Themenreihe Bildungsstandards. Neuss. Verlag Klaus Seeberger.Search in Google Scholar
Nerdel, C. (2017). Grundlagen der Naturwissenschaftsdidaktik – Kompetenzorientiert und aufgabenbasiert für Schule und Hochschule [Basics of science didactics – competence-oriented and task-based for school and university. Berlin, Heidelberg: Springer Spektrum.Search in Google Scholar
Papadimitropoulos, N., Dalacosta, K., & Pavlatou, E. A. (2021). Teaching chemistry with arduino experiments in a mixed virtual-Physical learning environment. Journal of Science Education and Technology, 30, 550–566. https://doi.org/10.1007/s10956-020-09899-5 Search in Google Scholar PubMed PubMed Central
Pietzner, V. (2009). Computer im naturwissenschaftlichen Unterricht – ergebnisse einer Umfrage unter Lehrkräften [Computer Usage in Science Classes – results of a Questionnaire among Science Teachers]. Zeitschrift für Didaktik der Naturwissenschaften, 15, 47–67.Search in Google Scholar
Schweizer-fn (2022). Wärmekapazität verschiedener Materialien [Heat capacity of different materials]. Retrieved April 06, 2023, from https://www.schweizer-fn.de/stoff/wkapazitaet/wkapazitaet_baustoff_erde.php Search in Google Scholar
Servusmarktplatz (2023). Steirische Eiswürfel aus Naturstein [Styrian ice cubes made of natural stone]. Retrieved January 24, 2023, from https://www.servusmarktplatz.com/p/Steirische-Eisw%C3%BCrfel-aus-Naturstein/SM149692/Search in Google Scholar
Stöcker, H. (Ed). (1994). Taschenbuch der Physik [Physics paperback]. Frankfurt am Main: Verlag Harri Deutsch..Search in Google Scholar
Ulusoy, F., & Onen, A. S. (2014). A research on the generative learning model supported by context-based learning. Eurasia Journal of Mathematics, Science and Technology Education, 10(6), 537–546. https://doi.org/10.12973/eurasia.2014.1215a Search in Google Scholar
Von Kotzebue, L., Gerstl, M., & Nerdel, C. (2015). Common mistakes in the construction of diagrams in biological contexts. Research in Science Education, 45(2), 193–213. https://doi.org/10.1007/s11165-014-9419-9 Search in Google Scholar
Wanjek, J. (2000). Einflüsse von Alltagsorientierung und Schülerexperimenten auf den Erfolg von Chemieunterricht [Influences of everyday life orientation and student experiments on the success of chemistry teaching] [Doctoral dissertation, University of Münster, 2001]. Publication Server University of Münster. urn:nbn:de:hbz:6-85659551234.Search in Google Scholar
Wejner, M., & Wilke, T. (2022). LabPi: A digital measuring station for STEM education 4.0. Journal of Chemical Education, 99(2), 819–827. https://doi.org/10.1021/acs.jchemed.1c01139 Search in Google Scholar
© 2023 the author(s), published by De Gruyter, Berlin/Boston
This work is licensed under the Creative Commons Attribution-NonCommercial-NoDerivatives 4.0 International License.
Articles in the same Issue
- Frontmatter
- Editorial
- EDITORIAL for Volume 6
- Research Articles
- Virtual undergraduate chemical engineering labs based on density functional theory calculations
- From screen to bench: unpacking the shifts in chemistry learning experiences during the COVID-19 transition
- Good Practice Report
- Learning about Confucian ecological ethics to promote education for sustainable development in Chinese secondary chemistry education
- Research Article
- Interactive instructional teaching method (IITM); contribution towards students’ ability in answering unfamiliar types questions of buffer solution
- Special Issue Paper
- The times of COVID-19 and beyond: how laboratory teaching evolved through the Pandemic
- Research Article
- Development of a self-test for undergraduate chemistry students: how do students solve tasks on basic content knowledge?
- Good Practice Report
- IUPAC International Chemical Identifier (InChI)-related education and training materials through InChI Open Education Resource (OER)
- Everyday referenced use of a digital temperature sensor – how well do alternative ice cubes really cool a drink?
- Editorial
- List of reviewers contributing to volume 5, 2023