Issues in assessing analytical performance specifications in healthcare systems assembling multiple laboratories and measuring systems
-
Elvar Theodorsson


Abstract
Analytical performance specifications (APS) are usually compared to the intermediate reproducibility uncertainty of measuring a particular measurand using a single in vitro diagnostic medical device (IVD MD). Healthcare systems assembling multiple laboratories that include several IVD MDs and cater to patients suffering from long-term disease conditions mean that samples from a patient are analyzed using a few IVD MDs, sometimes from different manufacturers, but rarely all IVD MDs in the healthcare system. The reproducibility uncertainty for results of a measurand measured within a healthcare system and the components of this measurement uncertainty is useful in strategies to minimize bias and overall measurement uncertainty within the healthcare system. The root mean squares deviation (RMSD) calculated as the sample standard deviation (SD) and relative SD includes both imprecision and bias and is appropriate for expressing such uncertainties. Results from commutable stabilized internal and external control samples, from measuring split natural patient samples or using big-data techniques, are essential in monitoring bias and measurement uncertainties in healthcare systems. Variance component analysis (VCA) can be employed to quantify the relative contributions of the most influential factors causing measurement uncertainty. Such results represent invaluable information for minimizing measurement uncertainty in the interest of the healthcare systemʼs patients.
Analytical performance specifications
The fitness-for-intended-use is the degree to which measurement results meet the usersʼ needs. In analytical chemistry, it is usually expressed as the combination of sampling uncertainty, the uncertainty of the traceability to higher-order references, and the appropriate type of measurement uncertainty. In clinical chemistry, the fitness-for-intended-use is patient-focused and called analytical performance specifications (APS), translating patient-related quality measures into clinically meaningful criteria [1]. It includes primarily biological variation and the effect of measurement results on clinical outcomes (Figure 1).
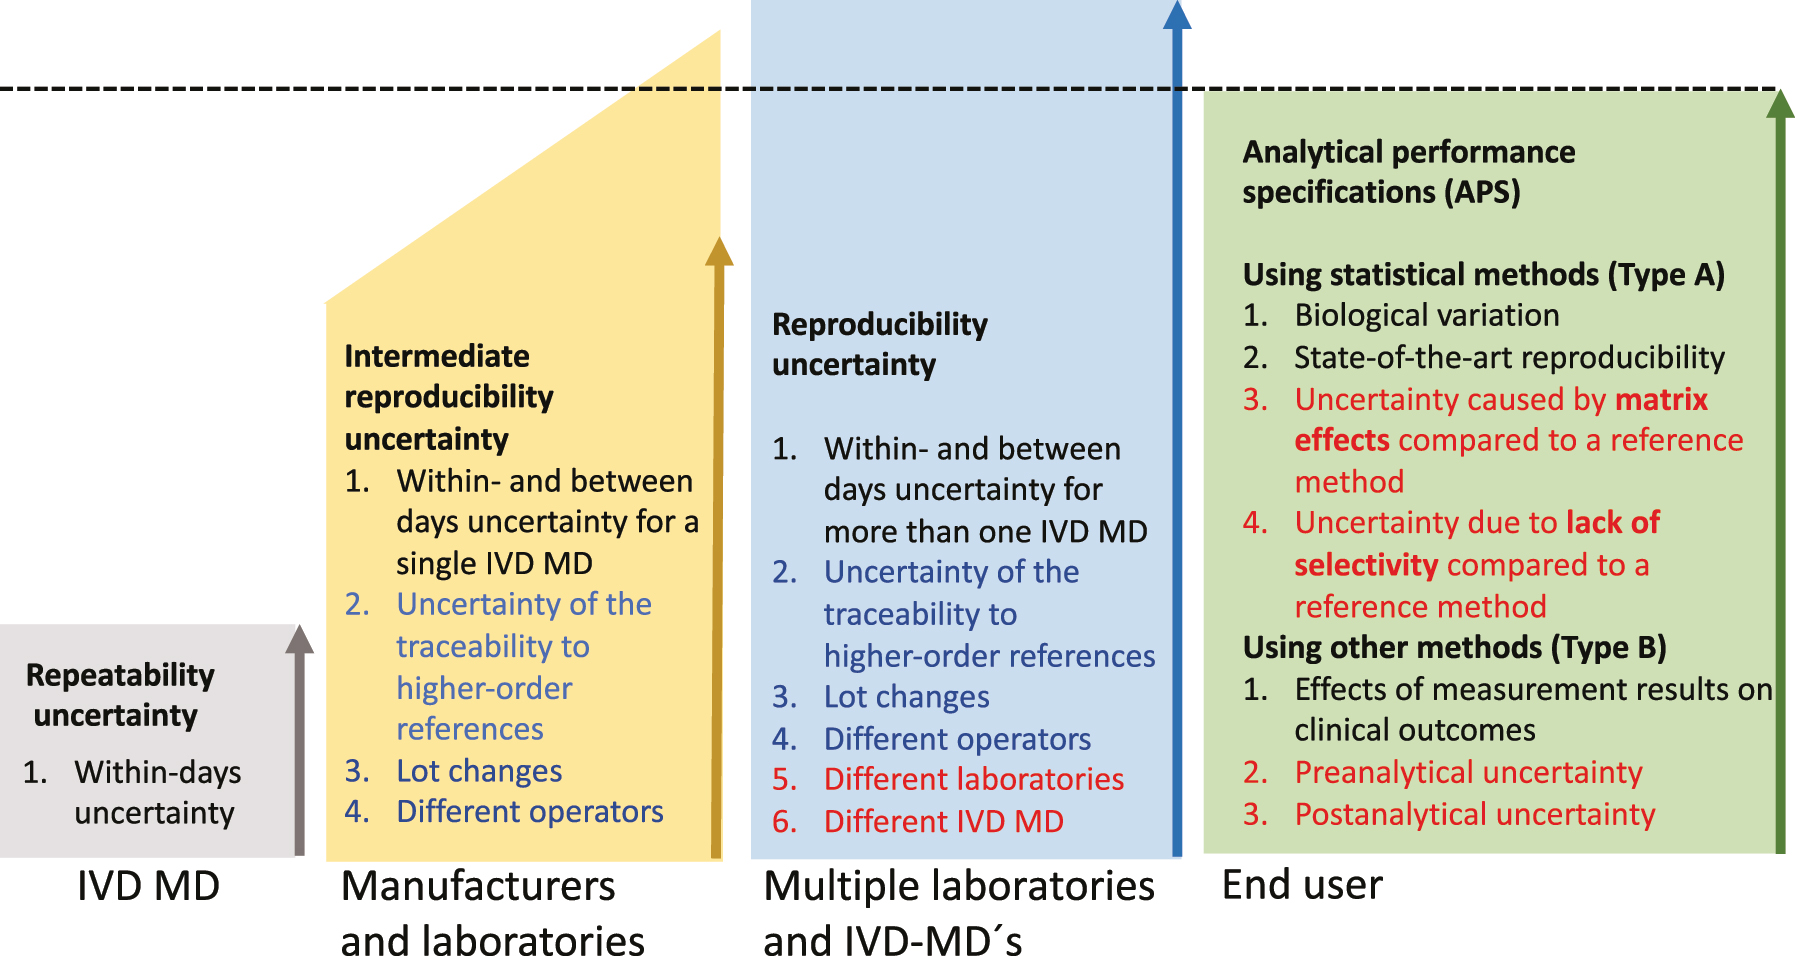
The three polygons on the left with increasing heights quantify (as relative SD=CV%) several factors causing measurement uncertainty encountered in medical laboratories from repeatability uncertainty, via intermediate reproducibility uncertainty that manufacturers can estimate, up to the reproducibility uncertainty encountered in healthcare systems with several laboratories, which only the end-users can estimate.
APS have been discussed since the dawn of the current practice of laboratory medicine [2, 3]. The 1976 Aspen [4] and 1978 London [5] conferences and a Nordkem project [6] represent early concerted attempts that continued with more recent conferences in Stockholm in 1999 [7, 8] and in Milan in 2014 [9]. From the outset, APS has been expressed as statistical measures of precision (type A uncertainty) [10], such as imprecision CV%, total error [11], and later as uncertainties in the vein of the International Vocabulary of Measurement (VIM) [12] and Guide to the Expression of Uncertainty (GUM) [10]. The fulfillment of the APS has traditionally been tested using results from the internal quality control and/or proficiency testing [13], [14], [15], [16]. Guidelines from The Clinical and Laboratory Standards Institute (CLSI) C54-A-IR Verification of Comparability of Patient Results Within One Health Care System [17] and EP31-A-IR Verification of Comparability of Patient Results Within One Health Care System [18] elucidate designs, criteria, control materials and statistical methods for verifying the equivalence of measurement results in healthcare systems [19] essential for fulfilling APS. APS may also include uncertainty that cannot be dealt with using statistical methods (type B uncertainty) [20], including measures of diagnostic properties investigated in clinical studies [7, 9] and may eventually also include matrix effects, selectivity (VIM 3, 2.45 [12]) of the measurement procedure [21], [22], [23], [24] as well as pre-and post-analytical uncertainties (Figure 1) [25, 26].
Measurement precision is the “closeness of agreement between indications or measured quantity values obtained by replicate measurements on the same or similar objects under specified conditions” VIM 3: 2.15 [12]. These specified conditions are repeatability-, intermediate-, and reproducibility conditions [27, 28] where repeatability- and reproducibility conditions of measurement represent the extremes from the within-batch/day precision to the inclusion of all identifiable causes of variation over extended periods (reproducibility conditions). Somewhere between the two extremes are various intermediate reproducibility conditions of measurement that need to be specified (Figure 1). APS is currently compared to the intermediate reproducibility measurement uncertainty [29] for a measurand determined within- and between-day reproducibility uncertainty using a single IVD MD [30], [31], [32], [33], [34], [35] and the traceability to higher-order references [19, 36], [37], [38] including lot-to-lot variation.
While there is a tentative agreement on methods for establishing APS, there is less agreement on methods for the follow-up of the fulfillment of APS by individual measuring systems and end-user laboratories serving entire healthcare systems, and on the responsibilities of the manufacturers in this context.
The factors depicted in red are currently neither included in the APS nor the follow-up of the fulfillment of the APS. The factors depicted in blue (lot changes) are preferably determined by the manufacturers but are currently mainly determined by the end-users.
Manufacturers of IVD MD can and should calculate and report the uncertainty in the traceability hierarchy and the intermediate single IVD MD reproducibility. However, employing several IVD MDs from multiple manufacturers in laboratories serving a healthcare system, including handling lots of reagents and calibrators, is in the hands of the end-users.
The intermediate reproducibility uncertainty is currently the optimal measure of the measurement uncertainty and should be compared to the APS. It should include at least the within- and between-days measurement uncertainty and the uncertainty of the traceability hierarchy, including lot-to-lot uncertainty [30], [31], [32], [33], [34] (Figure 1). The uncertainty details in the traceability hierarchy are commonly not publicly available. Therefore, the lot-to-lot uncertainty is detailed separately since the end-users can determine it. Decisions regarding which measurement procedures, IVD MD, routines for lot number changes, etc., are combined in the laboratories are in the hands of the end-users. Such decisions will influence the reproducibility uncertainty for the actual measurand in the healthcare system. In situations where the intermediate reproducibility uncertainty CV% is larger than the APS, e.g. for albumin and homocysteine [39] the producers of reference materials, the manufacturers, and laboratories serving the healthcare system need to find strategies to decrease the uncertainty. Increasing the number of replicate measurements of reference materials is an evident tool, and more detailed recommendations have been published by an IFCC working group [40].
The reproducibility uncertainty [12] includes all uncertainty components in the uncertainty of measurement results for a certain measurand [19, 36], [37], [38] (Figure 1). Over time, measurement results from samples from a single patient are unlikely to include all components of variation included in the reproducibility measurement uncertainty. Reproducibility measurement uncertainty is, therefore, not appropriate for monitoring the fulfillment of APS. It should instead be used in strategies to minimize bias and overall measurement uncertainty within the healthcare system.
Including bias in uncertainty calculations
Root mean squares deviation (RMSD)
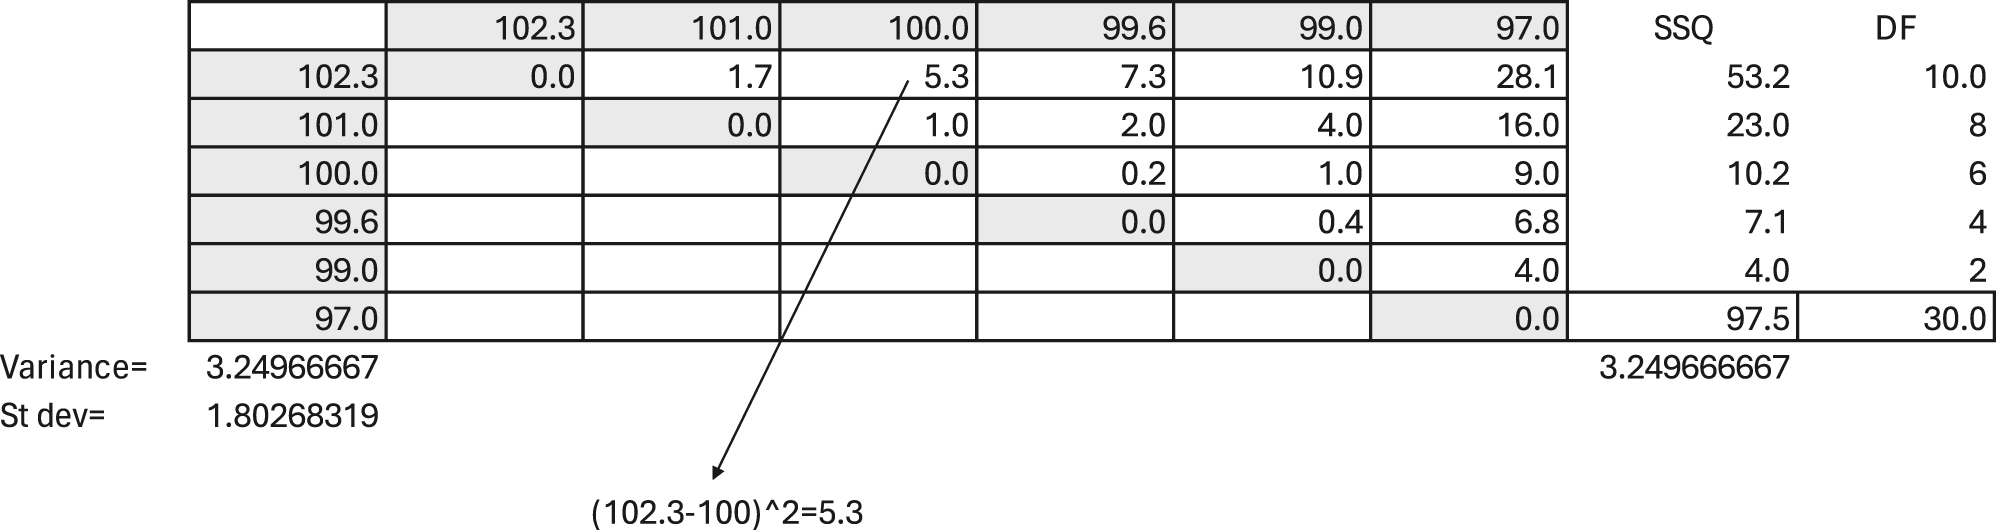
The understanding- and definitions of measures of imprecision have developed over the last two centuries, and imprecision, as currently defined, should only include random error (see below). Table 1 illustrates the original nineteenth-century practice of calculating variation as the distances between results on the measurement scale. The example illustrates the pipetting of six replicates of 100 μL of water on a micro-scale, listing the results horizontally and vertically.
An example of pipetting six replicates of 100 μL of water on a micro-scale. The replicate measurements are listed horizontally on top and vertically to the left to illustrate their squared differences between all results. For example, the difference between 102.3 and 100 μL is 2.3, and 2.3 squared equals 5.3. The number of unique comparisons between the data is 15 and not 16 since there is no difference when a result is compared to itself. All other differences are subject to variation. Each of the two results make up the difference. Therefore, the degree of freedom is double the number of unique comparisons, i.e., 2 × 15=30. The mean squared deviation (MSD) (equivalent to the variance) is the sum of squared unique differences divided by the number of degrees of freedom; here, 97.5/30=3.25, and the RMSD is 1.80. This also illustrates the logic of the Bessel [41] correction (n−1) when calculating the sample variance.
|
The calculation of the mean squared deviation (MSD) is illustrated in Table 1 and may be expressed as
The number of comparisons needed when using these formulas increases exponentially with the number of data (n(n−1)/2).
The MSD as the mean difference between observations incorporates both random and systematic errors – thus imprecision and bias. The square root of the MSD is the RMSD, which is identical to the SD in case the data are unbiased. The RMSD is fundamentally a mathematical expression of the mean distance of each number from every other number and the arithmetic mean irrespective of the data distribution.
The MSD and RMSD are most efficiently calculated using the commonly used formulas for calculating the sample variance and the sample SD, using the mean value and Bessel correction (n−1) (Eqs. (3) and (4)). When the sample mean value is used in the calculation, the number of comparisons is related to n and avoids the exponential increase in comparisons illustrated in Eqs. (1) and (2).
SD
In a Gresham lecture on January 31st, 1893, Karl Pearson proposed a re-defined concept and term “SD” for the RMSD used at the time [42], [43], [44], [45]. He defined “SD” as the square root of the average of the squared deviations taken from the arithmetic mean of the population distribution [45], later taken also from the sample arithmetic mean when the population mean is unknown. The SD, as defined by Karl Pearson, and by Gauss, subsequently remains a preferred measure of variation since it is a parameter in the normal distribution and, therefore, important as a standard effect size, e.g., according to Guide to the Expression of Uncertainty in Measurement (GUM) [10].
Importantly, Pearsonʼs “SD” represents an estimate of the population SD for normal-distribution-based inference rather than a distribution-independent data description. This association of the “SD” with the normal distribution implies that it should not include bias. Systematic error components should be eliminated when the SD is used for inference, whereas bias and imprecision are natural and legitimate in variance component analysis and other descriptive statistical procedures.
Calculating and presenting the traditional SD and relative SD means there is no intuitive interpretation of the values because sums-of-squares-based measures vary in response to both the central tendency and variability [46]. Therefore, absolute-error - or absolute-deviation-based measures are increasingly used, e.g., in climatology where understanding by the public is paramount [46], [47], [48]. However, they are unlikely to replace the standard and relative SD in metrology and laboratory medicine in the short term.
Rili-BÄK and root mean square
The German guidelines for quality assurance for medical laboratory examinations Rili-BÄK [49, 50] express uncertainty related to a target value as the “root mean square” as follows:
Where ∆represents the root mean square of the measurement deviation from the target value, x o represents the target value, x i represents an individual measurement value, and n is the number of individual values used for calculation.
When SD (s) and the bias (δ) are determined, e.g., in external quality assurance and are used to calculate the root mean square, the following relation is used:
The Rili-BÄK root mean square statistic has proven appropriate for including the bias found in proficiency testing in uncertainty calculations. It is accompanied by corresponding required performance limits.
Reproducibility measurement uncertainty
The ultimate goal is to optimize the quality of the total (pre-analytical/analytical/post-analytical) examination process. Therefore, going beyond setting the current APS [9] and establishing the examination performance specifications [51] would be desirable. In principle, the performance specifications of the pre-and post-analytical laboratory processes should follow the same models as for APS. When these additional phasesʼ components can be expressed numerically, they could and should be added to the examination performance specifications. In other situations, pre- and post-APS will be best represented by separate quality indicators [9].
Bias is the difference between the mean value of measurement results obtained by a laboratory and the true or reference value [30]. It is especially important in clinical chemistry to differentiate between a major and minor bias caused, e.g., by calibrations and lot changes. Minor bias will, over time, become part of reproducibility imprecision and intermediate reproducibility. Major bias should be corrected by appropriate service and calibration of the measuring systems and preferably not by factorization, as there is a risk that factorization over time will increase the overall uncertainty of the measurement results in the healthcare system.
Parametric inferential statistics require the elimination of bias. The absence of bias is an idealized situation rarely fully realized in a healthcare system encompassing multiple laboratories and IVD MDs. Whether these shifts are counted when calculating SD for establishing limits for quality control is open to debate. From the outset of the practice of process control, Walter Shewhart recommended a pragmatic approach to deal with this by incorporating in the control limits all factors causing variation over extended periods [52, 53]. Including bias in calculating the intermediate reproducibility measurement uncertainty [54, 55] in laboratories serving a healthcare system is appropriate since it represents a substantial component of the uncertainty, which needs to be compared to the APS.
The RMSD is a preferred measure of variation [55] since it can include both random and systematic errors. A major bias precludes the proper use of parametric methods for significance testing, but the analysis of variance components is still valid. RMSD, including the analysis of the components of uncertainty, is valuable for directing strategic and detailed measures of improvements in the laboratories serving the healthcare system. Whether statistics should primarily be used for making decisions [17, 18, 56, 57] or for investigating factors causing variation [58] continues to be amongst the most compelling causes of disagreements in statistics [59]. Statistics for making decisions have traditionally been favored in the science and practice of clinical chemistry, probably because quality control and the use of measurement results in clinical medicine are primary activities in the specialty. However, in the current situation where there is a need to decrease measurement and diagnostic uncertainty in the laboratories in attempts to fulfill APS, there is a need to identify the factors that primarily cause variation in different circumstances to make effective and cost-effective strategic decisions aimed at decreasing measurement uncertainty in the interest of fulfilling APS. Ranking the influences of the factors causing variation using nested ANOVA (analysis of variance) or RMSD does not assume normality or any other statistical distributions for the model effects. However, when any statistical test is used for testing differences between means or medians or confidence intervals are to be estimated, assumptions of normal distributions for the effects of the model are needed.
Variance components
In 1861, the astronomer Airy [60] pioneered in elucidating and reporting that random and systematic factors influenced the results of his measurements. In 1918, Ronald Fisher [61] ascribed percentages of the total variation in a genetic trait to its constituent causes and published in 1925 [62] a method of estimating the size of uncertainty from the different factors using sums of squares of deviations from the mean. Analysis of variance is used for inference and applies probability distributions, whereas the analysis of variance components quantifies components of variation by mathematical methods. As Fisher wrote to George Snedecor in 1934 “The analysis of variance is not a mathematical theorem but a simple method of arranging arithmetical facts to isolate and display the essential features of a body of data with the utmost simplicity” [63].
The ISO 5725 series of standards, especially ISO 5725-3:2003 Accuracy (trueness and precision) of measurement methods and results – part 3: Intermediate measures of the precision of a standard measurement method [28] and the R-package for variance component analysis (https://cran.r-project.org/web/packages/VCA/vignettes/VCA_package_vignette.html), together with large general statistical packages such as SPSS and laboratory specific software such as Analyse-IT are especially valuable for estimating components of variation (Figure 2). Even the common task of calculating within and between series components of variation commonly needs improvements [64, 65].
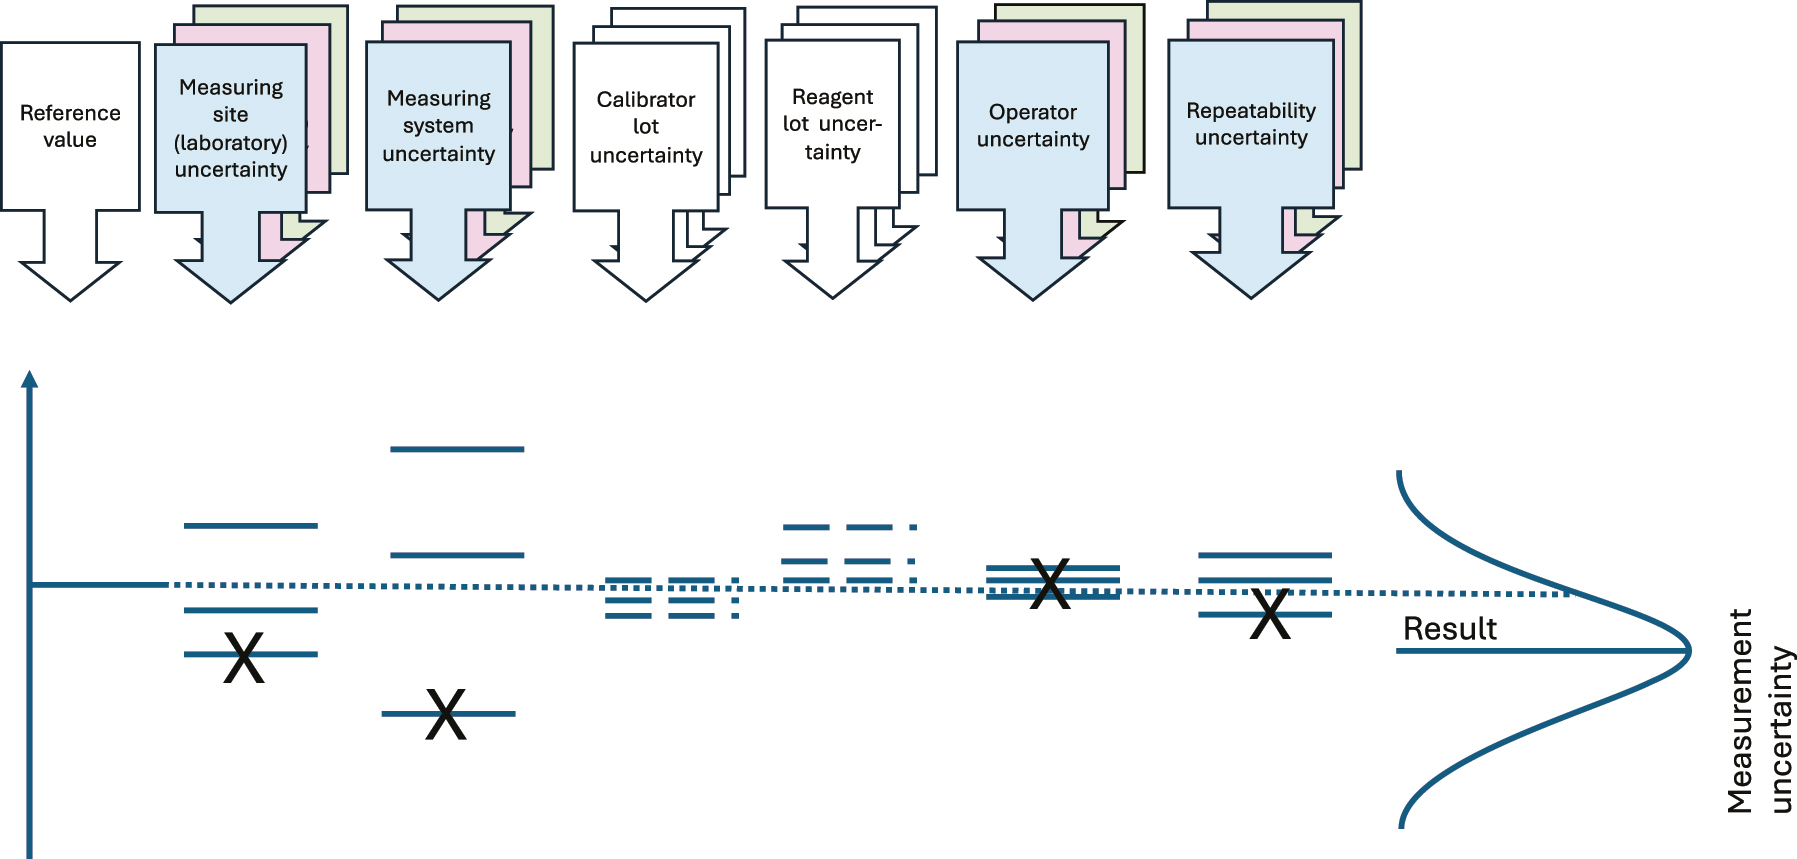
Illustration of the components of variation commonly causing variation when analyzing HS. The colored boxes show variation components normally accounted for in variance component analysis. The calibrator- and reagent lot uncertainties are calculated by the manufacturers, and if there is a single measurement procedure used and a minimum of lot changes, the Figure provided by the manufacturer for the single measuring system intermediate imprecision will include the calibrator- and reagent lot uncertainties.
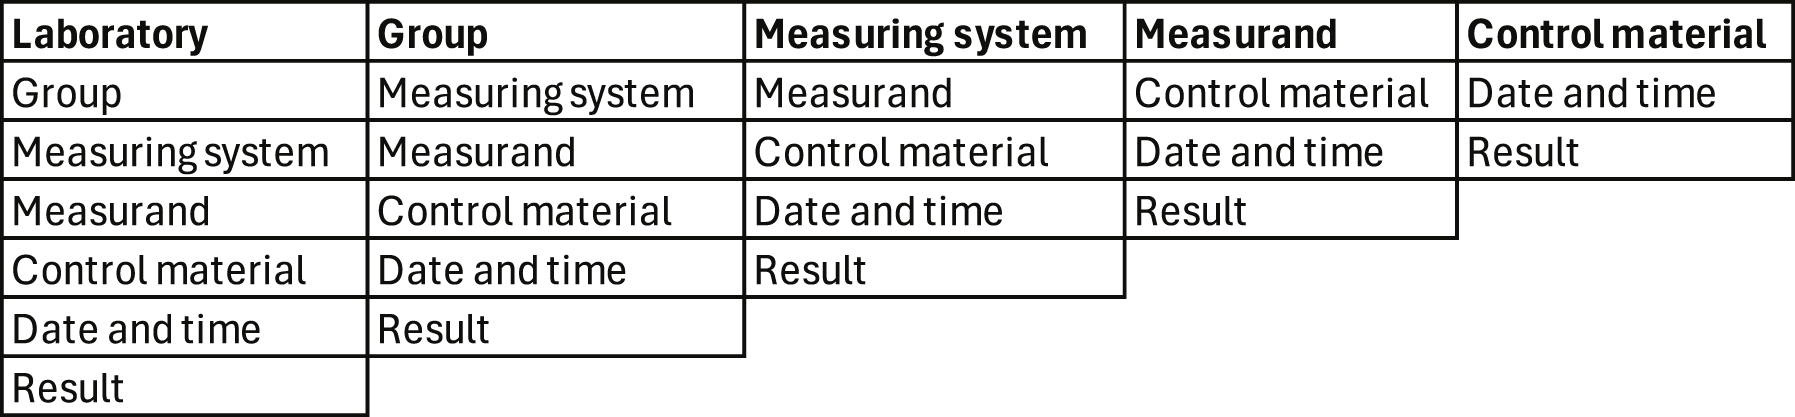
Complex variance component analysis may seem overwhelming and unnecessary. A practical alternative is to use an indexed database with information about the laboratory, groups of measurands, the measuring systems, measurands, control material, date and time, and the results for calculating the within- and between days RMSD [65] in different perspectives (Figure 4) thus indicating the major causes of variation.
Graphical display of the results over time, the mean, and the within- and between-days RMSD of the results in the chosen perspectives provide useful evidence for identifying the most influential factors causing measurement uncertainty (Table 2).
Perspectives when calculating the RMSD [65] in healthcare systems assembling multiple laboratories and measuring systems [66]. The laboratory manager is probably interested in seeing the results of her/his laboratory from the perspective of groups of measurands, measurement systems, measurand, and control materials. The manager of a group of measurands (e.g., hormones) is interested in all control results from a relevant group of measuring systems, etc.
|
An unequal number of results daily (unbalanced data) is common in clinical chemistry and a confounder when calculating within- and between-day RMSD. Using algorithms compensating for this is recommended [65, 67].
Reproducibility measurement uncertainty
Optimizing the quality of the total (pre-analytical/analytical/post-analytical) examination process is the goal. Therefore, going beyond setting APS and establishing examination performance specifications would be desirable. In principle, the performance specifications of the pre- and post-analytical laboratory processes should follow the same models as for APS. When these additional phasesʼ components can be expressed numerically, they could and should be added to the examination performance specifications. In other situations, pre- and post-APS will be best represented by separate quality indicators [9].
As discussed here, APS in healthcare systems assembling multiple laboratories is debatable. Uncertainties estimated by statistical methods, including biological variation and state-of-the-art variation, are conveniently available, established, and understood. Other uncertainties are likely to decrease as concerted efforts reduce pre- and post-analytical variation, measuring systems become more selective, less influenced by matrix effects, and subject to better clinical studies regarding the effects of measurement results on clinical outcomes.
As manufacturers and end-users make the state-of-the-art reproducibility of IVD MD available, it may be tempting to favor the best performers regarding intermediate reproducibility measurement uncertainty, leading indirectly to the elimination of others. However, other important quality perspectives must be considered, such as cost-effectiveness, analytical selectivity, the influence of matrix effects, and convenience. While the patientʼs interests are the prime concern, these need to be balanced against manufacturers’ capability. It is, e.g., not a goal that manufacturers go out of business simply due to intermediate reproducibility performance ranking, thereby limiting the available competition.
Uncertainty of the traceability to higher-order references
The uncertainty of the traceability to higher-order references is usually the most quantitatively important single component of the uncertainty of the measurement results in patient samples [68, 69]. The higher-order references are the linkage of quantities of measurands to SI units, a certified value of a reference material, the value assigned using a reference measurement procedure, the value assigned to an international conventional calibrator, and the values assigned through an international harmonization protocol. The traceability uncertainty to higher-order references is usually in the hands of manufacturers of reference materials, calibrators, and reagents. Results when measuring reference materials from different manufacturers for the same measurand should be equivalent [19]. However, that is not always the case, e.g., due to selectivity- and commutability issues.
Estimates of bias using commutable samples
Equivalent results [19] of measurements of measurands in human samples, measured using different end-user IVD MDs, are essential for applying clinical practice guidelines for diagnosis, treatment, monitoring, or risk assessment. Using human samples to investigate the bias between results from IVD MDs [70], [71], [72], [73] is intuitively appropriate since the sample matrix in human samples is routinely encountered, and single-donor fresh human samples are usually commutable. In proficiency testing schemes involving IVD MDs from numerous manufacturers, matrix effects are usually offered as explanations when bias is found between IVD MDs using stabilized control samples. When claiming commutability for any material, it formally needs to be tested using all involved IVD MD [74]. Using human samples in split sample schemes is a feasible and economical alternative without formal commutability testing. However, possible commutability issues between IVD MDs need to be identified by studies of numerous split samples over weeks and months since human samples are not always commutable.
The use of certified reference materials and reference measurement procedures are the cornerstones of trueness in laboratory medicine. Even though manufacturers use such metrological references, there is always a need to monitor the trueness of end-user IVD MDs, especially since they commonly use measuring systems, calibrators, and reagents from different manufacturers. The chosen monitoring method depends on the available resources, circumstances, measurement systems, and information technology facilities. The more numerous measurement systems and procedures are involved, the more pronounced the need to use direct and indirect patient sample-based monitoring methods to ensure the intended equivalence of measurement results.
In 1965 Hoffmann and Waid proposed the “average of normals” method (AON) for detecting bias in laboratory medicine [75]. They truncated the results by only including results within the central 95 % reference interval when calculating daily mean values. AON is especially valuable for measurands with low biological variation. In 1974 Bull and Elashoff [76, 77] introduced the weighted moving averages of red blood cell indices of at least 20 patient results and the mean value of the previous batch of 20 values to moderate the variations in the moving average [78]. Weighted moving averages have subsequently become a standard graphical and statistical tool in the software of automated hematology analyzers. As practiced by Hoffman & Waid, the method of moving averages has been shown to have less sensitivity for detecting bias than stable control materials for measurands in clinical chemistry [79], [80], [81]. However, improvements in measurement systems and procedures have enabled a substantially decreased frequency of internal quality control samples analyzed daily to save costs. Improved information technology has simultaneously improved the procedures for implementing various forms of the AON. Tony Badrick and coworkers have even proposed replacing traditional internal quality control with a combination of AON and “real time” External Quality Assurance [78, 82], [83], [84], [85].
In 2018 Linda Thienpont and Dietmar Stöckl presented the Percentiler and Flagger applications, which are well suited for investigating bias [86]. The Percentiler calculates the measuring system-specific daily medians of selected measurands, and the Flagger calculates the percentage of patient results outside the reference limits and evaluates them against the stability limits based on the effect of analytical instability on surrogate medical decisions [86]. A very important and novel property of Percentiler and Flagger is that they enable laboratories to compare their results to other laboratories regionally, nationally, and internationally [87]. Percentiler and Flagger are currently being unified and updated, and the new version will be released shortly [87].
All persons involved in the laboratories should share responsibility for the quality of the measurements of the measurand they are involved in measuring and share access to all necessary quality-related data. In a split-sample scheme for multiple laboratories [30], [31], [32], one IVD MD may be appointed as a mentor/master. Important criteria when appointing such mentors is that their trueness is especially well established, maintained, and monitored, e.g., by participating in proficiency testing schemes, of which at least one is based on reference measurement procedures. Another important criterion for a mentor IVD MD is that it is near a transport hub the laboratories use to send samples to referral laboratories. The point is that the same organization will be used for the split samples as for the samples sent to referral laboratories. Furthermore, since the split-sample scheme increases the number of measurements performed by the mentor IVD MD, the cost per measurement on the mentor IVD MD must be as modest as possible. This means that a reference measurement procedure is seldom the first choice for a mentor IVD MD, even though it serves as a cornerstone in the quality organization of the laboratories. There will be one, and only one, IVD MD appointed for each measurand by the laboratories. The IVD MDs measuring the part of the split sample not sent to the mentor are categorized as adepts (Figure 3).
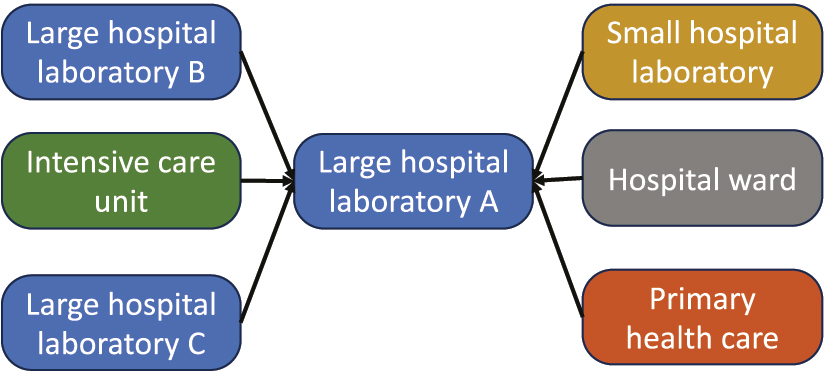
The mentor IVD MD should be located amongst the multiple laboratories so that the same logistic is used for sending samples to referral laboratories as for the split samples.
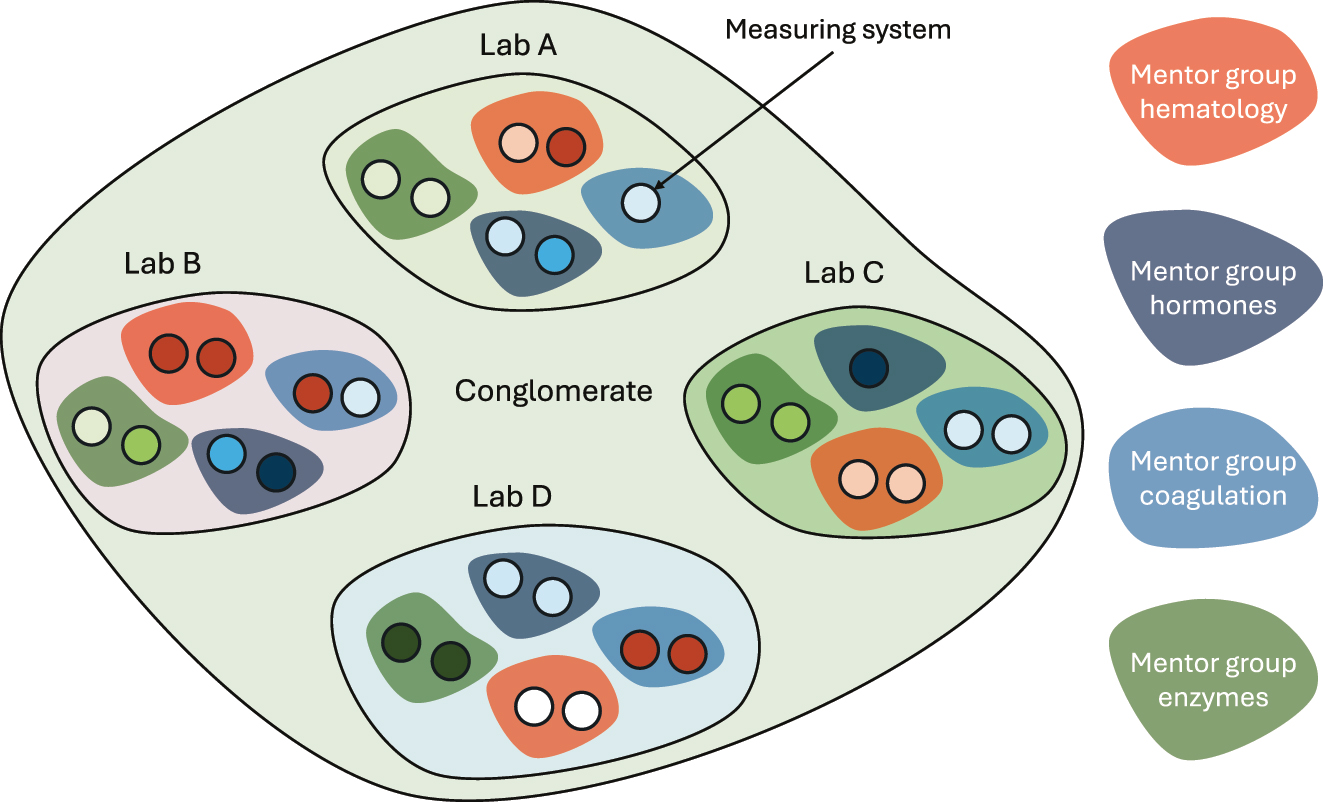
Task structure of laboratories serving a healthcare system. Four laboratories, A to D, and at least four mentor groups are illustrated here. The mentor groups are tasked with fulfilling the overall APS across the laboratories.
Importantly, the fundamental role of EQA is the assessing and reduction of patient risks among several laboratories and IVD MDs. A possible decrease in the number of participating laboratories and IVD MD in a healthcare system based on split-sample measurement results must be carefully considered. The risks in a healthcare system assembling multiple laboratories and IVD MDs are greater than those of a single laboratory and IVD MD.
The laboratories can appoint laboratory professionals to mentor groups for appropriate parts of the assortment of measurands that the laboratory organization provides, e.g., hormones, electrolytes, blood gases, hematology, coagulation, etc. The role of the mentor groups is to monitor and improve the equivalence of the measurement results within their scope of measurands using results of internal quality control, proficiency testing, split-sample schemes, accreditation, analysis of variance component analyses, etc. The mentor groups are primary resources for troubleshooting, corrective actions, and strategic planning within their field. Their task is to ensure the equivalence of laboratory results in the entire healthcare system (Figure 4).
Two main principles must guide which samples are employed as split samples: Samples for a particular measurand should be sent regularly at agreed time intervals, and as much of the concentration intervals seen in the laboratory as possible should be covered within one year. No extra measurement is performed on the part of the split sample of the adept since the actual measurand has already been analyzed in that sample.
Once a decision is made that an already analyzed sample should be a split sample, the sample tube should be labeled with a new bar code number as a split control sample, and the results should be registered in the database for control results. This new label and the information in the laboratory information system should further identify the measurand, the adept IVD MD, the site, the mentor group, and the operator. When the split control sample arrives at the mentor, no handling other than entering the tube into the total automation system should be required [66].
Split samples should not replace participation in proficiency testing due to the need for comparison with laboratories outside the healthcare system, accreditation, and other regulatory requirements. However, a comprehensively performed split sample scheme combined with a well-designed internal quality control scheme using stabilized materials can reduce the number of IVD MDs required to participate in proficiency testing schemes.
A proper estimate of bias requires replicates of measurements of reference samples [30, 88]. A single measurement of a split sample by an adept and a mentor represents only one of the many data required to establish that a bias is present. Furthermore, some samples may present matrix effects, requiring the elimination of outliers [69]. Since the concentrations in the split samples vary over the common measurement intervals in the human sample, each pair of adept-mentor result analysis is therefore normalized as follows:
to show the relative bias as a percentage. Importantly, the original adept and mentor results must be registered with the normalized results to display and calculate the effect of the concentration level.
Knowledge of the precision profile of measurement systems is crucial for interpreting bias and imprecision [89], [90], [91], including the study of normalized results of the measurement of split samples. A recent R-package for calculating comprehensive precision profiles is available [92]. Identifying the relative influence of the quantitatively most important components of measurement uncertainty for the measurands in a healthcare system provides crucial quality improvement tools. Minimizing the number of different IVD MD used and purchasing larger reagents and calibrator lots contribute to minimizing the risk of bias and its contribution to measurement uncertainty.
For information
The theoretical approaches and practical implementations described in the manuscript were programmed and implemented in a client-server computer system QM, originally developed from 1995 to 2002, earlier described, e.g. in [31, 66]. The system is widely used in the Nordic countries.
-
Research ethics: Not applicable.
-
Informed consent: Not applicable.
-
Author contributions: The author has accepted responsibility for the entire content of this manuscript and approved its submission.
-
Competing interests: The author states no conflict of interest.
-
Research funding: None declared.
-
Data availability: Not applicable.
References
1. Laessig, RH. Medical need for quality specifications within laboratory medicine. Ups J Med Sci 1990;95:233–44. https://doi.org/10.3109/03009739009178595.Search in Google Scholar PubMed
2. Tonks, DB. A study of the accuracy and precision of clinical chemistry determinations in 170 Canadian laboratories. Clin Chem 1963;9:217–33. https://doi.org/10.1093/clinchem/9.2.217.Search in Google Scholar
3. Büttner, J. History of clinical chemistry. Berlin, New York: Walter de Gruyter; 1983.Search in Google Scholar
4. Elevitch, FR. Proceedings of the 1976 Aspen conference on analytical goals in clinical chemistry. In: Analytical goals in clinical chemistry. Skokie, Il: College of American Pathologists; 1977.Search in Google Scholar
5. Elevitch, FR. Analytical goals in clinical chemistry: their relationship to medical care. Am J Clin Pathol 1979;71:624–30.10.1093/ajcp/71.6.624Search in Google Scholar
6. de Verdier, CH, Groth, T, Hyltoft Petersen, P. Medical need for quality specifications--a NORDKEM project for selecting the appropriate quality in clinical laboratories. Scand J Clin Lab Invest 1993;215:29–37. https://doi.org/10.3109/00365519309090695.Search in Google Scholar PubMed
7. Kenny, D, Fraser, CG, Petersen, PH, Kallner, A. Consensus agreement. Scand J Clin Lab Invest 1999;59:585. https://doi.org/10.1080/00365519950185409.Search in Google Scholar
8. Fraser, CG. The 1999 Stockholm Consensus Conference on quality specifications in laboratory medicine. Clin Chem Lab Med 2015;53:837–40. https://doi.org/10.1515/cclm-2014-0914.Search in Google Scholar PubMed
9. Sandberg, S, Fraser, CG, Horvath, AR, Jansen, R, Jones, G, Oosterhuis, W, et al.. Defining analytical performance specifications: consensus statement from the 1st strategic conference of the European federation of clinical chemistry and laboratory medicine. Clin Chem Lab Med 2015;53:833–5. https://doi.org/10.1515/cclm-2015-0067.Search in Google Scholar PubMed
10. JCGM. Evaluation of measurement data — guide to the expression of uncertainty in measurement. JCGM 100:2008, GUM 1995 with minor corrections. Joint Committee for Guides in Metrology; 2008. Available from: http://www.bipm.org/utils/common/documents/jcgm/JCGM_100_2008_E.pdf.Search in Google Scholar
11. Westgard, JO, Carey, RN, Wold, S. Criteria for judging precision and accuracy in method development and evaluation. Clin Chem 1974;20:825–33. https://doi.org/10.1093/clinchem/20.7.825.Search in Google Scholar
12. Bureau International des Poids et Mesures. International vocabulary of metrology — basic and general concepts and associated terms (VIM 3). https://www.bipm.org/utils/common/documents/jcgm/JCGM_200_2012.pdf [Accessed 8 Apr 2019].Search in Google Scholar
13. Jones, GRD, Albarede, S, Kesseler, D, MacKenzie, F, Mammen, J, Pedersen, M, et al.. Analytical performance specifications for external quality assessment - definitions and descriptions. Clin Chem Lab Med 2017;55:949–55. https://doi.org/10.1515/cclm-2017-0151.Search in Google Scholar PubMed
14. Jones, GR. Analytical performance specifications for EQA schemes - need for harmonisation. Clin Chem Lab Med 2015;53:919–24. https://doi.org/10.1515/cclm-2014-1268.Search in Google Scholar PubMed
15. Thelen, MHM, Jansen, RTP, Weykamp, CW, Steigstra, H, Meijer, R, Cobbaert, CM. Expressing analytical performance from multi-sample evaluation in laboratory EQA. Clin Chem Lab Med 2017;55:1509–16. https://doi.org/10.1515/cclm-2016-0970.Search in Google Scholar PubMed
16. Thompson, M, Fearn, T. What exactly is fitness for purpose in analytical measurement? Analyst 1996;121:275–8. https://doi.org/10.1039/an9962100275.Search in Google Scholar
17. CLSI. EP54-A-IR verification of comparability of patient results within one health care system; approved guideline (interim revision). Wayne, PA: Clinical and Laboratory Standards Institute; 2012.Search in Google Scholar
18. CLSI. EP31-A-IR verification of comparability of patient results within one health care system; approved guidelines (interim revision). Wayne, PA: Clinical and Laboratory Standards Institute; 2017.Search in Google Scholar
19. ISO 17511:2020. In vitro diagnostic medical devices — requirements for establishing metrological traceability of values assigned to calibrators, trueness control materials and human samples. In: Technical Committee, editors. ISO/TC 212 clinical laboratory testing and in vitro diagnostic test systems. Geneva, Switzerland: International Organization for Standardization; 2020.Search in Google Scholar
20. Willink, R. An approach to uncertainty analysis emphasizing a natural expectation of a client. Adv Math Comput Tools Metrol VII 2006;72:344–9. https://doi.org/10.1142/9789812774187_0046.Search in Google Scholar
21. De Bievre, P. Fitness for purpose is different from a performance specification. Accred Qual Assur 2007;12:501. https://doi.org/10.1007/s00769-007-0312-3.Search in Google Scholar
22. Vessman, J, Stefan, RI, Van Staden, JF, Danzer, K, Lindner, W, Burns, DT, et al.. Selectivity in analytical chemistry - (IUPAC Recommendations 2001). Pure Appl Chem 2001;73:1381–6. https://doi.org/10.1351/pac200173081381.Search in Google Scholar
23. Rappold, BA. Mass spectrometry selectivity, specifically. Clin Chem 2016;62:154–6. https://doi.org/10.1373/clinchem.2015.240614.Search in Google Scholar PubMed
24. Valcarcel, M, Rios, A. Selectivity in analytical-chemistry. Analysis 1990;18:469–75.Search in Google Scholar
25. Rigo-Bonnin, R, Munoz-Provencio, D, Canalias, F. Reference change values based on uncertainty models. Clin Biochem 2020;80:31–41. https://doi.org/10.1016/j.clinbiochem.2020.03.016.Search in Google Scholar PubMed
26. Magnusson, B, Ossowicki, H, Rienitz, O, Theodorsson, E. Routine internal- and external-quality control data in clinical laboratories for estimating measurement and diagnostic uncertainty using GUM principles. Scand J Clin Lab Invest 2012;72:212–20. https://doi.org/10.3109/00365513.2011.649015.Search in Google Scholar PubMed
27. ISO 5725-1:2003. Accuracy (trueness and precision) of measurement methods and results: part 1: general principles and definitions. In: Technical Committee, editors. ISO/TC 69/SC 6 measurement methods and results. Geneva, Switzerland: International Organization for Standardization; 2003.Search in Google Scholar
28. ISO 5725-3:2003. Accuracy (trueness and precision) of measurement methods and results: intermediate measures of precision of a standard measurement method. In: Technical Committee, editors. ISO/TC 69/SC 6 measurement methods and results. Geneva, Switzerland: International Organization for Standardization; 2003.Search in Google Scholar
29. Fraser, CG, Petersen, PH. The importance of imprecision. Ann Clin Biochem 1991;28:207–11. https://doi.org/10.1177/000456329102800301.Search in Google Scholar PubMed
30. Theodorsson, E, Magnusson, B, Leito, I. Bias in clinical chemistry. Bioanalysis 2014;6:2855–75. https://doi.org/10.4155/bio.14.249.Search in Google Scholar PubMed
31. Theodorsson, E. Validation and verification of measurement methods in clinical chemistry. Bioanalysis 2012;4:305–20. https://doi.org/10.4155/bio.11.311.Search in Google Scholar PubMed
32. Theodorsson, E. Quality assurance in clinical chemistry: a touch of statistics and a lot of common sense. J Med Biochem 2016;35:103–12. https://doi.org/10.1515/jomb-2016-0012.Search in Google Scholar PubMed PubMed Central
33. Milinkovic, N, Ignjatovic, S, Sumarac, Z, Majkic-Singh, N. Uncertainty of measurement in laboratory medicine. J Med Biochem 2018;37:279–88. https://doi.org/10.2478/jomb-2018-0002.Search in Google Scholar PubMed PubMed Central
34. Kallner, A, Theodorsson, E. An experimental study of methods for the analysis of variance components in the inference of laboratory information. Scand J Clin Lab Invest 2020;80:73–80. https://doi.org/10.1080/00365513.2019.1700426.Search in Google Scholar PubMed
35. Coskun, A. Bias in laboratory medicine: the dark side of the moon. Ann Lab Med 2024;44:6–20. https://doi.org/10.3343/alm.2024.44.1.6.Search in Google Scholar PubMed PubMed Central
36. ISO/TS 20914:2019. Medical laboratories — practical guidance for the estimation of measurement uncertainty. Geneva: The International Organization for Standardization; 2019.Search in Google Scholar
37. Plebani, M, Zaninotto, M. Lot-to-lot variation: no longer a neglected issue. Clin Chem Lab Med 2022;60:645–6. https://doi.org/10.17116/labs2022110315.Search in Google Scholar
38. Loh, TP, Sandberg, S, Horvath, AR. Lot-to-lot reagent verification: challenges and possible solutions. Clin Chem Lab Med 2022;60:675–80. https://doi.org/10.1515/cclm-2022-0092.Search in Google Scholar PubMed
39. Braga, F, Pasqualetti, S, Borrillo, F, Capoferri, A, Chibireva, M, Rovegno, L, et al.. Definition and application of performance specifications for measurement uncertainty of 23 common laboratory tests: linking theory to daily practice. Clin Chem Lab Med 2023;61:213–23. https://doi.org/10.1515/cclm-2022-0806.Search in Google Scholar PubMed
40. Bais, R, Armbruster, D, Jansen, RT, Klee, G, Panteghini, M, Passarelli, J, et al.. Defining acceptable limits for the metrological traceability of specific measurands. Clin Chem Lab Med 2013;51:973–9. https://doi.org/10.1515/cclm-2013-0122.Search in Google Scholar PubMed
41. Lawrynowicz, K. Friedrich Wilhelm Bessel 1784-1846. Basel: Birkhäuser Verlag; 1995.10.1007/978-3-0348-9069-4Search in Google Scholar
42. Pearson, ES. Studies in the history of probability and statistics. XIV some incidents in the early history of biometry and statistics, 1890-94. Biometrika 1965;52:3–18. https://doi.org/10.2307/2333808.Search in Google Scholar
43. Magnello, ME. Karl Pearsonʼs Gresham lectures: W.F.R. Weldon, speciation and the origins of Pearsonian statistics. Brit J Hist Sci 1996;29:43–63. https://doi.org/10.1017/s0007087400033859.Search in Google Scholar PubMed
44. Stigler, SM. The history of statistics. The measurement of uncertainity before 1900. Cambridge, Massachusetts: The Belknap Press of Harvard University Press; 1986.Search in Google Scholar
45. Pearson, K. Contributions to the mathemathical theory of evolution. Philos Trans R Soc London A 1894;185:71–110.10.1098/rsta.1894.0003Search in Google Scholar
46. Willmott, CJ, Matsuura, K, Robeson, SM. Ambiguities inherent in sums-of-squares-based error statistics. Atmos Environ 2009;43:749–52. https://doi.org/10.1016/j.atmosenv.2008.10.005.Search in Google Scholar
47. Chai, T, Draxler, RR. Root mean square error (RMSE) or mean absolute error (MAE)? - arguments against avoiding RMSE in the literature. Geosci Model Dev 2014;7:1247–50. https://doi.org/10.5194/gmd-7-1247-2014.Search in Google Scholar
48. Willmott, CJ, Matsuura, K. Advantages of the mean absolute error (MAE) over the root mean square error (RMSE) in assessing average model performance. Clim Res 2005;30:79–82. https://doi.org/10.3354/cr030079.Search in Google Scholar
49. Bundesärztekammer. Revision of the “guideline of the German medical association on quality assurance in medical laboratory examinations – RiliBAEK”. J Lab Med 2015;39:26–69.10.1515/labmed-2014-0046Search in Google Scholar
50. Bundesärztekammer. Richtlinie der Bundesärztekammer zur Qualitätssicherung laboratoriumsmedizinischer Untersuchungen Gemäß dem Beschluss des Vorstands der Bundesärztekammer vom 11.04.2014 und 20.06.2014. Dtsch Ärztebl 2014;111:A1583–618.Search in Google Scholar
51. Nordin, G, Dybkaer, R, Forsum, U, Fuentes-Arderiu, X, Pontet, F. Vocabulary on nominal property, examination, and related concepts for clinical laboratory sciences (IFCC-IUPAC Recommendations 2017). Pure Appl Chem 2018;90:913–35. https://doi.org/10.1515/pac-2011-0613.Search in Google Scholar
52. Shewhart, WA. Statistical method from the viewpoint of quality control. New York: Dover Publications; 1939.Search in Google Scholar
53. Shewhart, WA. Economic control of quality of manufactured product. New York: D. Van Nostrand Company; 1923.Search in Google Scholar
54. MacDonald, R. Quality assessment of quantitative analytical results in laboratory medicine by root mean square of measurement deviation. J Lab Med 2006;30:111–7. https://doi.org/10.1515/jlm.2006.018.Search in Google Scholar
55. Coskun, A, Theodorsson, E, Oosterhuis, WP, Sandberg, S, European Federation of Clinical C, Laboratory Medicine T, et al.. Measurement uncertainty for practical use. Clin Chim Acta 2022;531:352–60. https://doi.org/10.1016/j.cca.2022.04.1003.Search in Google Scholar PubMed
56. Wald, A. Statistical decision functions. New York: John Wiley & Sons, Inc.; 1950.Search in Google Scholar
57. Fisher, LEL. Neyman, and the creation of classical statistics. New York, NY: Springer; 2011, vol viii:115 p.Search in Google Scholar
58. Searle, SR, Casella, G, McCullogh, CE. Variance components. New York: John Wiley & Sons, Inc.; 1992.10.1002/9780470316856Search in Google Scholar
59. Acree, MC. The myth of statistical inference. Switzerland: Springer Nature; 2021.10.1007/978-3-030-73257-8Search in Google Scholar
60. Airy, GB. On the algebraical and numerical theory of errors of observations and the combinations of observations. Cambridge and London: Macmillan and Co.; 1861, vol xvi:103 p.Search in Google Scholar
61. Fisher, RA The correlation between relatives on the supposition of Mendelian inheritance. Edinburgh: Transactions of the Royal Society; 1918, vol 52:399–433 pp.10.1017/S0080456800012163Search in Google Scholar
62. Fisher, RA. Statistical methods for research workers. Edinburgh, London: Oliver and Boyd; 1925, vol ix:1 p.Search in Google Scholar
63. Searle, SR, Casella, G, McCullogh, CE. Variance components. New York: John Wiley & Sons, Inc.; 2006.Search in Google Scholar
64. Krouwer, JS. Observations on comparisons of within-run and day-to-day precision. Clin Chem 1981;27:202. https://doi.org/10.1093/clinchem/27.1.202a.Search in Google Scholar
65. Aronsson, T, Groth, T. Nested control procedures for internal analytical quality control. Theoretical design and practical evaluation. Scand J Clin Lab Invest Suppl 1984;172:51–64.Search in Google Scholar
66. Norheim, S. Computer support simplifying uncertainty estimation using patient samples. Sweden: Department of Biomedical Engineering, Linkoping University; 2008. Available from: http://liu.diva-portal.org/smash/record.jsf?pid=diva2:417298.Search in Google Scholar
67. Sahai, H, Ojeda, MM. Analysis of variance for random models: volume II, unbalanced data: theory, methods, applications, and data analysis. Boston: Birkhäuser; 2004.10.1007/978-0-8176-8168-5Search in Google Scholar
68. ISO 17511:2003. In vitro diagnostic medical devices – measurement of quantities in biological samples – metrological traceability of values assigned to calibrators and control materials. Technical Committee CEN/TC 140 In vitro diagnostic devices in collaboration with Tecnical Committee ISO/TC 212 clinical laboratory testing and in vitro diagnostic test systems. Geneva, Switzerland: International Organization for Standardization; 2003.Search in Google Scholar
69. ISO 21151:2020. In vitro diagnostic medical devices — requirements for International harmonisation protocols establishing metrological traceability of values assigned to calibrators and human samples. In: Technical Committee, editors. ISO/TC 212 clinical laboratory testing and in vitro diagnostic test systems. Geneva, Switzerland: International Organization for Standardization; 2020.Search in Google Scholar
70. Shahangian, S, Cohn, RD, Gaunt, EE, Krolak, JM. System to monitor a portion of the total testing process in medical clinics and laboratories: evaluation of a split-specimen design. Clin Chem 1999;45:269–80. https://doi.org/10.1093/clinchem/45.2.269.Search in Google Scholar
71. Connett, JE, Lee, WW. Estimation of the coefficient of variation from laboratory analysis of split specimens for quality-control in clinical-trials. Contr Clin Trials 1990;11:24–36. https://doi.org/10.1016/0197-2456(90)90029-2.Search in Google Scholar PubMed
72. Miller, WG. Specimen materials, target values and commutability for external quality assessment (proficiency testing) schemes. Clin Chim Acta 2003;327:25–37. https://doi.org/10.1016/s0009-8981(02)00370-4.Search in Google Scholar PubMed
73. Miller, WG, Jones, GR, Horowitz, GL, Weykamp, C. Proficiency testing/external quality assessment: current challenges and future directions. Clin Chem 2011;57:1670–80. https://doi.org/10.1373/clinchem.2011.168641.Search in Google Scholar PubMed
74. Evaluation of commutability of processed samples, 4th ed. Malvern, PA: Clinical and Laboratory Standards Institute; 2022.Search in Google Scholar
75. Hoffmann, RG, Waid, ME. The “average of normals” method of quality control. Am J Clin Pathol 1965;43:134–41. https://doi.org/10.1093/ajcp/43.2.134.Search in Google Scholar PubMed
76. Bull, B, Elashoff, RM. The use of patient-derived hematology data in quality control. Proc San Diego Biomed Symp 1974;13:515–9.Search in Google Scholar
77. Bull, BS, Elashoff, RM, Heilborn, DC, Couperus, J. A study of various estimators for the derivation of quality control procedures from patient erythrocyte indices. Am J Clin Pathol 1974;61:473–81. https://doi.org/10.1093/ajcp/61.4.473.Search in Google Scholar PubMed
78. Zhou, QQ, Loh, ZP, Badrick, T, Lim, CYE. Impact of combining data from multiple instruments on performance of patient-based real-time quality control. Biochem Med 2021;31:1–7. https://doi.org/10.11613/BM.2021.020705.Search in Google Scholar PubMed PubMed Central
79. Kilgariff, M, Owen, JA. An assessment of the “average of normals” quality conrol method. Clin Chim Acta 1968;19:175–9. https://doi.org/10.1016/0009-8981(68)90324-0.Search in Google Scholar PubMed
80. Amador, E, Hsi, BP, Massod, MF. An evaluation of the “average of normals” and related methods of quality control. Am J Clin Pathol 1968;50:369–78. https://doi.org/10.1093/ajcp/50.3.369.Search in Google Scholar PubMed
81. Cembrowski, GS, Chandler, EP, Westgard, JO. Assessment of “Average of Normals” quality control procedures and guidelines for implementation. Am J Clin Pathol 1984;81:492–9. https://doi.org/10.1093/ajcp/81.4.492.Search in Google Scholar PubMed
82. Badrick, T, Graham, P. Can a combination of average of normals and “real time” external quality assurance replace internal quality control? Clin Chem Lab Med 2018;56:549–53. https://doi.org/10.1515/cclm-2017-0115.Search in Google Scholar PubMed
83. van Rossum, HH, Bietenbeck, A, Cervinski, MA, Katayev, A, Loh, TP, Badrick, TC. Benefits, limitations and controversies on patient-based real-time quality control (PBRTQC) and the evidence behind the practice. Clin Chem Lab Med 2021;59:1213–20. https://doi.org/10.1515/cclm-2021-0072.Search in Google Scholar PubMed
84. Loh, TP, Bietenbeck, A, Cervinski, MA, van Rossum, HH, Katayev, A, Badrick, T, et al.. Recommendation for performance verification of patient-based real-time quality control. Clin Chem Lab Med 2020;58:1205–13. https://doi.org/10.1515/cclm-2019-1024.Search in Google Scholar PubMed
85. Badrick, T, Bietenbeck, A, Cervinski, MA, Katayev, A, van Rossum, HH, Loh, TP, et al.. Patient-based real-time quality control: review and recommendations. Clin Chem 2019;65:962–71. https://doi.org/10.1373/clinchem.2019.305482.Search in Google Scholar PubMed
86. Thienpont, LM, Stockl, D. Percentiler and Flagger - low-cost, on-line monitoring of laboratory and manufacturer data and significant surplus to current external quality assessment. J Lab Med 2018;42:289–96. https://doi.org/10.1515/labmed-2018-0030.Search in Google Scholar
87. NOKLUS. The percentiler and flagger programs. Bergen, Norway: NOKLUS. https://www.noklus.no/en/the-percentiler-and-flagger-programs/ [Accessed 16 Oct 2023].Search in Google Scholar
88. Becker, D, Christensen, R, Currie, L, Diamondstone, K, Eberhardt, KR, Gills, T, et al.. Use of NIST standard reference materials for decisions on performance of analytical chemical methods and laboratories. Gaithersburg: National Institute of Standards and Technology; 1992.10.6028/NIST.SP.829Search in Google Scholar
89. Sanchez-Alvarez, J, Cano-Corres, R, Corral-Comesana, S, Fuentes-Arderiu, X. Heteroscedasticity and homoscedasticity, and precision profiles in clinical laboratory sciences. Clin Chim Acta 2011;412:2351–2. https://doi.org/10.1016/j.cca.2011.08.005.Search in Google Scholar PubMed
90. Sadler, WA, Smith, MH. Use and abuse of imprecision profiles - some pitfalls illustrated by computing and plotting confidence-intervals. Clin Chem 1990;36:1346–50. https://doi.org/10.1093/clinchem/36.7.1346.Search in Google Scholar
91. Kallner, A, Petersmann, A, Nauck, M, Theodorsson, E. Measurement repeatability profiles of eight frequently requested measurands in clinical chemistry determined by duplicate measurements of patient samples. Scand J Clin Lab Invest 2020;80:202–9. https://doi.org/10.1080/00365513.2020.1716266.Search in Google Scholar PubMed
92. Schuetzenmeister, A. Precision profiles with R-package VFP. 2022. Available from: https://cran.r-project.org/web/packages/VFP/vignettes/VFP_package_vignette.html.Search in Google Scholar
© 2024 Walter de Gruyter GmbH, Berlin/Boston
Articles in the same Issue
- Frontmatter
- Editorial
- Analytical performance specifications – moving from models to practical recommendations
- Opinion Papers
- What the Milan conference has taught us about analytical performance specification model definition and measurand allocation
- The role of analytical performance specifications in international guidelines and standards dealing with metrological traceability in laboratory medicine
- How clinical laboratories select and use Analytical Performance Specifications (APS) in Italy
- Outcome-based analytical performance specifications: current status and future challenges
- Analytical performance specifications based on biological variation data – considerations, strengths and limitations
- State-of-the-art model for derivation of analytical performance specifications: how to define the highest level of analytical performance technically achievable
- Analytical performance specifications for combined uncertainty budget in the implementation of metrological traceability
- When bias becomes part of imprecision: how to use analytical performance specifications to determine acceptability of lot-lot variation and other sources of possibly unacceptable bias
- Using analytical performance specifications in a medical laboratory
- Issues in assessing analytical performance specifications in healthcare systems assembling multiple laboratories and measuring systems
- Applying the Milan models to setting analytical performance specifications – considering all the information
- Guidelines and Recommendations
- Recommendations for blood sampling in emergency departments from the European Society for Emergency Medicine (EUSEM), European Society for Emergency Nursing (EuSEN), and European Federation of Clinical Chemistry and Laboratory Medicine (EFLM) Working Group for the Preanalytical Phase. Executive summary
- General Clinical Chemistry and Laboratory Medicine
- Assessment of accuracy of laboratory testing results, relative to peer group consensus values in external quality control, by bivariate z-score analysis: the example of D-Dimer
- The stability of 65 biochemistry analytes in plasma, serum, and whole blood
- Assessment of the 2023 European Kidney Function Consortium (EKFC) equations in a Chinese adult population
- In vitro, in vivo metabolism and quantification of the novel synthetic opioid N-piperidinyl etonitazene (etonitazepipne)
- Quantification of blood glial fibrillary acidic protein using a second-generation microfluidic assay. Validation and comparative analysis with two established assays
- Association of prehospital lactate levels with base excess in various emergencies – a retrospective study
- Reference Values and Biological Variations
- Stability of ten serum tumor markers after one year of storage at −18°C
- Variations in tumor growth, intra-individual biological variability, and the interpretation of changes
- Cancer Diagnostics
- N-linked glycosylation of the M-protein variable region: glycoproteogenomics reveals a new layer of personalized complexity in multiple myeloma
- Cardiovascular Diseases
- Reference intervals for high sensitivity cardiac troponin I and N-terminal pro-B-type natriuretic peptide in children and adolescents on the Siemens Atellica
- Infectious Diseases
- Fetal chronic hypoxia does not affect urinary presepsin levels in newborns at birth
- Letters to the Editor
- AWMF statement on medical services in laboratory diagnostics and pathology with regard to the IVDR
- An outline of measurement uncertainty of total protein in urine estimated according to the ISO Technical Specification 20914
- Early diagnosis of severe illness in an outpatient – the Sysmex XN’s neutrophil reactivity parameter
- Analytical and diagnostic performance of Theradiag i-Tracker assays on IDS-iSYS for infliximab and adalimumab therapeutic drug monitoring
- Improving the diagnosis of AATD with aid of serum protein electrophoresis: a prospective, multicentre, validation study
- Cerebrospinal fluid kappa free light chains in patients with tumefactive demyelination
- Diagnostic value of quantitative chemiluminescence immunoassay for anti-gp210 and anti-sp100 antibodies in primary biliary cholangitis