The role of analytical performance specifications in international guidelines and standards dealing with metrological traceability in laboratory medicine
-
W. Greg Miller


Abstract
The goal of metrological traceability is to have equivalent results for a measurand in clinical samples (CSs) irrespective of the in-vitro diagnostic medical device (IVD-MD) used for measurements. The International Standards Organization standard 17511 defines requirements for establishing metrological traceability of values assigned to calibrators, trueness control materials and human samples used with IVD-MDs. Each step in metrological traceability has an uncertainty associated with the value assigned to a material. The uncertainty at each step adds to the uncertainty from preceding steps such that the combined uncertainty gets larger at each step. The combined uncertainty for a CS result must fulfil an analytical performance specification (APS) for the maximum allowable uncertainty (umaxCS). The umaxCS can be partitioned among the steps in a metrological traceability calibration hierarachy to derive the APS for maximum allowable uncertainty at each step. Similarly, the criterion for maximum acceptable noncommutability bias can be derived from the umaxCS. One of the challenges in determining if umaxCS is fulfilled is determining the repeatability uncertainty (uRw) from operating an IVD-MD within a clinical laboratory. Most of the current recommendations for estimating uRw from internal quality control data do not use a sufficiently representative time interval to capture all relevant sources of variability in measurement results. Consequently, underestimation of uRw is common and may compromise assessment of how well current IVD-MDs and their supporting calibration hierarchies meet the needs of clinical care providers.
Background
The goal of metrological traceability is to have equivalent results for a measurand in clinical samples (CSs) irrespective of the end-user in-vitro diagnostic medical device (IVD-MD) used to make the measurements. Equivalent means results within a measurement uncertainty (MU) consistent with an acceptable risk of harm from decisions based on a laboratory test result. An analytical performance specification (APS) for the maximum allowable uncertainty in a clinical sample result (umaxCS) defines what is an acceptable risk of harm from decisions based on a laboratory test result. Setting an APS for umaxCS is described in the literature [1], [2], [3].
The International Standards Organization (ISO) standard 17511 defines requirements for establishing metrological traceability of values assigned to calibrators, trueness control materials and human samples [4]. Figure 1 shows a calibration hierarchy based on ISO 17511 for a clinical laboratory end-user IVD-MD with metrological traceability to a primary reference material (RM) designated m.1. The designations m.x and p.x in Figure 1 denote materials and procedures, respectively, at each step in the metrological traceability with the number 1 used for the highest-order material or procedure. The top blue components constitute the higher-order materials and procedures which are typically developed by specialized reference material producers or national metrology institutes. The middle orange components are the responsibility of IVD-MD manufacturers. The bottom green clinical laboratory end-user IVD-MD is used to measure clinical samples to produce results for medical care decisions. The end-user calibrator and the IVD-MD are typically produced by a manufacturer and purchased by a clinical laboratory. A clinical laboratory may also develop a measuring system, an IVD-MD, for its own use in which case the laboratory is responsible to establish an appropriate calibration hierarchy. Metrological traceability requires an unbroken chain of calibrations and value assignments from the highest order RM or reference measurement procedure (RMP) to the CS results. Consequently, the CS results are metrologically traceable to the highest order RM or RMP in the calibration hierarchy.
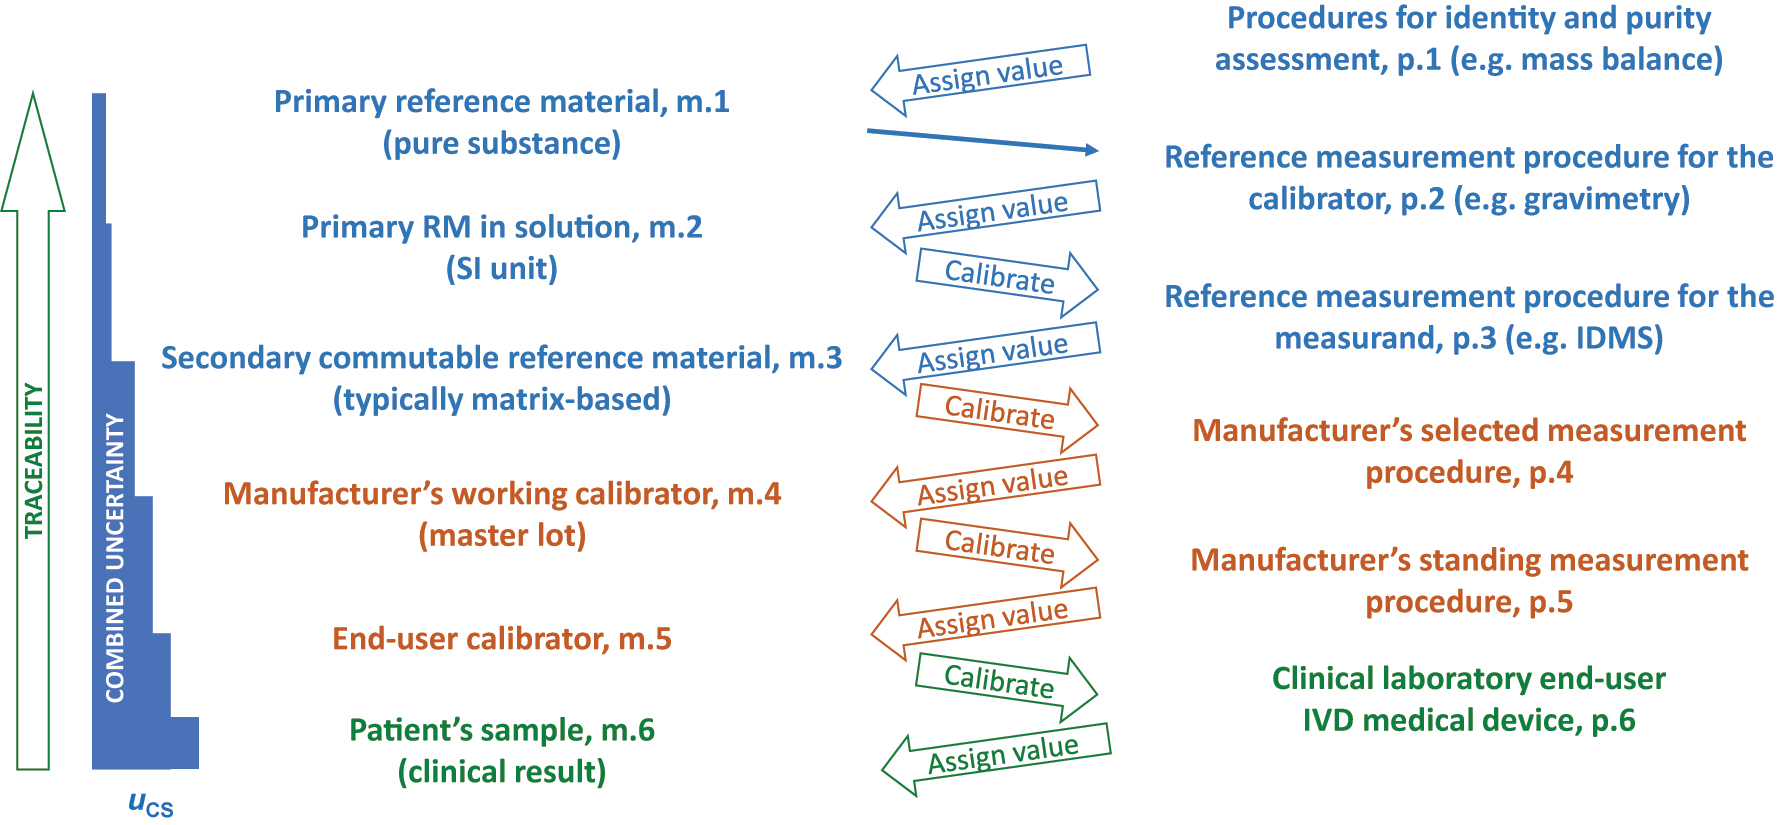
Metrological traceability as defined in ISO 17511:2020. The designations m.x and p.x denote materials and procedures, respectively, at each step in the metrological traceability with the number 1 used for the highest-order material or procedure in the calibration hierarchy.
Also shown in Figure 1 is a combined uncertainty diagram extending from the m.1 primary RM to the CS result. Each step in the calibration hierarchy has an uncertainty associated with the value assigned to a material. The uncertainty at each step adds to the uncertainty from preceding steps such that the combined uncertainty gets larger at each step in the calibration hierarchy. The variance expressed as SD2 or CV2 is what is additive. Consequently, combined u is calculated as
APS for the steps in metrological traceability
The uCS must not exceed the umaxCS for a calibration hierarchy to be fit-for-purpose. ISO 17511 includes several statements similar to the one in clause 4.4.1: “The calibration hierarchy shall be defined as a sequence of consecutive calibrations and value assignments, alternating between fit-for-purpose MPs and RMs (measurement standards or calibrators), beginning with a measurement standard and/or MP and ending with values for the measurand in the intended human samples as determined with the end-user IVD MD.” where MP is measurement procedure [4]. Clearly there is a requirement for the MU at each step to be fit-for-purpose which means its contribution to the combined uCS enables umaxCS to be fit-for-purpose. Once the umaxCS is established for an IVD-MD, APS for the maximum MU for each step in a calibration hierarchy can be established such that the umaxCS is fulfilled. Figure 2 is derived from a well accepted model for setting APS for the MU at intermediate steps in a calibration hierarchy as fractions of the umaxCS [5]. Note that the percent of umaxCS allocated among the intermediate steps of the MU budget can have different values as long as the combined umaxCS is fulfilled. Figure 2 starts with uref which is the combined uncertainty for the m.3 secondary commutable RM in the ISO 17511 diagram in Figure 1 and includes uncertainty from all steps that precede it. The uref includes contributions from all of the higher-order components in the calibration hierarchy. The APS for the next portion of the calibration hierarchy, usys-cal, is also derived from the umaxCS and is allocated for the IVD-MD manufacturer to assign a value to the end-user calibrator whose MU is combined from all preceding steps. The difference in combined uncertainty between the usys-cal and the umaxCS is available for operation of the IVD-MD in a clinical laboratory and is refered to as uRw meaning MU for repeatability from the operation of one IVD-MD within one laboratory. The uRw is intended to include the inherent imprecision of measurements using an end-user IVD-MD, plus contributions from randomly occurring uncorrected small biases such as from recalibration events, reagent lot changes, maintenance procedures and other contributors to measurement variability.
![Figure 2:
Model for a measurement uncertainty budget for steps in metrological traceability showing the main contributing sources of measurement uncertainty and suggested nominal fractions of umaxCS allocated to the combined uncertainty at each step. Adapted from reference [5].](/document/doi/10.1515/cclm-2023-1201/asset/graphic/j_cclm-2023-1201_fig_002.jpg)
Model for a measurement uncertainty budget for steps in metrological traceability showing the main contributing sources of measurement uncertainty and suggested nominal fractions of umaxCS allocated to the combined uncertainty at each step. Adapted from reference [5].
The model for partitioning umaxCS in Figure 2 is useful for setting APS for the steps in metrological traceability but has limitations primarily due to the requirement that significant bias in the calibration hierarchy is intended to be identified and corrected, and the uRw applies for one measuring system within one laboratory. An acceptable risk of harm needs to consider all sources of error that may influence a laboratory test result. Bias from calibrator lot changes may exceed what is represented in the usys-cal. Figure 3 shows an example of a large bias observed for a calibrator lot change that exceeded the allowable uncertainty for the end-user system calibrator value. This calibrator lot change introduced a −18 % bias in CS results for alpha-1-antitrypsin which would have caused the umaxCS (minimum 6.1 % based on biological variability) to be exceeded and a risk for misdiagnosis of lung or liver disease to occur. The laboratory made a correction for this bias as recommended in ISO Technical Specification 20914 [6] so the results for the CSs were consistent with those from the preceding calibrator lots. Making a bias correction adds uncertainty to the uCS. In this case, the uncertainty of the bias correction was 0.4 % which is small compared to the −18 % bias and allowed the combined uCS to fulfil the umaxCS.
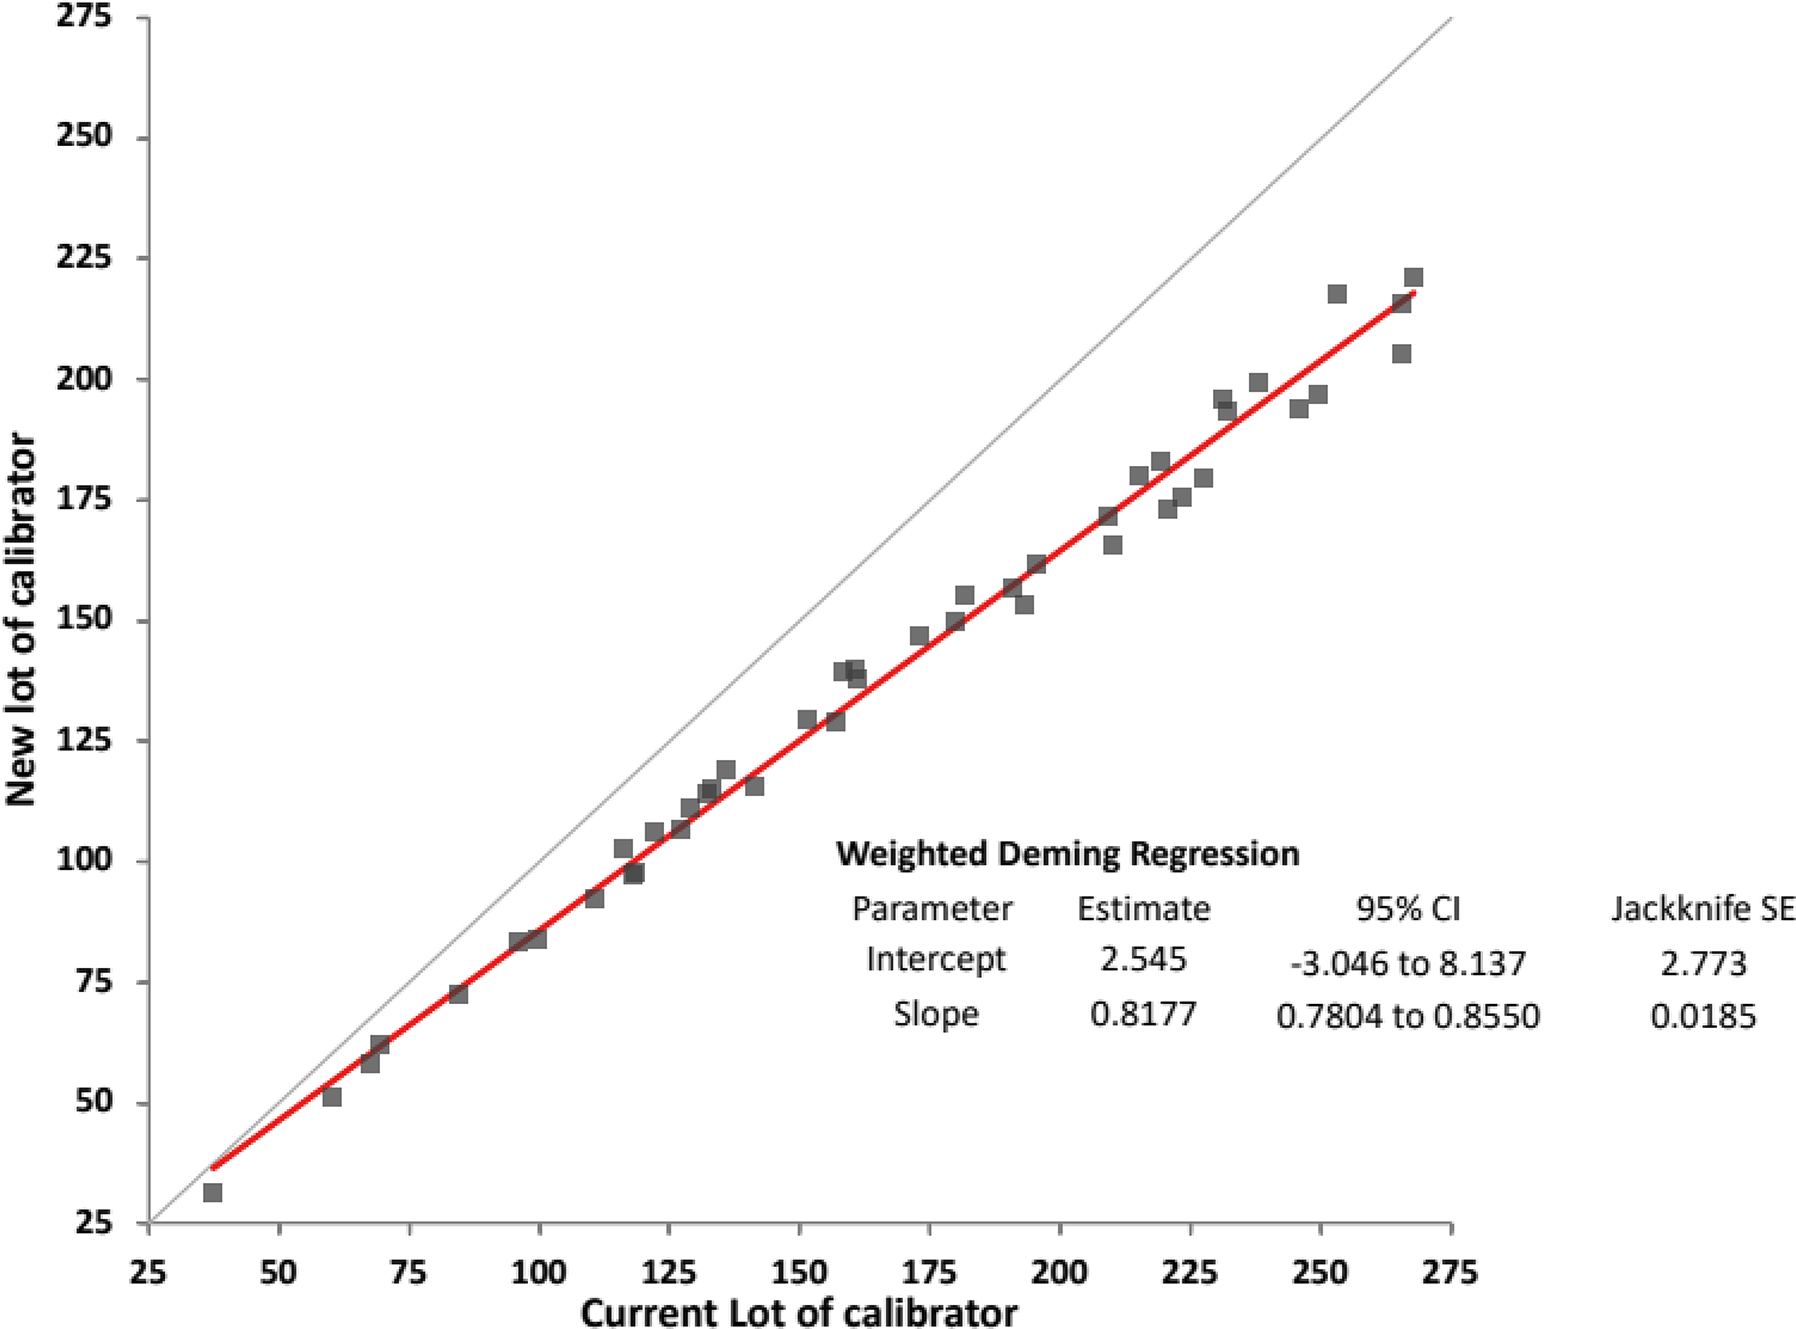
Comparison of alpha-1 antitrypsin results for 44 individual patient samples using calibration with two different lot numbers of calibrator and the same lot number of reagents from Abbott diagnostics using an Architect c8000 instrument.
Additional limitations of the model in Figure 2 relate to uRw applying for one measuring system within one laboratory. Bias may occur among CS results measured using more than one of the same IVD-MD in a laboratory. Bias among CS results measured using different MPs from different IVD-MD manufacturers may occur due to differences and inadequacies in metrological traceability designs and from differences in selectivity for the measurand among different MPs. These influences are not included in umaxCS but reflect real world clinical laboratory operating conditions. In addition, bias from pre-analytical influence may be a factor for some measurands. A health care provider does not care about the source of uncertainty or bias in a lab test result, only that the total error (the combined influence of uCS and bias) is small enough to use the result for medical decisions without an excessive risk of harm for the patients. The concepts of APS for umaxCS and APS for total allowable error are complimentary and both are needed when determining the suitability of IVD-MDs for use in laboratory medicine. An APS for umaxCS may be useful in the context of a single IVD-MD manufacturer producing fit-for-purpose measuring systems and a single clinical laboratory using that IVD-MD correctly. However, an APS for total allowable error may be more useful in the context of delivering an acceptable quality laboratory medicine service for a population receiving care in different locations using different IVD-MDs from different manufacturers.
APS for the commutability of RMs in metrological traceability
An important APS in metrological traceability is for commutability of RMs when a commutable RM is required. A report from the International Federation of Clinical Chemistry and Laboratory Medicine Working Group for Commutability in Metrological Traceability described which RMs used as calibrators in a calibration hierarchy need to be commutable with CSs [7]. In all cases, the m.3 secondary commutable RM in Figure 1 is required to be commutable with CSs. Another report from the same working group described how to establish an APS for commutability as a fraction of the umaxCS [8]. The report added a step for the maximum allowable uncertainty associated with a noncommutability bias (umaxNC) shown in Figure 4 that allows the umaxCS to be fulfilled. A commutability assessment determines if the biases observed among a group of IVD-MDs for RM results are within the biases observed for the CS results among the same group of IVD-MDs [9, 10]. The difference in bias between RM and CS results is called the noncommutability bias which has a discrete value for each particular pair of IVD-MDs in the assessment. However, for a group of IVD-MDs, the distribution of noncommutability biases for a commutable RM is random and the allowable bias range can be expressed as a SD for the distribution of allowable noncommutability biases. Consequently, an umaxNC can be derived as a fraction of the umaxCS. A maximum allowable noncommutability bias (MANCB) criterion can then be determined from the umaxNC and the SD for a rectangular distribution describes the random distribution of individual noncommutability biases for IVD-MDs in a commutability assessment [8]. The same principles for determining umaxNC can be applied for each RM in a calibration hierarchy that is required to be commutable with CS [7].
![Figure 4:
Model for a measurement uncertainty budget that includes an allocation of umaxCS for the maximum allowable contribution from noncommutability of the certified RM (CRM), umaxNC. Adapted from reference [8].](/document/doi/10.1515/cclm-2023-1201/asset/graphic/j_cclm-2023-1201_fig_004.jpg)
Model for a measurement uncertainty budget that includes an allocation of umaxCS for the maximum allowable contribution from noncommutability of the certified RM (CRM), umaxNC. Adapted from reference [8].
The report describing how to set a criterion for commutability assessment [8] included 2 examples that illustrate a limitation of umaxCS following current models. The first example for serum creatinine determined a MANCB of 4.9 % for a commutability assessment. Statistical modeling based on a typical within IVD-MD CVs, 2.5 % at 71 μmol/L (0.8 mg/dL) and 0.9 % at 619 μmol/L (7.0 mg/dL), showed that 14 measurements of a RM and 56 measurements of CSs were needed for commutability assessment which are a feasible number of measurements.
The example for serum sodium determined a MANCB of 0.26 %. Statistical modeling based on a typical within IVD-MD CV, 0.7 % at 140 mmol/L, showed that at least 140 measurements of a RM and 560 measurements of CSs were needed for commutability assessment which are not a feasible number of measurements. The MANCB needed to be changed to 0.7 % to have a reasonable number of measurements, 36 measurements of RM and 144 measurements of CSs. This MANCB requires umaxCS to be 0.8 % which exceeds the 0.4 % value based on the minimum from biological variability. In order to assess commutability for RMs for serum sodium, a larger umaxCS needs to be accepted. Consequently, the influence of a larger umaxCS on risk of harm for medical decisions needs to be considered. A recent report made a justification that performance specifications for sodium should not be based on biological variation [11]. The authors explained that in current practice sodium provides valuable clinical information based on its frequent use. A logical conclusion is the clinical need is met by current analytical performance, and an APS that reflects current analytical performance is fit-for-purpose. Since a typical within IVD-MD CV is 0.7 %, a umaxCS of 0.8 % may be reasonable and will allow a commutability assessment for a serum sodium RM to be performed.
Challenges when estimating the uRw allocated to the clinical laboratory operation of an IVD-MD
One of the challenges in setting an APS and determining the fraction of umaxCS that may be allocated to, or is used by, the main contributing sources in Figure 2, or Figure 4 which includes noncommutability, is determining the contribution of the uRw allocated to the clinical laboratory operation of an IVD-MD. ISO TS 20914 provides practical guidance for determining the measurement uncertainty of IVD-MDs used in clinical laboratories [6]. TS 20914 recommends a top-down approach that determines the uRw from internal quality control (IQC) data that is readily available in clinical laboratories and combines uRw with usys-cal to obtain the uCS. The TS recommends that the SD or CV be determined from data collected for a sufficiently long time interval to reflect most of the important sources of variability but does not state a specific time interval to use. The TS identifies many potential sources that contribute to MU including measurement imprecision of the IVD-MD, recalibrations, reagent and calibrator lot-to-lot variability, maintenance and parts replacement, and other recurring influences on an individual IVD-MD. The small random biases from some of the preceding events are intended to be captured in the uRw. The TS also recognizes that MU for results reported by a clinical laboratory may have contributions from measurements made using more than one of the same IVD-MD for the same measurand and from measurements made using IVD-MDs from different manufacturers that may have different analytical performance characteristics.
TS 20914 recognizes that when either an IQC or reagent lot changes, a shift in IQC absolute values without a matching change in CS results may occur. Such shifts are caused by having noncommutable IQC materials, which is the most common situation. An examination of 661 reagent lot changes for 8 IQC materials for 82 measurands using 7 different instrument platforms identified that 41 % of 1483 IQC material–reagent lot combinations had significant differences (p<0.05) between results for IQC materials and for patients’ samples [12]. The data supported that it is not possible to predict if or when such an IQC shift will occur when changing either IQC or reagent lots. Determining the SD or CV by indiscriminately using all IQC data for a time interval is not suitable because results may be influenced by shifts caused by noncommutable IQC materials. Consequently, the SD or CV must be determined separately for IQC results from each IQC/reagent lot combination and the SDs statistically pooled as the square root of sums of variances to obtain a suitable estimate of uRw over the time interval. The equation for pooling SDs (or CVs by replacing SD with CV) is:
where n i is the number of IQC results in partition i, SD i is the SD for IQC results in partition i, and k is the number of partitions of QC and reagent lots over a time interval [13].
The examples in TS 20914 use time intervals of several months to one year as illustrative to capture the common sources of variability although no specific minimum time interval is recommended. Other recommendations suggest a minimum of 6 months to adequately capture sources of variability contributions to uRw [2, 14]. However, a 6 month or less sampling interval may be inadequate to capture many contributors to measurement variability.
Figure 5 shows IQC data for serum creatinine for 3 identical IVD-MDs over a 2 year interval with data for each of 7 reagent lot changes shown separately. Each IVD-MD used the same reagent lot, calibrator lot and a single lot of IQC material within each interval shown [15]. All IQC results met the laboratory’s expected performance. The data is clear that CVs varied substantially over time intervals and IVD-MDs. The green bar for R4 had a shift in the Levey-Jennings chart with no explainable cause. Excluding the preceding, the purple arrow shows a 3.5 fold difference between the lowest and highest CVs observed for individual IVD-MDs and reagent lots. Also indicated are two approximately 6 month intervals that point out that different estimates of uRw would be made depending on the interval used. For the R2-R3 and R5-R6 intervals, pooled CV values for instrument 1 were 1.2 and 2.0 %, and pooled values over 3 instruments were 1.2 and 2.1 %, respectively. Similar variability in estimates of CV for measurements over 2 years were reported for alanine amino transferase (3.4 fold), glucose (2.6 fold) and sodium (2.7 fold) [15]. A reasonable extrapolation, consistent with the author’s experience, is that similar variability in CV over time is observed for most measurands.
![Figure 5:
Internal IQC data for serum creatinine at approximate concentration 70 μmol/L (0.8 mg/dL) for 3 identical IVD-MDs over a 2 year interval showing data for each of 7 reagent lot changes (R1 to R7). Each IVD-MD used the same reagent lot, calibrator lot and a single lot of IQC material within each interval. Measurements were made using calibrators and reagents from Abbott diagnostics using Architect c8000 instruments. The error bars show the upper 95 % CI for each CV. Adapted from reference [15].](/document/doi/10.1515/cclm-2023-1201/asset/graphic/j_cclm-2023-1201_fig_005.jpg)
Internal IQC data for serum creatinine at approximate concentration 70 μmol/L (0.8 mg/dL) for 3 identical IVD-MDs over a 2 year interval showing data for each of 7 reagent lot changes (R1 to R7). Each IVD-MD used the same reagent lot, calibrator lot and a single lot of IQC material within each interval. Measurements were made using calibrators and reagents from Abbott diagnostics using Architect c8000 instruments. The error bars show the upper 95 % CI for each CV. Adapted from reference [15].
Figure 6 shows the pooled CVs from Figure 5 and for a higher concentration of IQC material for serum creatinine. Differences in pooled CVs for the 3 IVD-MDs clearly illustrate that this variable contribution to MU can be an important factor in medical decisions when a test may be performed randomly by any instrument in the laboratory. Also shown are differences in CV at different concentrations of measurand. The pooled CV for measurements of CSs shown in green was from weekly measurements of a single patient sample, or a pool of 2–3 samples, on each IVD-MD over the 2 year interval. The CV for CSs is similar to that for level 2 IQC because the individual CSs had creatinine generally between 80 and 200 μmol/L (0.9–2.3 mg/dL) and CVs decrease as concentration increases.
![Figure 6:
Internal IQC data for serum creatinine at approximate concentrations for level 1 of 70 μmol/L (0.8 mg/dL) and for level 2 of 600 μmol/L (6.8 mg/dL) pooled from the data shown in Figure 5. Also shown are pooled CVs for all 3 IVD-MDs and for CS measured weekly on all 3 IVD-MDs over a 2 year interval. The concentrations of the CS were generally 80–200 μmol/L (0.9–2.3 mg/dL). The error bars show the upper 95 % CI for each CV. Adapted from reference [15].](/document/doi/10.1515/cclm-2023-1201/asset/graphic/j_cclm-2023-1201_fig_006.jpg)
Internal IQC data for serum creatinine at approximate concentrations for level 1 of 70 μmol/L (0.8 mg/dL) and for level 2 of 600 μmol/L (6.8 mg/dL) pooled from the data shown in Figure 5. Also shown are pooled CVs for all 3 IVD-MDs and for CS measured weekly on all 3 IVD-MDs over a 2 year interval. The concentrations of the CS were generally 80–200 μmol/L (0.9–2.3 mg/dL). The error bars show the upper 95 % CI for each CV. Adapted from reference [15].
Summary and conclusions
APS for an IVD-MD are challenging to determine because the contributing sources of MU are complex and difficult to isolate into easily identifiable components. The umaxCS as usually defined applies to one IVD-MD used within one laboratory and assumes small randomly occurring types of bias are included in the umaxCS. Any significant bias is intended to be identified and corrected in the calibration hierarchy. Determining a umaxCS is useful because it enables setting a maximum uncertainty goal for the APS of each contributing step in metrological traceability as a fraction of the umaxCS such that the combined uCS will fulfil the APS for the umaxCS. Such intermediate APS for MU at various steps in metrological traceability provide the basis for producers of RMs and RMPs, for IVD-MD manufacturers and for clinical laboratories to set control procedures to ensure the fraction of umaxCS allocated to a specific contributing source of MU is met and maintained over time.
The uncertainty in a result experienced by a clinical care provider is more complex than the umaxCS and includes all possible sources of error including biases that occur from calibrator lot-to-lot that are not corrected, bias and random variability from different IVD-MDs whether of the same type or from different manufacturers possibly using different technology, and bias from pre-analytical sources all of which are not usually captured in an APS for umaxCS. In addition to an APS for umaxCS, an APS for total allowable error that includes potential bias sources and a more realistic set of sources of variability is needed to promote quality clinical laboratory services.
Estimating the uRw from operation of IVD-MDs by a clinical laboratory is challenging. The variability of an IVD-MD is itself variable over time. When estimating the uRw for an IVD-MD for a measurand, the variability over a sufficient time interval is necessary to avoid erroneous conclusions regarding performance. There is no single time interval suitable for all measurements. An assessment of 2 or more years of IQC data as Levy-Jennings graphs is useful to identify the extent of variability and thus the time interval that needs to be included. The approach for estimating uRw is summarized in the following steps.
Step 1: partition IQC results into those measured using the same lot of IQC material and the same lot of reagent(s).
Step 2: calculate the SD and CV for each partition.
Step 3: pool the SD or CV from each partition as the best estimate of uRw.
Most of the current recommendations over simplify estimation of uRw by not using a sufficiently representative time interval to capture sources of variability in measurement results. An underestimation of uRw may be a common situation that compromises our understanding of how well current IVD-MDs and their supporting calibration hierarchies meet the needs of clinical care providers.
-
Research ethics: Not applicable.
-
Informed consent: Not applicable.
-
Author contributions: The author has accepted responsibility for the entire content of this manuscript and approved its submission.
-
Competing interests: The author states no conflict of interest.
-
Research funding: None declared.
References
1. Panteghini, M, Braga, F. Implementation of metrological traceability in laboratory medicine: where we are and what is missing. Clin Chem Lab Med 2020;58:1200–4. https://doi.org/10.1515/cclm-2019-1128.Search in Google Scholar PubMed
2. Braga, F, Pasqualeyyi, S, Borillo, F, Capoferri, A, Chibireva, M, Rovegno, L, et al.. Definition and application of performance specifications for measurement uncertainty of 23 common laboratory tests: linking theory to daily practice. Clin Chem Lab Med 2023;61:213–23. https://doi.org/10.1515/cclm-2022-0806.Search in Google Scholar PubMed
3. Braga, F, Panteghini, M. Performance specifications for measurement uncertainty of common biochemical measurands according to Milan models. Clin Chem Lab Med 2021;59:1362–8. https://doi.org/10.1515/cclm-2021-0170.Search in Google Scholar PubMed
4. ISO 17511:2020. In vitro diagnostic medical devices – Requirements for establishing metrological traceability of values assigned to calibrators, trueness control materials and human samples. Geneva, Switzerland: International Organization for Standardization; 2020.Search in Google Scholar
5. Braga, F, Infusino, I, Panteghini, M. Performance criteria for combined uncertainty budget in the implementation of metrological traceability. CCLM 2015;53:905–12. https://doi.org/10.1515/cclm-2014-1240.Search in Google Scholar PubMed
6. ISO TS20914:2019. Medical laboratories – Practical guidance for the estimation of measurement uncertainty. Geneva, Switzerland: International Organization for Standardization; 2019.Search in Google Scholar
7. Miller, WG, Greenberg, N, Panteghini, M, Budd, JR, Johansen, JV. For the IFCC Working Group on Metrological Traceability in Laboratory Medicine. Guidance on which calibrators in a metrologically traceable calibration hierarchy must be commutable with clinical samples. Clin Chem 2023;69:228–38. https://doi.org/10.1093/clinchem/hvac226.Search in Google Scholar PubMed
8. Miller, WG, Keller, T, Budd, J, Johansen, JV, Panteghini, M, Greenberg, N, et al.. For the IFCC Working Group on Commutability in Metrological Traceability. Recommendations for setting a criterion for assessing commutability of secondary calibrator certified reference materials. Clin Chem 2023;69:966–75. https://doi.org/10.1093/clinchem/hvad104.Search in Google Scholar PubMed
9. Nilsson, G, Budd, JR, Greenberg, N, Delatour, V, Rej, R, Panteghini, M, et al.. For the IFCC Working Group on commutability. IFCC Working Group recommendations for assessing commutability Part 2: using the difference in bias between a reference material and clinical samples. Clin Chem 2018;64:455–64. https://doi.org/10.1373/clinchem.2017.277541.Search in Google Scholar PubMed PubMed Central
10. Budd, JR, Weykamp, C, Rej, R, MacKenzie, F, Ceriotti, F, Greenberg, N, et al.. For the IFCC Working Group on commutability. IFCC Working Group recommendations for assessing commutability Part 3: using the calibration effectiveness of a reference material. Clin Chem 2018;64:465–74. https://doi.org/10.1373/clinchem.2017.277558.Search in Google Scholar PubMed
11. Oosterhuis, WP, Coskun, A, Sandberg, S, Theodorsson, E. Performance specifications for sodium should not be based on biological variation. Clin Chim Acta 2023;540:117221. https://doi.org/10.1016/j.cca.2023.117221.Search in Google Scholar PubMed
12. Miller, WG, Erek, A, Cunningham, TD, Oladipo, O, Scott, MG, Johnson, RE. Commutability limitations influence quality control results with different reagent lots. Clin Chem 2011;57:76–83. https://doi.org/10.1373/clinchem.2010.148106.Search in Google Scholar PubMed
13. Statistical quality control for quantitative measurement procedures: principles and definitions, 4th ed. CLSI document C24. Wayne, PA: Clinical and Laboratory Standards Institute; 2016.Search in Google Scholar
14. Miller, WG, Sandberg, S. Quality control of the analytical examination process. In: Rifai, N, Chiu, RWK, Young, I, Burnham, CAD, Wittwer, CT, editors. Tietz textbook of laboratory medicine, 7th ed. USA: Elsevier; 2023:129–63 pp.Search in Google Scholar
15. Ellis, AD, Gross, AR, Budd, JR, Miller, WG. Influence of reagent lots and multiple measuring systems on estimating the coefficient of variation from quality control data; implications for uncertainty estimation and interpretation of QC results. Clin Chem Lab Med 2020;58:1829–35. https://doi.org/10.1515/cclm-2020-0320.Search in Google Scholar PubMed
© 2024 the author(s), published by De Gruyter, Berlin/Boston
This work is licensed under the Creative Commons Attribution 4.0 International License.
Articles in the same Issue
- Frontmatter
- Editorial
- Analytical performance specifications – moving from models to practical recommendations
- Opinion Papers
- What the Milan conference has taught us about analytical performance specification model definition and measurand allocation
- The role of analytical performance specifications in international guidelines and standards dealing with metrological traceability in laboratory medicine
- How clinical laboratories select and use Analytical Performance Specifications (APS) in Italy
- Outcome-based analytical performance specifications: current status and future challenges
- Analytical performance specifications based on biological variation data – considerations, strengths and limitations
- State-of-the-art model for derivation of analytical performance specifications: how to define the highest level of analytical performance technically achievable
- Analytical performance specifications for combined uncertainty budget in the implementation of metrological traceability
- When bias becomes part of imprecision: how to use analytical performance specifications to determine acceptability of lot-lot variation and other sources of possibly unacceptable bias
- Using analytical performance specifications in a medical laboratory
- Issues in assessing analytical performance specifications in healthcare systems assembling multiple laboratories and measuring systems
- Applying the Milan models to setting analytical performance specifications – considering all the information
- Guidelines and Recommendations
- Recommendations for blood sampling in emergency departments from the European Society for Emergency Medicine (EUSEM), European Society for Emergency Nursing (EuSEN), and European Federation of Clinical Chemistry and Laboratory Medicine (EFLM) Working Group for the Preanalytical Phase. Executive summary
- General Clinical Chemistry and Laboratory Medicine
- Assessment of accuracy of laboratory testing results, relative to peer group consensus values in external quality control, by bivariate z-score analysis: the example of D-Dimer
- The stability of 65 biochemistry analytes in plasma, serum, and whole blood
- Assessment of the 2023 European Kidney Function Consortium (EKFC) equations in a Chinese adult population
- In vitro, in vivo metabolism and quantification of the novel synthetic opioid N-piperidinyl etonitazene (etonitazepipne)
- Quantification of blood glial fibrillary acidic protein using a second-generation microfluidic assay. Validation and comparative analysis with two established assays
- Association of prehospital lactate levels with base excess in various emergencies – a retrospective study
- Reference Values and Biological Variations
- Stability of ten serum tumor markers after one year of storage at −18°C
- Variations in tumor growth, intra-individual biological variability, and the interpretation of changes
- Cancer Diagnostics
- N-linked glycosylation of the M-protein variable region: glycoproteogenomics reveals a new layer of personalized complexity in multiple myeloma
- Cardiovascular Diseases
- Reference intervals for high sensitivity cardiac troponin I and N-terminal pro-B-type natriuretic peptide in children and adolescents on the Siemens Atellica
- Infectious Diseases
- Fetal chronic hypoxia does not affect urinary presepsin levels in newborns at birth
- Letters to the Editor
- AWMF statement on medical services in laboratory diagnostics and pathology with regard to the IVDR
- An outline of measurement uncertainty of total protein in urine estimated according to the ISO Technical Specification 20914
- Early diagnosis of severe illness in an outpatient – the Sysmex XN’s neutrophil reactivity parameter
- Analytical and diagnostic performance of Theradiag i-Tracker assays on IDS-iSYS for infliximab and adalimumab therapeutic drug monitoring
- Improving the diagnosis of AATD with aid of serum protein electrophoresis: a prospective, multicentre, validation study
- Cerebrospinal fluid kappa free light chains in patients with tumefactive demyelination
- Diagnostic value of quantitative chemiluminescence immunoassay for anti-gp210 and anti-sp100 antibodies in primary biliary cholangitis