The likelihood ratios of FIB-4-values for diagnosing advanced liver fibrosis in patients with NAFLD
-
Arne Åsberg
 ,
Lena Løfblad
,
Lena Løfblad

To the Editor,
Fibrosis-4 Index (FIB-4) is a non-invasive test for advanced fibrosis (stage F3 [bridging fibrosis] and/or stage F4 [cirrhosis] in patients with non-alcoholic fatty liver disease [NAFLD]) [1]. FIB-4 is calculated from age and three blood tests: (age × AST)/(thrombocytes × ALT0.5). Its diagnostic accuracy is neither excellent nor bad. In a recent meta-analysis, based on individual data from 5,393 patients in 37 primary studies, the diagnostic accuracy of FIB-4 for advanced fibrosis in patients with NAFLD was measured against histological classification of liver fibrosis [1]. The area under the receiver operating characteristic (ROC) curve was 0.76 [1]. Clinically FIB-4-values are judged against one or two cut-off values, i.e. FIB-4 is used as a qualitative or semiquantitative test [1]. However, we believe an individual risk assessment is more appropriate than just comparing the patient’s FIB-4-value against cut-off values, because the patients should be treated according to their individual risk, i.e. their posttest probability of disease.
In order to calculate the posttest probability for an individual patient the physician must know the patient’s pretest probability and the likelihood ratio (LR) of the patient’s FIB-4-value [2]. The posttest probability is (LR × pre)/(LR × pre + 1 − pre), where pre is pretest probability [2]. LR-values less than 1 makes the posttest probability less than the pretest probability, while LR-values greater than 1 makes the posttest probability greater than the pretest probability. A LR-value of 1 does not change the probability of disease.
Judging the pretest probability is difficult, and requires knowledge of the prevalence of disease in the relevant populations [3, 4]. Finding the LR of the individual patient’s FIB-4-value is even more difficult, because FIB-4 is a quantitative measure that can take on many different values. So we need a graph or a table showing the corresponding values of LR and FIB-4. Such a graph may be derived from Figure 2B in the article of Mózes et al. [1].
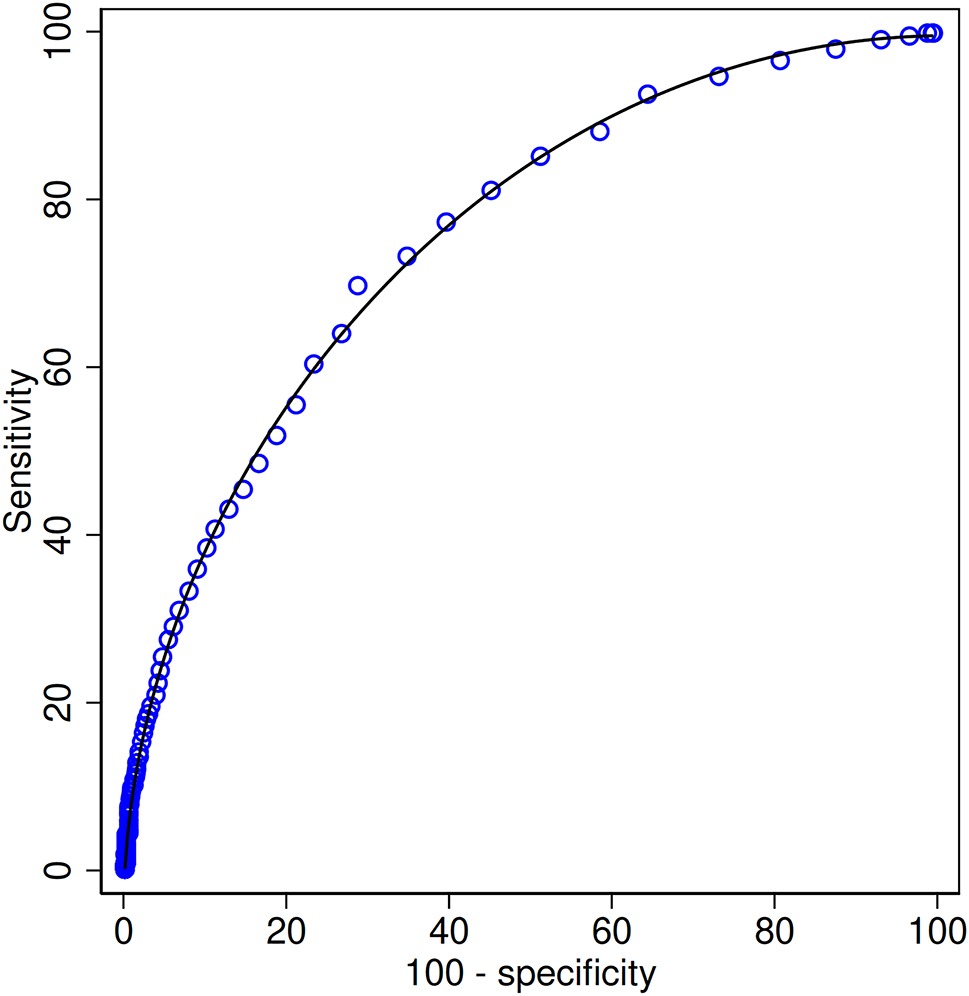
LR of a certain FIB-4-value is the slope of the tangent of the ROC-curve at the point of the curve that corresponds to the FIB-4-value [5]. Using the online software tool WebPlotDigitizer (https://apps.automeris.io/wpd/), we read the values of sensitivity and specificity from Figure 2B in [1] and constructed the ROC curve (data in the supplementary file). As a check of the reading accuracy we calculated the area under the plot of sensitivity vs. 100 – specificity, from a value of 0.18 to 99.52 % for 100 – specificity (the lowest and highest values we were able to read). The area was 0.752, quite close to the value 0.76 given in the article of Mózes et al. [1]. Then we used fractional polynomial regression (mfp-module in Stata, version 16) to smooth the curve. The function of the smoothed ROC curve was y=23.82 + 44.05 × ((x/10)0.5 − 0.6723) − 0.3405 × ((x/10)2 – 0.2043), where y is sensitivity and x is 100 – specificity (Supplementary Figure). Finally, we found the derivative of the smoothed ROC curve using an on-line service from WolframAlpha (https://www.wolframalpha.com/). This gave us an expression of LR as a function of 100 – specificity: LR=6.965/x0.5 – 0.006812 × x, where x is 100 – specificity (in percent). From Figure 2B in [1] we know the connection between FIB-4-values and 100 – specificity, so we were able to construct a curve (Figure 1A) showing the LR of FIB-4-values up to 5. Very few patients have higher values. Knowing the LR of FIB-4-values, we calculated the posttest probability for advanced liver fibrosis for FIB-4-values up to 5, given four different values of pretest probability (Figure 1B). A more accurate function of LR might possibly be derived directly from the collection of individual data [2]. However, we believe that our figures are sufficiently accurate for the purpose and hope they will be clinically useful, in spite of the difficulties judging pretest probability. For instance, as shown in Figure 1B, in a patient with FIB-4 of 1.3 (corresponding to a LR of about 1), posttest probability is almost the same as the pretest probability. Then, if the pretest probability is 5 %, the posttest probability is also 5 % and perhaps below the threshold for referral to more definitive diagnostic procedures. If the pretest probability is 20 %, the conclusion may be quite the opposite at the same value of FIB-4, illustrating the need for individual assessment.
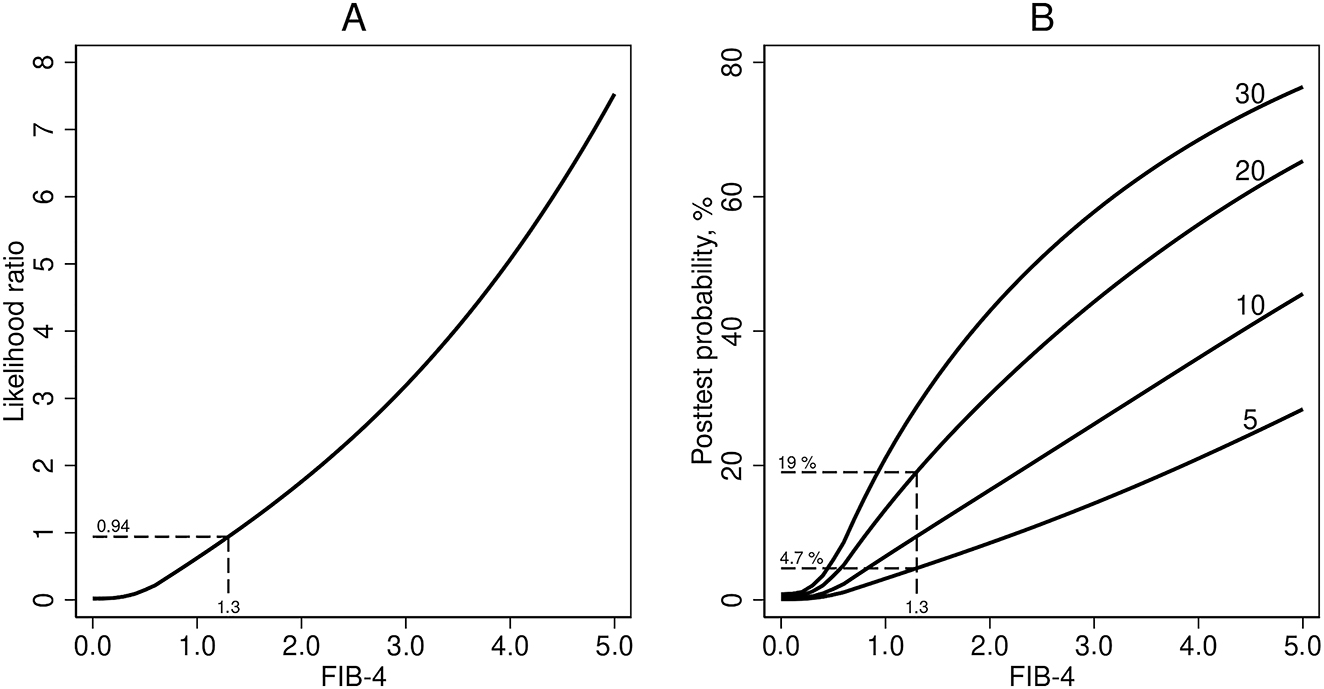
Likelihood ratio and posttest porbability. (A) Likelihood ratio for diagnosing advanced liver fibrosis in patients with NAFLD, as a function of FIB-4. (B) Posttest probability of advanced liver fibrosis as functions of FIB-4, for 4 different values of pretest probability: 5 %, 10 %, 20 %, and 30 %.
Admittedly, the LR of a test result may vary with the clinical population; however, theoretically it is independent of the prevalence of disease. This is a general issue using Bayes’ theorem in diagnostic medicine. In any case, we should try to use the correct LR and not pretend that quantitative tests (like FIB-4) are qualitative.
-
Research funding: None declared.
-
Author contributions: All authors have accepted responsibility for the entire content of this manuscript and approved its submission.
-
Competing interests: Authors state no conflict of interest.
-
Informed consent: Not applicable.
-
Ethical approval: Not applicable.
References
1. Mózes, FE, Lee, JA, Selvaraj, EA, Jayaswal, ANA, Trauner, M, Boursier, J, et al.. Diagnostic accuracy of non-invasive tests for advanced fibrosis in patients with NAFLD: an individual patient data meta-analysis. Gut 2022;71:1006–19. https://doi.org/10.1136/gutjnl-2021-324243.Search in Google Scholar PubMed PubMed Central
2. Albert, A. On the use and computation of likelihood ratios in clinical chemistry. Clin Chem 1982;28:1113–9. https://doi.org/10.1093/clinchem/28.5.1113.Search in Google Scholar
3. Zhang, X, Heredia, NI, Balakrishnan, M, Thrift, AP. Prevalence and factors associated with NAFLD detected by vibration controlled transient elastography among US adults: results from NHANES 2017–2018. PLoS One 2021;16:e0252164. https://doi.org/10.1371/journal.pone.0252164.Search in Google Scholar PubMed PubMed Central
4. Lomonaco, R, Godinez Leiva, E, Bril, F, Shrestha, S, Mansour, L, Budd, J, et al.. Advanced liver fibrosis is common in patients WithType 2 diabetes followed in the outpatient setting: the need for systematic screening. Diabetes Care 2021;44:399–406. https://doi.org/10.2337/dc20-1997.Search in Google Scholar PubMed PubMed Central
5. Choi, BC. Slopes of a receiver operating characteristic curve and likelihood ratios for a diagnostic test. Am J Epidemiol 1998;148:1127–32. https://doi.org/10.1093/oxfordjournals.aje.a009592.Search in Google Scholar PubMed
Supplementary Material
This article contains supplementary material (https://doi.org/10.1515/cclm-2023-0177).
© 2023 the author(s), published by De Gruyter, Berlin/Boston
This work is licensed under the Creative Commons Attribution 4.0 International License.
Articles in the same Issue
- Frontmatter
- Editorial
- The development of reference measurement procedures to establish metrological traceability
- Opinion Paper
- Establishing metrological traceability for small molecule measurands in laboratory medicine
- Articles
- An isotope dilution-liquid chromatography-tandem mass spectrometry (ID-LC-MS/MS)-based candidate reference measurement procedure (RMP) for the quantification of aldosterone in human serum and plasma
- An isotope dilution-liquid chromatography-tandem mass spectrometry (ID-LC-MS/MS)-based candidate reference measurement procedure (RMP) for the quantification of methotrexate in human serum and plasma
- An isotope dilution-liquid chromatography-tandem mass spectrometry (ID-LC-MS/MS)-based candidate reference measurement procedure (RMP) for the quantification of lamotrigine in human serum and plasma
- An isotope dilution-liquid chromatography-tandem mass spectrometry (ID-LC-MS/MS)-based candidate reference measurement procedure for the quantification of topiramate in human serum and plasma
- An isotope dilution-liquid chromatography-tandem mass spectrometry (ID-LC-MS/MS)-based candidate reference measurement procedure (RMP) for the quantification of gabapentin in human serum and plasma
- An isotope dilution-liquid chromatography-tandem mass spectrometry (ID-LC-MS/MS)-based candidate reference measurement procedure for the quantification of levetiracetam in human serum and plasma
- Review
- Recent advances of drugs monitoring in oral fluid and comparison with blood
- Genetics and Molecular Diagnostics
- One fits all: a highly sensitive combined ddPCR/pyrosequencing system for the quantification of microchimerism after hematopoietic and solid organ transplantation
- General Clinical Chemistry and Laboratory Medicine
- Design of an algorithm for the detection of intravenous fluid contamination in clinical laboratory samples
- Sex-specific disparities of serum pepsinogen I in relation to body mass index
- Rapid and efficient LC-MS/MS diagnosis of inherited metabolic disorders: a semi-automated workflow for analysis of organic acids, acylglycines, and acylcarnitines in urine
- Persistently elevated serum concentrations of human chorionic gonadotropin (hCG)
- Reference Values and Biological Variations
- Pediatric reference interval verification for 16 biochemical markers on the Alinity ci system in the CALIPER cohort of healthy children and adolescents
- Serum GFAP – pediatric reference interval in a cohort of Danish children
- Cardiovascular Diseases
- Higher troponin T serum concentrations in hospital patients without diagnosed cardiac diseases compared to a population-based cohort
- Infectious Diseases
- Neopterin and kynurenine in serum and urine as prognostic biomarkers in hospitalized patients with delta and omicron variant SARS-CoV-2 infection
- Letters to the Editor
- Limitations in using the EFLM WG-A/ISO approach for assessment of reagent lot variability
- In reply to: Limitations in using the EFLM WG-A/ISO approach for assessment of reagent lot variability
- ChatGPT, critical thing and ethical practice
- AI, diabetes and getting lost in translation: a multilingual evaluation of Bing with ChatGPT focused in HbA1c
- UK diagnostics in the era of ‘permacrisis’: is it fit for purpose and able to respond to the challenges ahead?
- The underestimated potential of vibrational spectroscopy in clinical laboratory medicine: a translational gap to close
- A universal reference interval for serum immunoglobulins free light chains may be outdated
- The likelihood ratios of FIB-4-values for diagnosing advanced liver fibrosis in patients with NAFLD