Method comparison of three serum free light chain assays on the Roche Cobas 6000 c501 chemistry analyzer
-
Dieuwertje Augustijn
 ,
Joannes F.M. Jacobs
,
Joannes F.M. Jacobs


Abstract
Objectives
Free light chains (FLC) are important in the diagnosis, prognosis and monitoring of therapy response of patients with monoclonal gammopathies. In this study, we performed a method comparison of three FLC assays on the Cobas 6000 c501 chemistry analyzer of Roche Diagnostics.
Methods
Samples of 119 patients with various monoclonal gammopathies and 26 control patients were measured with the Freelite (The Binding Site), Diazyme (Diazyme Laboratories) and KLoneus (Trimero Diagnostics) FLC assays. A method comparison was performed and reference intervals of the three assays were validated.
Results
The analysis of the Bland-Altman agreement showed bias between the three FLC assays, ranging from −62.7 to 5.1% for κFLC and between −29.2 to 80.5% for λFLC. The Freelite and Diazyme assays have the highest agreement. The concordance of the FLC-ratio ranges from 41 to 75%, with the highest concordance between the Freelite and KLoneus assays. The FLC-ratio in 25 sera from healthy controls were within the reference ranges of the Freelite and KLoneus assays. The FLC-ratio was elevated in all 25 samples tested with the Diazyme assay.
Conclusions
The agreement for the free light chains is highest between the Freelite and the Diazyme assay and fair for the KLoneus assay. However, concordance of the FLC-ratio is highest when the Freelite and KLoneus assays were compared. Our data suggest that concordance for the Diazyme assay could be improved by recalibration. Because of absolute differences between the three methods in individual patients, none of the three FLC assays can be used interchangeably.
Introduction
Monoclonal gammopathies are characterized by clonal proliferation of plasma cells leading to the production of monoclonal immunoglobulins, the so-called M-proteins. Plasma cells also secrete free light kappa (κ) or lambda (λ) which circulate unbound to the immunoglobulin heavy chains. In plasma cell proliferative disorders, there is often excess production of one of the light chains, leading to an abnormal free light chain (FLC) ratio (κ/λ). FLC are important in the diagnosis, prognosis and monitoring of therapy response [1, 2]. About 90% of the newly diagnosed multiple myeloma (MM) patients have an abnormal FLC-ratio and 70% of patients with smoldering multiple myeloma [1]. Because it was shown that 80% of patients with an involved/uninvolved FLC-ratio >100 progresses to MM within 2 years, the International Myeloma Working Group defined that FLC-ratio as a myeloma defining event [1].
Since the introduction of serum free light chain in the early 2000s, several immunoassays have been introduced that make use of nephelometry, turbidimetry, ELISA or lateral-flow methodology [3], [4], [5], [6]. It is known that these different FLC assays can lead to different outcomes, especially in terms of absolute FLC quantification. Harmonization of FLC-quantification over different assays has proven to be challenging because of the unique characteristics of the analyte and because of the lack of a reference method or reference material [7], [8], [9], [10].
On the Cobas analyzer series of Roche Diagnostics, there are three different immunoassays available using turbidimetry, namely the Freelite assay of the Binding Site, the Diazyme assay of Diazyme Laboratories and the KLoneus assay of Trimero Diagnostics. The three assays are available on the c501 module of the Cobas 6000 and for the c502 module of the Cobas 8000. The advantage of these immunoassays on the Cobas analyzer series is that it allows automated continuous analysis which results in higher reproducibility and short turnaround times.
All three immunoassays make use of polyclonal antibodies, but there is a difference in assay principle. Both Freelite and Diazyme assays are latex-enhanced turbidimetric immunoassays. In these assays, latex particles are coated with antibodies against either free light chain kappa or lambda. The KLoneus assay is using polystyrene particles coated with FLC-specific antibodies. The reaction between the antibodies bound to particles from the assay reagents and the FLCs in the patient samples forms insoluble particles that change the intensity of the transmitted light due to the scattering effect of the particles. Changes in the intensity of the transmitted light are measured using turbidimetry.
The Binding Site has sent out a notification that the supply of Freelite reagents for the Roche Cobas analyzers will not be continued in the near future. If users would like to continue using the Roche Cobas analyzer series, they could switch to the Diazyme or the KLoneus assay. The purpose of this study is to compare the three currently available FLC assays on the Roche Cobas c501 chemistry analyzer.
Materials and methods
Free light chain assays
Serum free light chain measurements were performed on the Cobas 6000 c501 using Freelite (reagent lot number 712007 for FLC kappa and 711571 for FLC lambda, The Binding Site, Birmingham, UK), Diazyme (reagent lot number 491684 for FLC kappa and 479603 for FLC lambda, Diazyme Laboratories, Poway, USA) and the KLoneus assay (reagent lot number 511SK-54 for FLC kappa and 511SL-54 for FLC lambda, Trimero Diagnostics, Barcelona, Spain) according to the manufacturer’s guidelines. Characteristics of the different sFLC assays are presented in Table 1.
Characteristics of the FLC assays on the Cobas 6000 c501.
| Freelite | Diazyme assays | KLoneus assay | |
|---|---|---|---|
| Assay principle | Latex-enhanced turbidimetric immunoassay | Latex-enhanced turbidimetric immunoassay | Particle-enhanced turbidimetric immunoassay |
| Antibodies | Polyclonal | Polyclonal | Polyclonal |
| Calibrator | Polyclonal FLC | Polyclonal FLC | Polyclonal FLC |
| Sample volume | κFLC: 20 μL λFLC: 20 μL |
κFLC: 6.5 μL λFLC: 13 μL |
κFLC: 3 μL λFLC: 5 μL |
| Intra-assay VC (within-run precision) | 1.4–5.5% | 1.1–6.5% | 3.5–7.6% |
| Interassay VC | 2.3–10.1% | 1.1–114.4% | 1.2–4.3% |
| Reference values κ | 3.3–19.4 mg/L | 2.37–20.73 mg/L | 3.3–19.4 mg/L |
| Reference values λ | 5.7–26.3 mg/L | 4.23–27.69 mg/L | 5.7–26.3 mg/L |
| Reference values κ/λ | 0.26–1.65 | 0.22–1.74 | 0.26–1.65 |
| Adj. FLC-ratio | Yes, 0.37–3.1a | No | No |
| Interferenceb | Bilirubin: 150 mg/L for kappa and 200 mg/L for lambda Hemoglobin: 4.8 g/L |
Triglycerides: 10.000 mg/L Bilirubin: 400 mg/L Hemoglobin: 10 g/L Rheumatoid factor: 100 IU/mL Ascorbic acid: 10 mmol/L |
Triglycerides: 5,000 mg/L for kappa and 10.000 mg/L for lambda Bilirubin: 200 mg/L Hemoglobin: 5 g/L |
| Company | The Binding Site | Diazyme Laboratories | Trimero Diagnostics |
-
aAdjusted κ/λ FLC-ratio reference values for patients with impaired renal function, not included in the package insert but obtained from communication. bSubstances normally present in serum which produced less than 10% deviation when tested at levels equal to the concentrations listed. FLC, free light chain; VC, variation coefficient.
Samples
In this study, 145 patients are evaluated, which were used in a previous method comparison of different free light chain assays [10]. This includes 119 patients with monoclonal gammopathies, including multiple myeloma (MM, n=62 of which five newly diagnosed patients), kappa light chain multiple myeloma (LCMM, n=19), lambda LCMM (n=8), smoldering multiple myeloma (sMM, n=7), AL amyloidosis (n=13 of which two newly diagnosed patients), Waldenström macroglobulinemia (n=5) and MGUS (n=5). The diagnosis was performed according to the criteria of the International Myeloma Working Group [1], including performing immunofixation of serum and/or urine. The patients were not treated with monoclonal antibodies during collection of the samples. In total, 26 control patients are included from patients without M-protein (n=11) and patients with chronic kidney disease without M-protein (n=15). The samples were collected in 8.5 mL SST vacutainers (Becton Dickinson, UK) and separated within 1 h upon arrival at the laboratory. Samples were stored at −20 °C until analysis and thawed prior to analysis. An additional 25 reference sera were derived from healthy controls for the validation of the reference intervals of the three assays. The healthy adult controls were volunteers from our laboratory, who had no active disease and were not on medication.
The study was performed in according to the Helsinki guidelines and was approved by the institutional Medical Ethics Review Board (Erasmus MC 2017-415).
sFLC method comparison
Method comparison between the three different FLC assays on the Cobas 6000 c501 were performed according to the CLSI EP9 guidelines. The entire dynamic range of FLC concentrations was covered by the 145 selected serum samples. The reference ranges from the package inserts were used (see Table 1). The adjusted FLC-ratio was used in the case of patients with renal impairment defined as eGFR <60 mL/min/1.73 m2 using creatinine concentration. The reference interval for creatinine is 55–90 μmol/L for females and 65–115 μmol/L for males (Roche Diagnostics, Almere, The Netherlands). The FLC-ratio (κ/λ) is calculated and divided into three groups: below (low), above (high) or within the reference range (normal). In patients with renal impairment, adjusted reference ranges (if applicable) were applied to categorize the FLC-ratio.
Validation of reference intervals
Validation of the reference intervals mentioned in the kit-inserts of all three methods was performed based on CLSI C28-A3 guidelines [11]. Reference samples from 25 healthy volunteers were measured with the three methods. The percentage of results that fell within the reference limit of each test was determined. When ≥90% of these samples fell within the reference interval the reference intervals were considered as verified.
Statistics
Bland-Altman evaluation, Passing-Bablok regression and Kendall’s Tau correlation coefficient analysis were performed with the results for κFLC and λFLC obtained in three FLC assays. Nonparametric methods were used since the results are not normally distributed. The results of the categorized FLC-ratio (κ/λ) were used to perform concordance analysis. The Cohen kappa coefficient (κ) is used to interpret the concordance analysis. Values between 0.81 and 1.00 are defined as almost perfect agreement, between 0.61 and 0.80 as high agreement, between 0.41 and 0.60 as moderate agreement, between 0.21 and 0.40 as fair agreement [12]. A κ-value less than 0.20 is defined as none to slight agreement. Statistical analysis was performed using Analyse-IT for Microsoft Excel (v5.40, Analyse-IT Software Ltd., Leeds, UK).
Results
Method comparisons
Three different FLC assays were used to measure 119 sera from patients with monoclonal gammopathies and 26 sera from control patients without M-protein. In Table 2, the agreement of κFLC, λFLC and FLC-ratio are presented by Bland-Altman and Passing-Bablok for all combinations. Graphical representation of the Bland-Altman and Passing-Bablok analysis of κFLC and λFLC are represented in Supplementary Figure 1 and Supplementary Figure 2. Results of the FLC-ratio are represented in Figure 1.
Bland-Altman, Passing-Bablok (PB) and Kendall’s Tau (τ) analysis for kappa and lambda free light chains.
| FLC Kappa | FLC Lambda | FLC-ratio | |||||||
|---|---|---|---|---|---|---|---|---|---|
| Bias, % | PB slope | Kendall’s τ | Bias, % | PB slope | Kendall’s τ | Bias, % | PB slope | Kendall’s τ | |
| Freelite vs. Diazyme | 5.1 | 1.05 | 0.888 | −29.2 | 0.96 | 0.869 | 30.9 | 1.47 | 0.761 |
| Freelite vs. KLoneus | −56.8 | 0.51 | 0.847 | 54.9 | 1.33 | 0.605 | −99.3 | 0.221 | 0.703 |
| Diazyme vs. KLoneus | −62.7 | 0.54 | 0.900 | 80.5 | 1.39 | 0.666 | −123.9 | 0.156 | 0.755 |
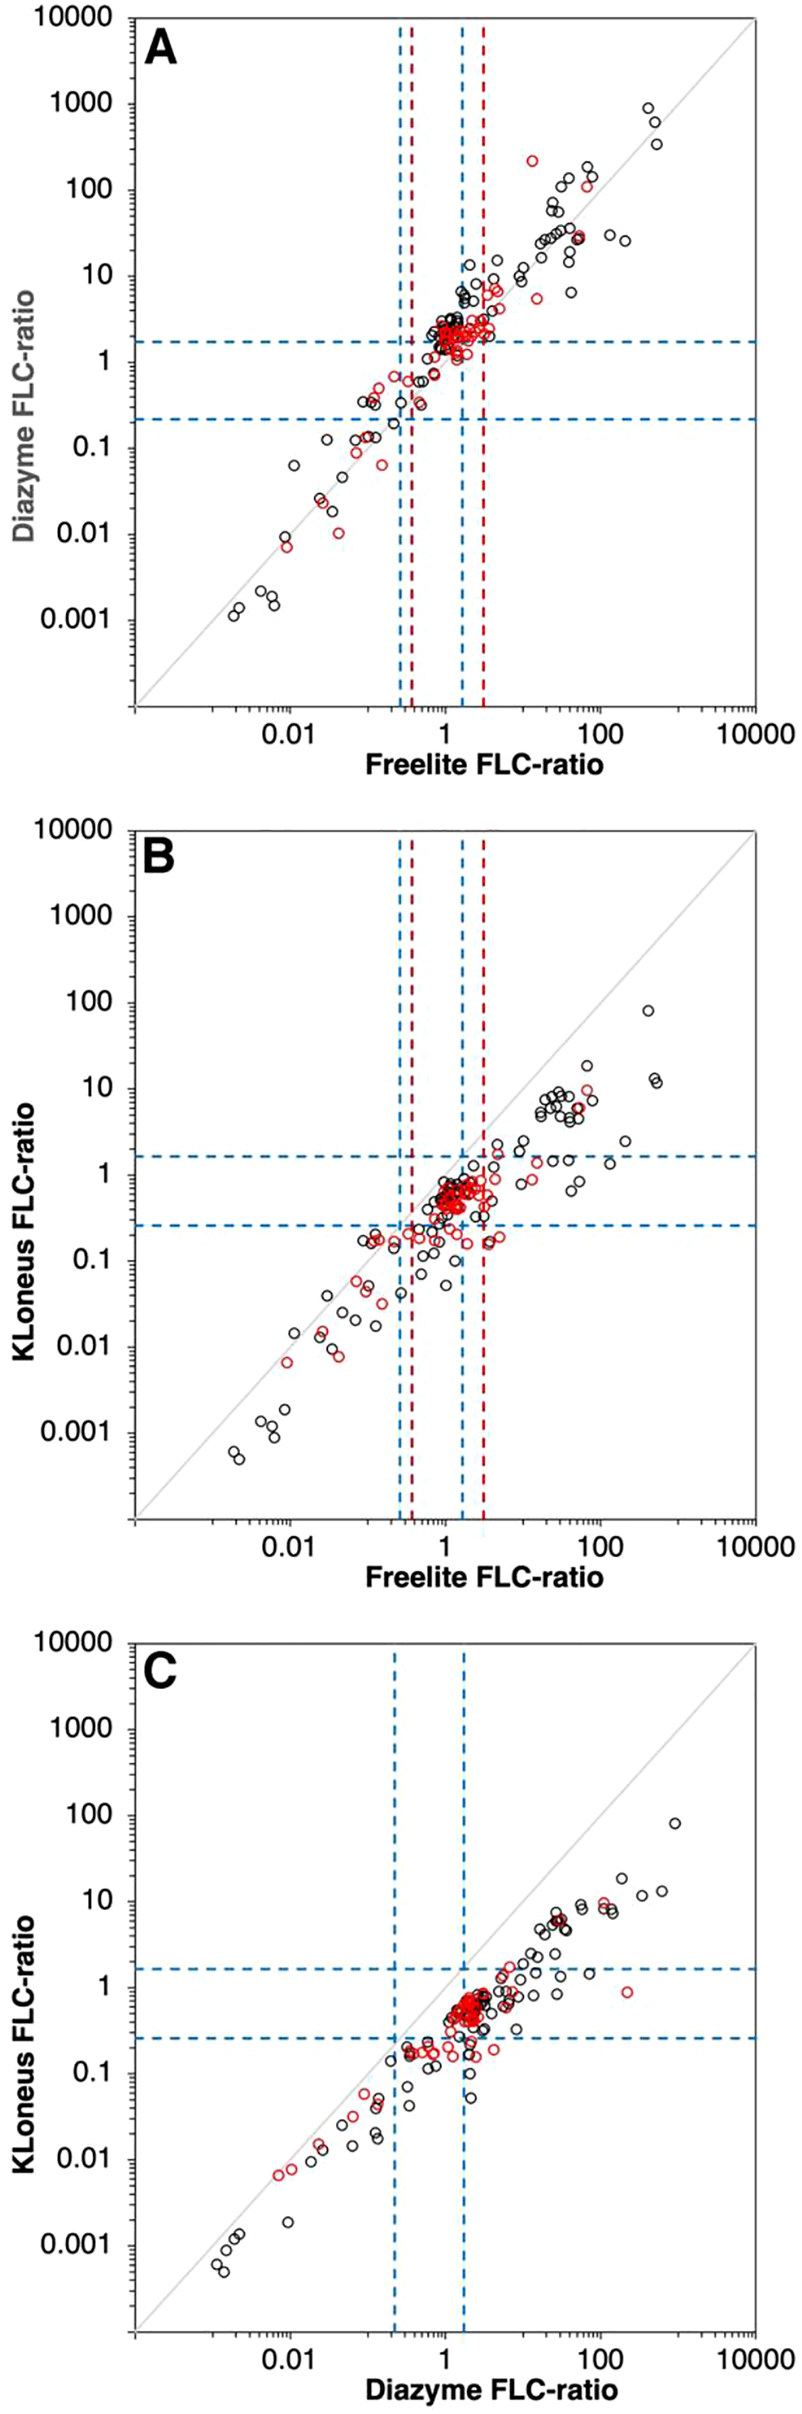
FLC-ratio of the 145 samples between the assays. Freelite vs. Diazyme (A), Freelite vs. KLoneus (B) and Diazyme vs. KLoneus (C). The blue dotted lines are the reference limits of the corresponding assay, the red dotted lines are the adjusted reference limit for patients with renal impairment. Values from patients with renal impairment are represented as red dots.
The bias between the Freelite and Diazyme assays is 5.1% and −29.2% for kappa and lambda, respectively, according to the Bland-Altman evaluation. The agreement of these two methods is quite high, especially for kappa. The slopes of the Passing-Bablok regression for Freelite vs. Diazyme were 1.05 (Kendall’s τ=0.888, p<0.001) and 0.96 (Kendall’s τ=0.869, p<0.001) for kappa and lambda, respectively. The bias between the Freelite and Diazyme assays is 30.9% for the FLC-ratio. The Passing-Bablok regression slope is 1.47 (Kendall’s τ=0.761, p<0.001). Figure 1A shows higher elevated FLC-ratios when using the Diazyme assay. For the Freelite vs. KLoneus assays, there is a bias of −56.8% for kappa and 54.9% for lambda which results in less agreement between these two assays. The slope was 0.51 (Kendall’s τ=0.847, p<0.001) for kappa and 1.33 (Kendall’s τ=0.605, p<0.001) for lambda when comparing Freelite with the KLoneus assay. The bias for the FLC-ratio is −99.3% for these two assays. The slope of the Passing-Bablok regression is 0.221 (Kendall’s τ=0.703, p<0.001). Comparing the Diazyme with the KLoneus assay, there is a bias of −62.7% for kappa and 80.5% for lambda. The slope for this comparison was 0.54 (Kendall’s τ=0.900, p<0.001) for kappa and 1.39 (Kendall’s τ=0.666, p<0.001) for lambda. For the FLC-ratio, the bias is −123.9% with a Passing-Bablok regression slope of 0.156 (Kendall’s τ=0.755, p<0.001). The analysis is also performed on the results of the multiple myeloma patients only, but no large differences were detected compared to the all patients with monoclonal gammopathies (Supplementary Table 1).
When inspecting the results of the Passing-Bablok analysis of the comparison between the Freelite assay and the Diazyme assay, there are some samples with discrepancy. These samples have high concentrations of FLC kappa in the Freelite assay, but low concentrations of FLC kappa in the Diazyme assay. Therefore, we diluted three samples manually and higher concentrations of FLC kappa were measured with the Diazyme assay, indicating a high-dose hook effect (Table 3).
FLC kappa concentration for three discrepant samples when comparing the Freelite and Diazyme assay.
| Diagnosis | Freelite FLC kappa, mg/L | Diazyme FLC kappa, mg/L | |
|---|---|---|---|
| Original concentration | Manually diluted (1:50) | ||
| MM | 625.0 | 83.15 | 739.5 |
| MM | 407.8 | 131.75 | 216.5 |
| MM FLC kappa | 231.4 | 67.82 | 334.5 |
-
The samples are measured again after a 50-time dilution to reveal whether there is a high-dose hook effect.
Concordance analysis FLC-ratio
For the concordance analysis, the FLC-ratios (κ/λ) are classified according to the kit-insert into three groups: below (low), above (high) or within the reference range (normal) (Figure 2).
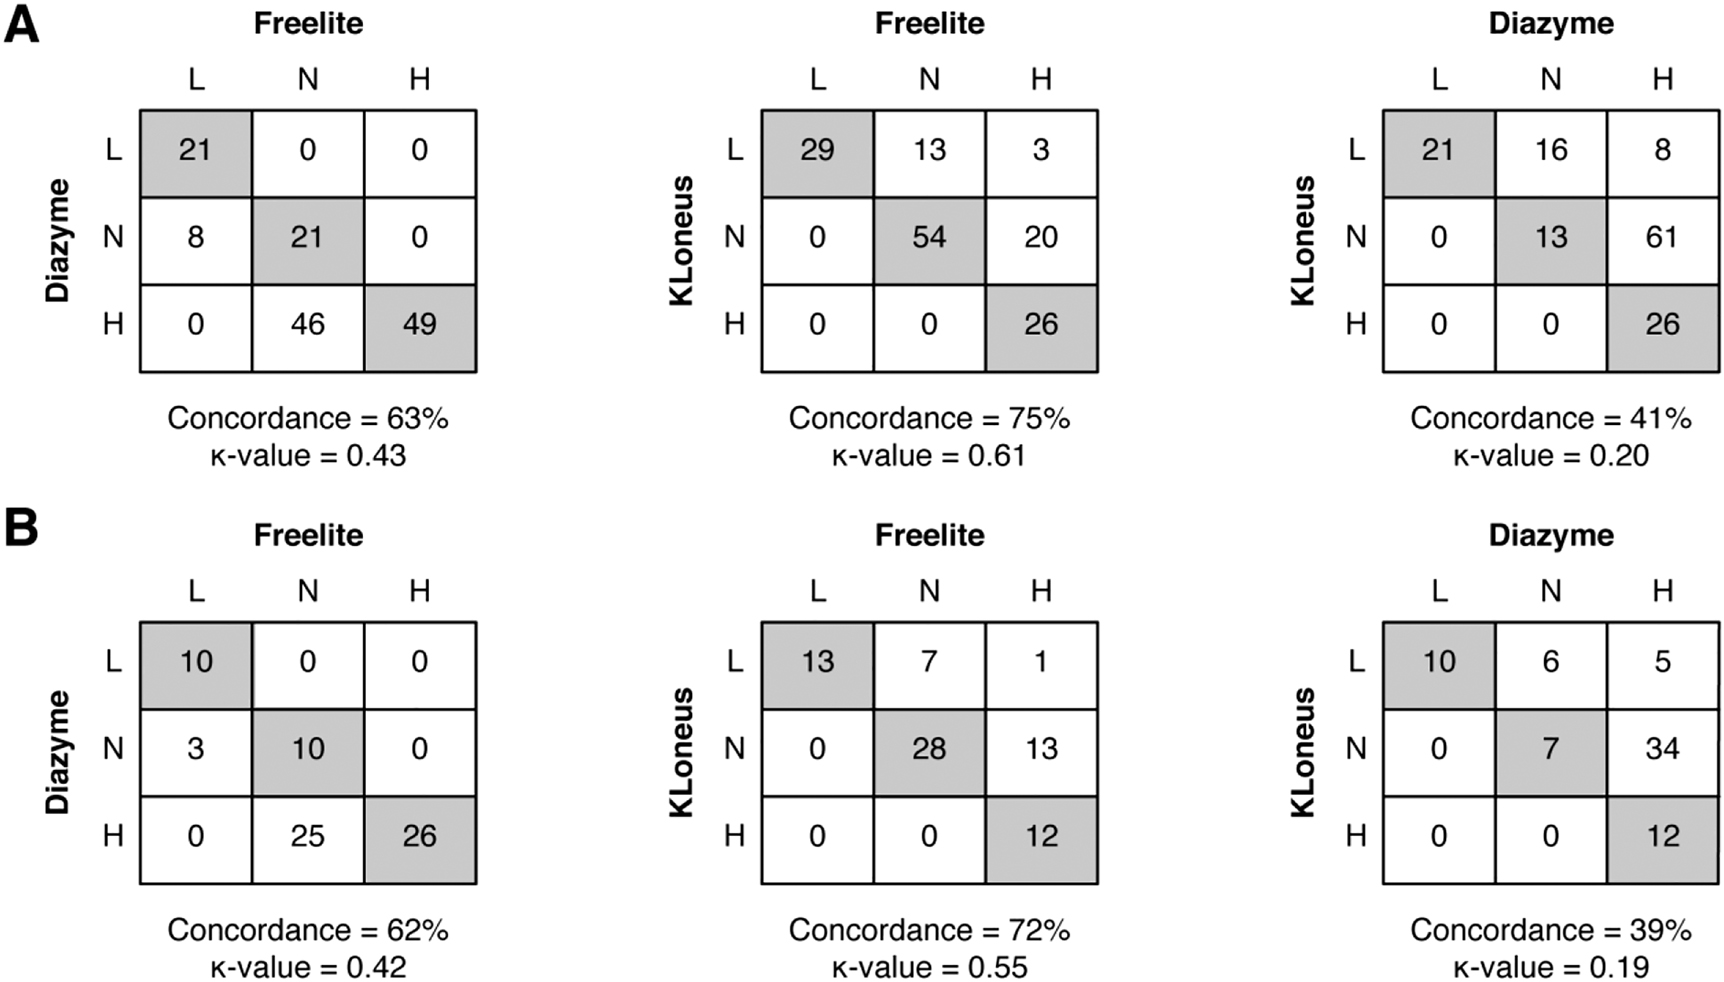
Concordance analysis of the FLC-ratio between the three FLC assays. (A) For all patients (n=145) and (B) for patients without renal impairment (n=74). Grey boxes indicate agreement between the assays. The concordance is represented in percentages, and the Cohen kappa coefficient is also displayed.
The concordances for the Freelite and Diazyme assay is 63% and a Cohen’s coefficient of 0.43, corresponding to a moderate agreement (Figure 2A). Most of the mismatches were observed in samples that were classified as normal with the Freelite assay, but high with the Diazyme assay. There was good agreement between the Freelite and the KLoneus assay (Cohen’s κ=0.61) with a concordance of 75%. Most of the discrepant samples are below the reference interval of the FLC-ratio of the KLoneus assay. When comparing the results of the FLC-ratio of the Diazyme method with the KLoneus assay, there is none to slight agreement (Cohen’s κ=0.20) with a concordance of 41%. Most of the samples are classified as normal or high FLC-ratio with the Diazyme assay, but with lower FLC-ratios with the KLoneus assay. When concordance analysis is performed in patients without renal impairment (eGFR >60 mL/min/1.73 m2) only, there are some minor changes in concordance and agreement between the methods (Figure 2B). The results of the FLC-ratio of the Diazyme method are still higher compared to the Freelite assay, and the results of the FLC-ratio are lower with the KLoneus assay in patients without renal impairment. The concordance analysis is also performed on multiple myeloma patients only, there are minor changes in the concordances (Supplementary Table 1).
Validation of reference intervals
Both kappa and lambda concentration were measured with the three methods in sera from 25 healthy volunteers. Table 4 shows the number and percentage of the samples which fell within the reference intervals. Validation was considered successful when ≥90% of the reference samples fell within the reference interval. The reference interval for both the Freelite method and the KLoneus method can be verified (Supplementary Table 2). In contrast with that, all healthy volunteers have an elevated FLC-ratio when tested with the Diazyme assay. The reason for this increased FLC-ratio is that the Diazyme assay consistently measured FLC kappa values in the upper-range of normal (and 24% of samples above). Additionally, the FLC lambda values were consistently in the lower range of normal (and 12% of samples below).
Validation of assay-specific reference intervals.
| Freelite | Diazyme | KLoneus | |
|---|---|---|---|
| FLC Kappa | 0/23/2 (92%) | 0/19/6 (76%) | 0/25/0 (100%) |
| FLC Lambda | 0/25/0 (100%) | 3/22/0 (88%) | 0/25/0 (100%) |
| FLC-ratio | 0/25/0 (100%) | 0/0/25 (0%) | 0/25/0 (100%) |
-
The number of samples that were below, within or above the reference limits as provided by the kit-inserts. The percentage is the number of samples which fell within the reference limit.
Discussion
The aim of this study was to perform a method comparison of three FLC assays that are currently available for routine diagnostics on the Roche Cobas automated platforms. Free light chains are important in the context of screening, prognostic stratification, and monitoring of patients with monoclonal gammopathies. The assays are all using polyclonal antibodies and turbidimetry as detection method but differ in assay principle. In this study we demonstrate that these assays are not adequately harmonized. As a consequence, the FLC-ratio test-result of individual patients may be normal or abnormal depending on the FLC assay that is used. This is also important for the involved:noninvolved FLC-ratio (iFLC/niFLC) which is defined as ≥100 by the International Myeloma Working Group (IMWG) as a criterium to start treatment for multiple myeloma patients [13].
In addition, the reference interval for the Diazyme assay cannot be verified. All of the 25 tested healthy control sera had an abnormal high FLC-ratio which was caused by consistently high FLC kappa results combined with consistently low FLC lambda results. From our data it seems that a simple re-calibration of both FLC kappa and FLC lambda could solve this issue. This is also evident in the high level of agreement between the Freelite and Diazyme when comparing the FLC kappa and lambda to each other. The bias for FLC kappa is only −5.1% and for FLC lambda −29.2%. However, the concordance between the two assays for the FLC-ratio is low with only 63% due to the low reference-interval for FLC lambda. In addition, we showed for three samples that the discrepancy of the results of the FLC kappa concentrations can be explained by a high-dose hook effect.
The agreement between the Freelite and KLoneus assay was low. The concentration of kappa FLC was lower with the KLoneus assay (bias = −56.8%) and a higher concentration of lambda FLC (bias = 54.9%) compared to the Freelite assay. However, the concordance of the FLC-ratio was highest with 75% agreement between the Freelite and KLoneus assay. Although calibration for both assays was performed by using the Freelite calibrator, this didn’t result in a high agreement between the two assays and could be affected by different assay antibodies that recognize different variations [14]. The agreement between Diazyme and the KLoneus assay was low as well with a bias of −62.7% for kappa FLC and 80.5% for lambda FLC. There was also none to slight agreement when comparing the FLC-ratio between the two assays. A limitation of this study is that the cohort is too small to perform reliable method comparisons stratified per individual monoclonal gammopathy.
Our data show that a large part of the differences between the three assays can be explained by a calibration-issue. Recalibration (especially of the Diazyme assay) to the Freelite assay can solve a large part of the discrepancies. For the KLoneus assays, we observe excellent concordance in healthy control sera between both assays, indicating perfect calibration to the Freelite assay in the reference range. However, when monoclonal free light chains are present, significant differences between FLC-quantification was observed exposing intrinsic differences between the Freelite and KLoneus FLC-assays [15].
Other discrepancies between the three assays were caused by FLC antigen excess that was not properly detected and possible differences of the various detection reagents to measure polymerized FLC [16, 17] or rare FLC-epitopes [7].
It is known that renal impairment influences renal clearance of both FLC kappa and lambda [18]. In some of the FLC-assays also an increased FLC-ratio is observed in these patients [10]. The Freelite assay has an adjusted reference interval of the FLC-ratio for patients with renal impairment. KLoneus and Diazyme have not communicated the need for adjusted reference ranges in these patients, however our data seem to indicate that the Diazyme Laboratories needs to introduce adjusted reference ranges for patients with renal impairment as well. Our cohort is too small to determine the exact ranges for these adjusted reference ranges.
In conclusion, the agreement between the kappa and lambda FLC Freelite assay of The Binding Site and the Diazyme assay of Diazyme Laboratories were good in this method comparison. There was a moderate agreement when looking at the FLC-ratio. Our data strongly indicate that the Diazyme assay needs to be recalibrated, since the FLC-ratio in all healthy controls tested in this study were slightly above the upper limit of normal. The Trimero Diagnostics KLoneus assays show poor agreement with both the Freelite assay and the Diazyme assay.
Funding source: Dutch Cancer Society
Award Identifier / Grant number: #10817
Acknowledgments
Reagents to perform this study were kindly provided by The Binding Site, Roche Diagnostics GmbH and Trimero Diagnostics.
-
Research funding: JFMJ received a research grant from the Dutch Cancer Society (#10817).
-
Author contributions: All authors have accepted responsibility for the entire content of this manuscript and approved its submission.
-
Competing interests: Authors state no conflict of interest.
-
Informed consent: Not applicable
-
Ethical approval: The study was performed in according to the Helsinki guidelines and was approved by the institutional Medical Ethics Review Board (Erasmus MC 2017-415).
References
1. Rajkumar, SV, Dimopoulos, MA, Palumbo, A, Blade, J, Merlini, G, Mateos, MV, et al.. International Myeloma Working Group updated criteria for the diagnosis of multiple myeloma. Lancet Oncol 2014;15:e538–48. https://doi.org/10.1016/s1470-2045(14)70442-5.Suche in Google Scholar
2. Graziani, MS, Merlini, G. Serum free light chain analysis in the diagnosis and management of multiple myeloma and related conditions. Expert Rev Mol Diagn 2014;14:55–66. https://doi.org/10.1586/14737159.2014.864557.Suche in Google Scholar PubMed
3. Bradwell, AR, Carr-Smith, HD, Mead, GP, Tang, LX, Showell, PJ, Drayson, MT, et al.. Highly sensitive, automated immunoassay for immunoglobulin free light chains in serum and urine. Clin Chem 2001;47:673–80. https://doi.org/10.1093/clinchem/47.4.673.Suche in Google Scholar
4. te Velthuis, H, Knop, I, Stam, P, van den Broek, M, Bos, HK, Hol, S, et al.. N Latex FLC - new monoclonal high-performance assays for the determination of free light chain kappa and lambda. Clin Chem Lab Med 2011;49:1323–32. https://doi.org/10.1515/cclm.2011.624.Suche in Google Scholar PubMed
5. Campbell, JP, Heaney, JL, Shemar, M, Baldwin, D, Griffin, AE, Oldridge, E, et al.. Development of a rapid and quantitative lateral flow assay for the simultaneous measurement of serum κ and λ immunoglobulin free light chains (FLC): inception of a new near-patient FLC screening tool. Clin Chem Lab Med 2017;55:424–34. https://doi.org/10.1515/cclm-2016-0194.Suche in Google Scholar PubMed
6. Jacobs, JFM, de Kat Angelino, CM, Brouwers, H, Croockewit, SA, Joosten, I, van der Molen, RG. Evaluation of a new free light chain ELISA assay: bringing coherence with electrophoretic methods. Clin Chem Lab Med 2018;56:312–22. https://doi.org/10.1515/cclm-2017-0339.Suche in Google Scholar PubMed
7. Graziani, MS. Measurement of free light chains - pros and cons of current methods. Clin Chem Lab Med 2016;54:1015–20. https://doi.org/10.1515/cclm-2015-1062.Suche in Google Scholar PubMed
8. Jacobs, JF, Tate, JR, Merlini, G. Is accuracy of serum free light chain measurement achievable? Clin Chem Lab Med 2016;54:1021–30. https://doi.org/10.1515/cclm-2015-0879.Suche in Google Scholar PubMed
9. Cigliana, G, Gulli, F, Napodano, C, Pocino, K, De Santis, E, Colacicco, L, et al.. Serum free light chain quantitative assays: dilemma of a biomarker. J Clin Lab Anal 2018;32. https://doi.org/10.1002/jcla.22243.Suche in Google Scholar PubMed PubMed Central
10. Fleming, CKA, Swarttouw, T, de Kat Angelino, CM, Jacobs, JFM, Russcher, H. Method comparison of four clinically available assays for serum free light chain analysis. Clin Chem Lab Med 2019;58:85–94. https://doi.org/10.1515/cclm-2019-0533.Suche in Google Scholar PubMed
11. CLSI I. Defining, establishing, and verifying reference Intervals in the clinical laboratory; Approved Guideline - third edition: book title CLSI document EP28-A3c. Wayne, PA: Clinical and Laboratory Standards Institute; 2008.Suche in Google Scholar
12. McHugh, ML. Interrater reliability: the kappa statistic. Biochem Med 2012;22:276–82. https://doi.org/10.11613/bm.2012.031.Suche in Google Scholar
13. Curcio, R, Stettler, H, Suter, PM, Aksözen, JB, Saleh, L, Spanaus, K, et al.. Reference intervals for 24 laboratory parameters determined in 24-hour urine collections. Clin Chem Lab Med 2016;54:105–16. https://doi.org/10.1515/cclm-2014-1041.Suche in Google Scholar PubMed
14. Tate, J, Bazeley, S, Sykes, S, Mollee, P. Quantitative serum free light chain assay--analytical issues. Clin Biochem Rev 2009;30:131–40.Suche in Google Scholar
15. Carr-Smith, HD, Jenner, EL, Evans, JA, Harding, SJ. Analytical issues of serum free light chain assays and the relative performance of polyclonal and monoclonal based reagents. Clin Chem Lab Med 2016;54:997–1003. https://doi.org/10.1515/cclm-2015-1068.Suche in Google Scholar PubMed
16. Caponi, L, Koni, E, Romiti, N, Paolicchi, A, Franzini, M. Free light chain UV quantification compared with immunochemical measurement: how dimers and monomers may influence the results. Clin Chim Acta 2020;510:278–84. https://doi.org/10.1016/j.cca.2020.07.027.Suche in Google Scholar PubMed
17. Kaplan, B, Jacobs, JFM. FLC polymerization: another hurdle towards standardization of FLC measurements. Clin Chim Acta 2021;515:42–3. https://doi.org/10.1016/j.cca.2020.12.030.Suche in Google Scholar PubMed
18. Molina-Andújar, A, Robles, P, Cibeira, MT, Montagud-Marrahi, E, Guillen, E, Xipell, M, et al.. The renal range of the κ/λ sFLC ratio: best strategy to evaluate multiple myeloma in patients with chronic kidney disease. BMC Nephrol 2020;21:111. https://doi.org/10.1186/s12882-020-01771-3.Suche in Google Scholar PubMed PubMed Central
Supplementary Material
The online version of this article offers supplementary material (https://doi.org/10.1515/cclm-2021-1029).
© 2021 Dieuwertje Augustijn et al., published by De Gruyter, Berlin/Boston
This work is licensed under the Creative Commons Attribution 4.0 International License.
Artikel in diesem Heft
- Frontmatter
- Obituary
- Dr Per Hyltoft Petersen: an appreciation
- Editorials
- Extrapolated normative GFR data for living kidney donation
- Effectiveness of interventions to improve test appropriateness
- Reviews
- The pathogenesis, epidemiology and biomarkers of susceptibility of pulmonary fibrosis in COVID-19 survivors
- S100B in cardiac surgery brain monitoring: friend or foe?
- Mini Review
- Blood lactate concentration in COVID-19: a systematic literature review
- Opinion Paper
- Commercial immunoassays for detection of anti-SARS-CoV-2 spike and RBD antibodies: urgent call for validation against new and highly mutated variants
- General Clinical Chemistry and Laboratory Medicine
- A randomized controlled study of biochemical tests in primary care: interventions can reduce the number of tests but usage does not become more appropriate
- A national surveillance program for evaluating new reagent lots in medical laboratories
- External quality assessment providers’ services appear to more impact the immunohaematology performance of laboratories than national regulatory and economic conditions
- International collaborative study to evaluate and calibrate two recombinant L chain Ferritin preparations for use as a WHO International Standard
- Method comparison of three serum free light chain assays on the Roche Cobas 6000 c501 chemistry analyzer
- Prospective urinary albumin/creatinine ratio for diagnosis, staging, and organ response assessment in renal AL amyloidosis: results from a large cohort of patients
- Analytical evaluation of the Nittobo Medical tartrate resistant acid phosphatase isoform 5b (TRACP-5b) EIA and comparison with IDS iSYS in different clinically defined populations
- Reference Values and Biological Variations
- Age-adapted percentiles of measured glomerular filtration in healthy individuals: extrapolation to living kidney donors over 65 years
- Indirectly determined hematology reference intervals for pediatric patients in Berlin and Brandenburg
- Hematology and Coagulation
- Monocyte distribution width (MDW): a useful biomarker to improve sepsis management in Emergency Department
- Diabetes
- A step towards optimal efficiency of HbA1c measurement as a first-line laboratory test: the TOP-HOLE (Towards OPtimal glycoHemOgLobin tEsting) project
- Labile glycated hemoglobin: an underestimated laboratory marker of short term glycemia
- Infectious Diseases
- Neutralizing antibody titers six months after Comirnaty vaccination: kinetics and comparison with SARS-CoV-2 immunoassays
- Letters to the Editors
- Molecular detection of SARS-CoV-2 eta VOI in Northern Italy: a case report
- Optimizing effectiveness of COVID-19 vaccination: will laboratory stewardship play a role?
- Measurement in different sample types may aid in detecting interferences and macrocomplexes affecting cardiac troponin measurements
- Which method to detect macrotroponin?
- Marked geographical variation in the prevalence of macroprolactinemia
- Pancreatic lipase assays: time for a change towards immunoassays?
- Analytical evaluation of the performances of a new procalcitonin immunoassay
- Necessity of harmonization of tissue transglutaminase IgA assays to align clinical decision making in coeliac disease
- A fortuitous but characteristic blood smear observation allowing a late diagnosis of MPS-VII
- Prognostic significance of blood-based multi-cancer detection in plasma cell-free DNA