Abstract
Background: The increasing need to reduce the costs of providing diagnostic laboratory services has prompted initiatives based on the centralization and consolidation of laboratory facilities. However, the majority of papers and experiences reported in literature focus on “cost per test” thus overlooking the real value of a laboratory service, which requires more complex economic evaluations, such as cost-benefit, cost-effectiveness, and cost-utility analysis. It is important to perform cost analysis, which is no mean feat, by taking into consideration all variables affecting the final and true cost per test.
Methods: The present study was conducted in order to evaluate the costs of delivering laboratory services in 20 Italian clinical laboratories using a widely accepted methodology, the so-called “activity-based costing analysis”.
Results: The finding of a trend towards a decrease in total costs – due to an increase in test volumes – attained statistical significance only for quantities of up to about 1,100,00 tests per year. For 1,800,00 tests and more, the cost per test appeared to range from 1.5 to 2.0 € irrespective of the different volumes. Regarding the relationship between volumes and number of staff, there is an evident linear relationship between the number of senior staff and volumes, whereas this trend is not observed in the case of medical technologists, the degree and type of automation strongly affecting this variable.
Conclusions: The findings made in the present study confirm that the relationship between volumes and costs is not linear; since it is complex, numerous variables should be taken into account.
Introduction
The sustainability of healthcare systems is a controversial issue, worldwide, as the annual increases in healthcare costs are unsustainable [1] and the debate on strategies for reducing costs involves all branches of modern medicine, in which laboratory medicine plays a key role: 70%–80% of healthcare decisions call for one or more laboratory investigations. However, increasing economic pressure has impacted on the organization of laboratory activities and workflows, through the consolidation, merger and downsizing of existing institutions, the basic aim being to reduce the “cost per test” [2]. Within this narrow perspective, only one of the variables influencing the final value of the service has been identified. All studies on health economics stress the importance of identifying the context of the analysis by using more than one criterion. According to Frybach and Thornury [3], efficiency, namely economic analysis, plays a relevant role in the hierarchy of criteria used to evaluate a diagnostic procedure. The economic analysis, as conceived for laboratory medicine should: 1) provide valuable cost control and monitoring over time; 2) identify the mechanisms underlying the final costs with a view to obviating redundancy and waste; 3) provide information allowing a comparative evaluation and serving as a benchmark among clinical laboratories; 4) understand current trends in order to address a rational reorganization process for clinical laboratories; and 5) provide evidence of the benefit of diagnostic testing in improving outcomes [4–7]. Regarding the last issue, it should be underlined that an important point is to understand the context in which the laboratory service is employed and the costs of those services. In fact, while the costs (efficiency) of the services must be transparent, the value (effectiveness) is to be evaluated in a broader context. The aim of this paper was to report the results of our study on cost evaluation using activity-based costing [8–10] performed in several Italian laboratories in order to throw light on: 1) the relationships between costs and test volumes; 2) the contribution of different variables (human and technological resources) to the final costs, particularly in relation to different test volumes; and 3) any differences between laboratory medicine subspecialties (e.g., clinical chemistry, hematology and coagulation).
Materials and methods
Clinical laboratories involved in the study
The 20 Italian clinical laboratories included in the study had voluntarily responded to a request to participate. The only selection criterion for enrolment was that the participating laboratories should vary with respect to test volumes and organization, have a STAT (station=emergent) section, and some were to have a microbiology section/unit. Table 1 describes the main characteristics of the clinical laboratories involved in the study.
Main characteristics of the clinical laboratories.
| Lab ID | Lab type | Test/year | Size | Area | STAT | Microbiology |
|---|---|---|---|---|---|---|
| 36 | Private lab | 455,776 | S | N | No | Yes |
| 8 | Pediatric | 754,715 | S | C | PS | No |
| 23 | General lab | 1,113,985 | S | N | S | Yes |
| 6 | General lab | 1,852,622 | M | C | R | Yes |
| 111 | Central lab with many specialties | 1,981,329 | M | S | S | No |
| 32 | General lab | 2,090,366 | M | N | R | Yes |
| 104 | Private clinic lab | 2,092,949 | M | N | R | Yes |
| 27 | General lab | 2,135,040 | M | N | S | Yes |
| 22 | General lab | 2,316,292 | M | N | R | Yes |
| 38 | General lab | 2,333,317 | M | C | PS | No |
| 18 | General lab | 2,580,235 | M | N | R | Yes |
| 41 | General lab | 3,070,468 | M | N | S | No |
| 109 | General lab | 3,100,573 | M | N | PS | Yes |
| 11 | General lab | 3,229,619 | M | N | R | Yes |
| 107 | General lab | 3,680,159 | M | N | R | Yes |
| 21 | General lab | 4,300,346 | M | N | R | No |
| 20 | General lab | 4,786,903 | M | N | R | No |
| 25 | Central lab with many specialties | 7,686,350 | L | N | S | Yes |
| 14 | Core lab with few specialties | 7,795,197 | L | C | R | No |
| 19 | Central lab with many specialties | 8,000,471 | L | N | S | No |
Activity-based costing
The activity-based costing analysis was performed according to the principles described by Cooper and Kaplan [8, 9] and Cao et al. [10].
Process analysis and items classification
The whole laboratory organization was divided into “workstations”, each of which is defined as “the sum of instruments, materials and activities used to make an homogeneous part of the process, able to produce an output that adds value to the input” [8]. For each workstation both inputs (incoming materials to be worked) and outputs (worked materials that become the inputs of another workstation) have been defined. Basic resources (materials, instruments and staff time) were assigned to a specific workstation and related outputs according to the utilization of real resources.
Data collection
Production data (e.g., tests performed, numbers of tubes and numbers of patients) were collected from the Laboratory Information System (LIS) and assigned to their outputs. A laboratory “test” was defined according to the way it was produced. Results from the same process and the same reagents (i.e., CBC) were considered to be the same test. Results from different processes and/or from the same process but using different reagents were considered different tests. All laboratory cost items (reagents, disposables, rental and maintenance contracts, service contracts and general ledgers) were collected from the Hospital Information System (HIS) if available, or from other official sources. Each item was assigned to an output, a workstation, an instrument, a section, a laboratory site or a laboratory itself, according to the way it was effectively consumed. Revenues were collected for each test, according to the national reimbursement value. A return on investment (ROI) index was calculated as the ratio between revenues and costs. Values higher than 1 are representative of a gain.
Data processing
Data were analyzed using ProcessQC software supplied by Gene.sys of G. Barletta, which utilizes a simplified version of the activity-based costing methodology to assign costs and to define the quantity of time spent by the operators for any laboratory product. This program enables a quantitative analysis of laboratory production processes to be made and produces periodic reports on costs, staff allocation and personnel productivity. Numeric data, assigned to a workstation, flow to the next level, the internal driver distributing the correct portion of cost to each workstation that receives inputs from it. The operation, which begins at the “Start” workstation, is repeated for each step of the process. When the flow meets a final output (called “product”) the costs are definitely assigned to it. The costs not directly related with production (e.g., management and quality) are assigned to products using specific drivers. The final cost for each product (total cost and unit cost) can be exploded to investigate the different portions of it, with the related sources and times spent on those activities. Data on phlebotomy, information technologies and sample transportation have been collected and included in the cost analysis, while other overhead costs (spaces, common functions, cleaning, refectory, laundry, etc) were collected but not included as the results were very different among the several institutions.
Staff allocation
Basic data (hours worked and cost per professional) were collected using a top-down approach, which was also used to define work-groups within each staff type. The total number of hours worked by a staff member, according to the category, were proportionally assigned to the different workgroups. One or more workers within each workgroup were interviewed to collect the activity time (bottom-up approach). Interviewees were asked to quantify the time needed for each activity using the more suitable driver (i.e., minutes per day or per sample). The ratio (sum of times collected during the interviews/total time for the workgroup), called the “activity index”, was used to validate the reliability of interviews. If the activity was outside a range of 0.6–1.2, data were reviewed, a repeat interview being given to the same worker or a different worker in the same workgroup. If the index was constantly outside the range, work sampling techniques [9] were used for a more indepth evaluation of the problem. Staff data were expressed in full time equivalents (FTE), where the number of FTE represented the ratio number of hours worked weekly/number of weekly hours defined in the contract for the staff category. FTE was used to normalize part-time workers and excess hours worked.
Results
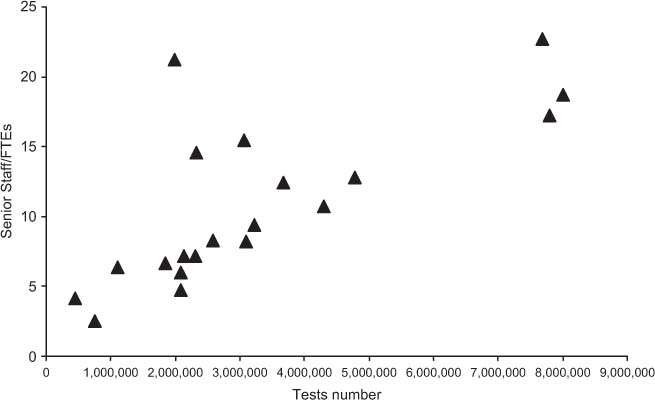
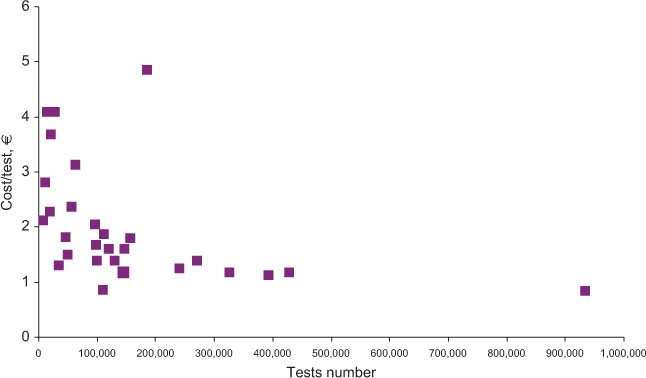
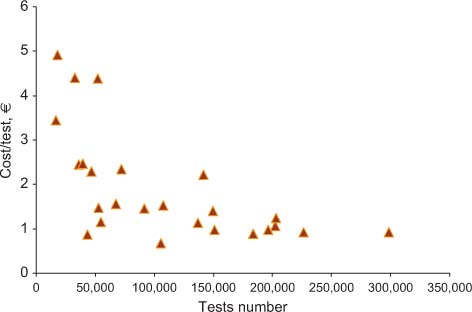
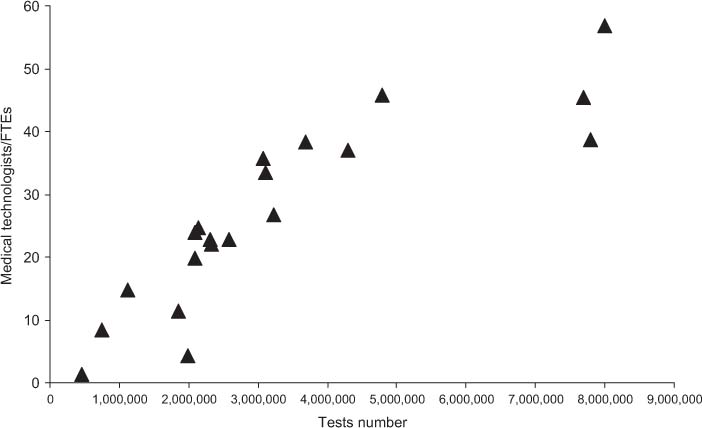
Table 2 shows the results obtained for total costs, the costs for materials, and staff. All costs are expressed in Euros. In the far right column, cost per test is specified, while the revenue and ROI are shown in columns 5 and 6, respectively. Figure 1 shows the relationship between the overall number of tests performed yearly and the mean cost per test. Figures 2 and 3 show the relationship between test volume and cost per test in clinical chemistry and hematology, respectively. Figures 5 and 6 on the same relationships regarding coagulation and urinalysis are reported in the supplemental material. The data obtained on the relationships between test volumes and FTE of all medical technologists are shown in Figure 4. A very similar relationship has been observed for the senior staff (Figure 7 in supplemental material).
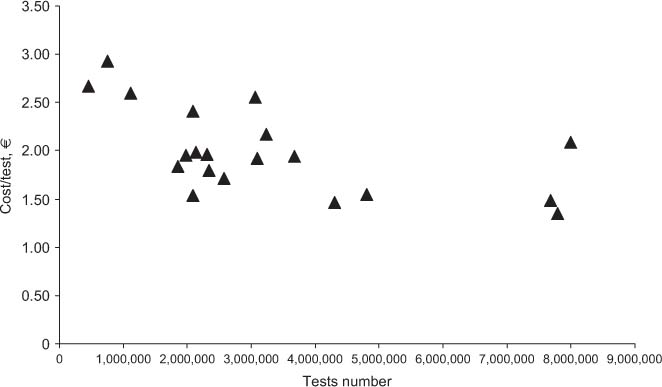
Relationship between the overall test volumes and costs.
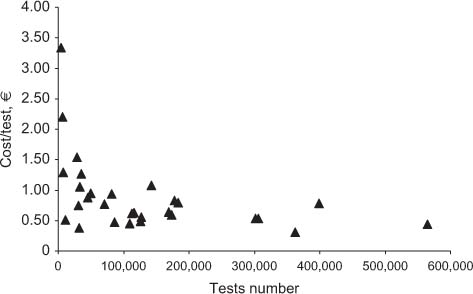
Relationship between costs and test volumes (clinical chemistry).
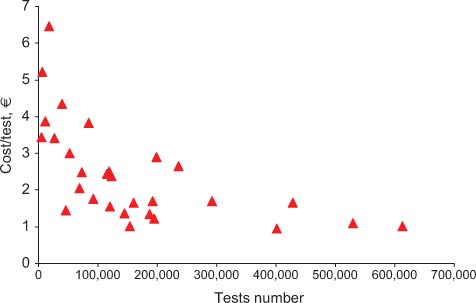
Relationship between costs and test volumes (hematology).
Relationship between test volumes and medical technologists FTE.
Relationship between costs and test volumes (coagulation).
Relationship between costs and test volumes (urinalysis).
Relationship between test volumes and senior staff FTE.
Overall costs, costs of materials, staff, revenues, cost per test (in Euros), and ROI.
| Lab ID | Total costs | Materials | Staff | Revenues | ROI | Number tests | Cost × test |
|---|---|---|---|---|---|---|---|
| 36 | 1,214,776.00 | 742,648.59 | 472,127.41 | 2,231,096.91 | 1.84 | 455,780 | 2.67 |
| 8 | 2,206,705.49 | 1,355,794.59 | 850,910.90 | 2,696,869.79 | 1.22 | 754,720 | 2.92 |
| 23 | 2,888,816.08 | 1,367,954.11 | 1,520,861.97 | 3,898,333.33 | 1.35 | 1,113,985 | 2.59 |
| 6 | 3,397,538.48 | 1,852,724.85 | 1,544,813.63 | 9,555,857.84 | 2.81 | 1,852,622 | 1.83 |
| 111 | 3,8604,43.32 | 1,039,174.89 | 2,821,268.43 | 6,624,791.34 | 1.72 | 1,981,329 | 1.95 |
| 32 | 5,046,684.60 | 3,555,384.38 | 1,491,300.22 | 11,038,695.58 | 2.19 | 2,090,366 | 2.41 |
| 104 | 3,2182,88.77 | 1,860,962.14 | 1,357,326.63 | 7,226,172.86 | 2.25 | 2,092,949 | 1.54 |
| 27 | 4,226,638.97 | 2,060,024.82 | 2,166,614.15 | 9,555,268.68 | 2.26 | 2,135,040 | 1.98 |
| 22 | 4,555,445.29 | 2,722,073.01 | 1,833,372.28 | 10,195,123.66 | 2.24 | 2,316,292 | 1.97 |
| 38 | 4,200,679.33 | 1,756,250.75 | 2,444,428.58 | 10,063,854.10 | 2.40 | 2,333,317 | 1.8 |
| 18 | 4,417,244.35 | 2,256,019.13 | 2,161,225.22 | 11,154,742.41 | 2.53 | 2,580,235 | 1.71 |
| 41 | 7,858,677.93 | 3,704,633.11 | 4,154,044.82 | 12,623,278.57 | 1.61 | 3,070,468 | 2.56 |
| 109 | 5,9413,65.30 | 3,007,341.82 | 2,934,023.48 | 12,485,211.05 | 2.10 | 3,100,573 | 1.92 |
| 11 | 7,000,762.64 | 3,931,036.82 | 3,069,725.82 | 13,879,675.40 | 1.98 | 3,229,619 | 2.17 |
| 107 | 7,146,739.52 | 2,941,682.74 | 4,205,056.78 | 14,290,547.20 | 2.00 | 3,680,159 | 1.94 |
| 21 | 6,277,446.39 | 3,286,354.02 | 2,991,092.37 | 15,865,186.19 | 2.53 | 4,300,346 | 1.46 |
| 20 | 7,409,258.90 | 3,987,560.29 | 3,421,698.61 | 18,233,963.52 | 2.46 | 4,786,903 | 1.55 |
| 25 | 11,413,472.17 | 7,381,091.21 | 4,032,380.96 | 23,671,093.52 | 2.07 | 7,686,350 | 1.48 |
| 14 | 10,496,304.37 | 5,567,364.49 | 4,928,939.88 | 21,811,013.57 | 2.08 | 7,795,197 | 1.35 |
| 19 | 16,694,997.13 | 12,279,961.86 | 4,415,035.27 | 41,001,314.58 | 2.46 | 8,000,471 | 2.09 |
Discussion
The data obtained in the present study confirm that several variables can affect the costs per test of an individual laboratory. In particular, while there is a trend towards a decrease of total costs due to increased test volumes, this attains statistical significance only for up to about 1,100,00 tests per year. Once the figure of 1,800,00 tests or more is achieved, the cost per test tends to range from 1.5 to 2.0 € irrespective of the different volumes. A wide dispersion of data for clinical laboratories with similar activity volumes is clearly present. For example, for laboratories with volumes of around 2 million tests/year, the cost per test ranges from 1.54 to 2.41 €, with a mean of 1.90 € per test. At the detailed analysis of the main characteristics of the individual laboratories (Table 1) it was ruled out that differences were related to a specific variable, such as the presence of a microbiology section, and/or a separate STAT laboratory. In fact, the final costs of a specific laboratory are affected by several variables, including the type of users (e.g., the complexity of the main organization, the number and type of specialties in the hospital, the number of production facilities of the laboratory and the different case mix and ratio between inpatients and outpatients).
Interestingly, the data obtained for the different laboratory specialties confirm the relationship between the test volumes and the cost per test for low activity volumes, while the same trend is no longer evident for medium-high volumes. It should be underlined that while for high volumes laboratories there are minimal variations in the cost per test, larger variations were found in small volume facilities, thus stressing the need for further improvements. On considering the relationships between volumes and number of staff, the linear relationship between the number of the senior staff and volumes is evident, whereas no such trend exists for medical technologists, for whom there seems to be a trend towards a plateau which, in turn, may be explained by the degree and type of automation used, in particular, in high volume clinical laboratories. A more detailed analysis of the relationships between staff number and the level of automation is in progress.
Conclusions
Since health economics is concerned with both the cost and consequences of any diagnostic and therapeutic procedure, it involves the identification, measurement, and evaluation of both costs and consequences (outcomes). Cost minimization, which can be considered the simplest possible approach, provides the least possible information as it evaluates the costs of alternative approaches that produce the same outcomes [10]. In laboratory medicine, it is applicable only to the cost of alternative suppliers of the same test, device, or instrument. Therefore, providing data on the cost per test, an all too often quoted parameter, cannot be considered a truly reliable tool in making an economic analysis because, rather than identifying an outcome, it merely demonstrates the provision of a test result. A more complex and thorough economic evaluation should be performed in order to gain a better understanding of the real value of a laboratory service, and this evaluation should include cost-benefit, cost-effectiveness, and cost-utility analysis since the final aim of a laboratory test is an action on the patient and the related analysis of the outcomes [11–13]. However, in laboratory medicine, not only have economic analyses usually been made by focusing on cost minimization: they have been made without taking into consideration all the variables affecting the final and true cost per test. In particular, it is taken for granted that an increase in volumes automatically leads to a reduction in costs. This, however, is not necessarily the case, as shown in the present activity-based costing analysis performed by us on different Italian clinical laboratories; the findings clearly demonstrate that several variables influence the end cost per test. In particular, the relationship between volumes and costs does not span the entire pattern of laboratories investigated and high costs are associated with low volumes up to a threshold of one million tests per year. Over this threshold there is no linear association between volumes and costs, laboratory organization rather than test volume appears to affect the final costs.
The present study, however, has several limitations. First, although the activity-based costing analysis was performed over a cycle of 3 years, the data reported are from the year 2009 as we considered the data collected after 1 year of practice more reliable. In future, we should report the data over a wider time frame, thus obtaining more information about the improvements achieved in the individual laboratories on the basis of the data collected and analyzed. Second, the data were collected in one country (Italy), mainly in public institutions within the national healthcare system (only two clinical laboratories were privately run). This means that the data are not automatically transferable to other countries with different healthcare system organizations, even if similar experiences have been reported from other European countries, including the UK. The strength of our study lies in the valuable methodology used, the number of laboratory facilities involved and its provision of sound data: all the information was collected from the laboratory or hospital information systems or, if not available electronically, from official sources. In the current literature there is a shortage of studies on the economic analysis of clinical laboratory services, and this means that many regional, national and international administrations have failed to achieve an evidence-based reorganization of their laboratory service.
In conclusion, the findings made in the present study, performed using a widely accepted method for economic analysis, the so-called activity-based costing analysis, confirm that the relationship between volumes and costs is not linear and that numerous variables should be taken into account. Laboratory organization as well as other management issues should be taken into consideration when planning projects for reorganizing the delivery of laboratory services in the healthcare system. In addition, as laboratory information plays an increasingly relevant role in patient management, the search for efficiency should always go hand in hand with the pursuit for effectiveness [14, 15]. Parsimonious care should not only hinge upon the most efficient possible ways of delivering laboratory services, but also on the best possible ways of assuring effectiveness through a rational organization that guarantees timeliness, and appropriateness in requesting tests and interpreting results. These goals can only be achieved through a closer cooperation between laboratory professionals and clinicians. In this sense, the updated Ethics Manual by the American College of Physicians [16] is extremely welcome, as it states that parsimonious care “... will help physicians to consider more carefully the tests and treatments they order and prescribe for patients” and “Parsimonious care that utilizes the most efficient means to effectively diagnose a condition and treat a patient respects the need to use resources wisely and to help ensure that resources are equitably available” [16]. Any (economic) gain should, therefore, be achieved by reorganizing laboratory services on the basis of the creation of value for patients rather than simply on mere consolidation based on volumes.
The authors wish to express their gratitude for the valuable support received given by Medical Systems (Genova, Italy) and for the involvement of the following clinical laboratories: Ospedali Riuniti di Bergamo, Azienda Ospedaliera, Laboratorio Analisi; Azienda Ulss 22, Bussolengo, Laboratorio Analisi; Azienda Ospedaliera di Busto Arsizio, Laboratorio Analisi; Laboratorio “Cemar” di Montecchio; Azienda Ospedaliera di Desenzano, Laboratorio Analisi; Azienda Ospedaliera di Careggi, Firenze, Laboratorio Analisi Centrale; Azienda Ospedaliera Meyer, Firenze, Laboratorio Analisi; Azienda Ospedaliera “Guido Salvini”, Garbagnate, Laboratorio Analisi; Azienda Ospedaliera S. Martino, Genova, Laboratorio Analisi Centrale; Azienda Ospedaliera Universitaria Policlinico “G. Martino”, Messina, U.O.C. Patologia Clinica; Azienda Ulss 12 Veneziana, Laboratorio Analisi, Mestre; A.S.L. Cn1, Mondovì, Laboratorio Analisi; Azienda U.L.S.S. 17, Este, Dipartimento Patologia Clinica; Gruppo Multimedica, Multilab; Azienda Ospedaliera di Padova, Dipartimento Medicina di Laboratorio; A.C.O. San Filippo Neri, Roma, Scienze Radiologiche e Medicina di Laboratorio; Azienda Sanitaria Locale Di Frosinone, Laboratorio Analisi, Sora; A.S.L. Vco, Verbania, S.O.C. Laboratorio Analisi; Azienda Ospedaliera Universitaria Integrata di Verona, Laboratorio Analisi D.U. Presidio Borgo Roma; Azienda Ulss 6, Vicenza, Dipartimento di Patologia Clinica, Laboratorio di Chimica Clinica ed Ematologia.
References
1. Callahan D. Cost control-time to get serious. N Engl J Med 2009;361:e10.10.1056/NEJMp0905630Search in Google Scholar PubMed
2. Plebani M, Lippi G. Is laboratory medicine a dying profession? Blessed are those who have not seen and yet have believed. Clin Biochem 2010;43:939–41.http://gateway.webofknowledge.com/gateway/Gateway.cgi?GWVersion=2&SrcApp=PARTNER_APP&SrcAuth=LinksAMR&KeyUT=000280026900001&DestLinkType=FullRecord&DestApp=ALL_WOS&UsrCustomerID=b7bc2757938ac7a7a821505f8243d9f310.1016/j.clinbiochem.2010.05.015Search in Google Scholar PubMed
3. Frybach DG, Thornbury JR. The efficacy of diagnostic imaging. Med Decis Making 1991;11:88–94.10.1177/0272989X9101100203Search in Google Scholar PubMed
4. Price CP, Christenson RH. Evidence-based laboratory medicine. Washington DC: AACC Press, 2007Search in Google Scholar PubMed
5. Lundberg GD. The need for an outcomes research agenda for clinical laboratory testing. J Am Med Assoc 1998;280:565–6.10.1001/jama.280.6.565Search in Google Scholar PubMed
6. Ferrante di Ruffano L, Hyde CJ, McCaffery KJ, Bossuyt PM, Deeks JJ. Assessing the value of diagnostic tests: a framework for designing and evaluating trials. Br Med J 2012;344:e686.http://gateway.webofknowledge.com/gateway/Gateway.cgi?GWVersion=2&SrcApp=PARTNER_APP&SrcAuth=LinksAMR&KeyUT=000300882500026&DestLinkType=FullRecord&DestApp=ALL_WOS&UsrCustomerID=b7bc2757938ac7a7a821505f8243d9f3Search in Google Scholar
7. Price CP. Evidence-based laboratory medicine: is it working in practice? Clin Biochem Rev 2012;33:13–9.Search in Google Scholar
8. Cooper R, Kaplan RS. Measure costs right: make the right decisions. Harvard Bus Rev 1988;66:96–103.Search in Google Scholar
9. Cooper R, Kaplan RS. Activity-based systems: measuring the costs of resource usage. Account Horiz 1992;Sept:1–13.Search in Google Scholar
10. Cao P, Toyabe S, Kurashima S, Okada M, Akazawa K. A modified method of activity-based costing for objectively reducing cost drivers in hospitals. Methods Inf Med 2006;45: 462–9.10.1055/s-0038-1634085Search in Google Scholar
11. Barletta G, Pastacaldi V, Peracino AP. La misura dei processi nella medicina di laboratorio. Genova, Italy: Caleidoscopio Italiano, 2007.Search in Google Scholar
12. Hansen BL. Il work sampling series: Azienda Moderna. Milano, Italy: Franco Angeli, 1975.Search in Google Scholar
13. Price CP, Bossuyt PM, Bruns DE. Introduction to laboratory medicine and evidence-based laboratory medicine. In: Burtis CA, Ashwood ER, Bruns DE. Tietz textbook of clinical chemistry and molecular diagnostics. 4th ed. St. Louis: Elsevier Saunders, 2006. pp 323–51.Search in Google Scholar
14. Lundberg GD. Acting on significant laboratory results. J Am Med Assoc 1981;245:1762–3.10.1001/jama.1981.03310420052033Search in Google Scholar PubMed
15. Plebani M, Laposata M, Lundberg GD. The brain-to-brain loop concept for laboratory testing 40 years after its introduction. Am J Clin Pathol 2011;136:829–33.http://gateway.webofknowledge.com/gateway/Gateway.cgi?GWVersion=2&SrcApp=PARTNER_APP&SrcAuth=LinksAMR&KeyUT=000297274500001&DestLinkType=FullRecord&DestApp=ALL_WOS&UsrCustomerID=b7bc2757938ac7a7a821505f8243d9f310.1309/AJCPR28HWHSSDNONSearch in Google Scholar PubMed
16. Snyder L, for the American College of Physicians Ethics, Professionalism, and Human Rights Committee. American College of Physicians Ethics Manual: Sixth edition. Ann Intern Med 2012;156:73–104.10.7326/0003-4819-156-1-201201031-00001Search in Google Scholar PubMed
©2013 by Walter de Gruyter Berlin Boston
Articles in the same Issue
- Letters to the Editor
- Performance evaluation of three different immunoassays for detection of antibodies to hepatitis B core
- Serum homocysteine concentrations in Chinese children with autism
- Interchangeability of venous and capillary HbA1c results is affected by oxidative stress
- Interference of hemoglobin (Hb) N-Baltimore on measurement of HbA1c using the HA-8160 HPLC method
- First human isolate of Mycobacterium madagascariense in the sputum of a patient with tracheobronchitis
- Protein S and protein C measurements should not be undertaken during vitamin K antagonist therapy
- α2-HS glycoprotein is an essential component of cryoglobulin associated with chronic hepatitis C
- An unusual interference in CK MB assay caused by a macro enzyme creatine phosphokinase (CK) type 2 in HIV-infected patients
- An automated technique for the measurement of the plasma glutathione reductase activity and determination of reference limits for a healthy population
- Is osteopontin stable in plasma and serum?
- Evidence-based approach to reducing perceived wasteful practices in laboratory medicine
- Masthead
- Masthead
- Editorials
- Testing volume is not synonymous of cost, value and efficacy in laboratory diagnostics
- Lessons from controversy: biomarkers evaluation
- Commercial immunoassays in biomarkers studies: researchers beware!1)
- Trials and tribulations in lupus anticoagulant testing
- Reviews
- Mass spectrometry: a revolution in clinical microbiology?
- Chronic Chagas disease: from basics to laboratory medicine
- General Clinical Chemistry and Laboratory Medicine
- Shop for quality or quantity? Volumes and costs in clinical laboratories
- Minor improvement of venous blood specimen collection practices in primary health care after a large-scale educational intervention
- Evaluation of high resolution gel β2-transferrin for detection of cerebrospinal fluid leak
- Serum kallikrein-8 correlates with skin activity, but not psoriatic arthritis, in patients with psoriatic disease
- Soluble urokinase plasminogen activator receptor (suPAR) in the assessment of inflammatory activity of rheumatoid arthritis patients in remission
- Bone mass density selectively correlates with serum markers of oxidative damage in post-menopausal women
- Validation of a fast and reliable liquid chromatography-tandem mass spectrometry (LC-MS/MS) with atmospheric pressure chemical ionization method for simultaneous quantitation of voriconazole, itraconazole and its active metabolite hydroxyitraconazole in human plasma
- Performance of different screening methods for the determination of urinary glycosaminoclycans
- Intestinal permeability and fecal eosinophil-derived neurotoxin are the best diagnosis tools for digestive non-IgE-mediated cow’s milk allergy in toddlers
- An internal validation approach and quality control on hematopoietic chimerism testing after allogeneic hematopoietic cell transplantation
- Serum levels of IgG antibodies against oxidized LDL and atherogenic indices in HIV-1-infected patients treated with protease inhibitors
- Cooperation experience in a multicentre study to define the upper limits in a normal population for the diagnostic assessment of the functional lupus anticoagulant assays
- Contribution of procoagulant phospholipids, thrombomodulin activity and thrombin generation assays as prognostic factors in intensive care patients with septic and non-septic organ failure
- Suitability of POC lactate methods for fetal and perinatal lactate testing: considerations for accuracy, specificity and decision making criteria
- Point-of-care testing on admission to the intensive care unit: lactate and glucose independently predict mortality
- Reference Values and Biological Variations
- CA125 reference values change in male and postmenopausal female subjects
- Distributions and ranges of values of blood and urinary biomarker of inflammation and oxidative stress in the workers engaged in office machine manufactures: evaluation of reference values
- Cancer Diagnostics
- Association of acute phase protein-haptoglobin, and epithelial-mesenchymal transition in buccal cancer: a preliminary report
- Comparison of diagnostic and prognostic performance of two assays measuring thymidine kinase 1 activity in serum of breast cancer patients
- Evaluation of the BRAHMS Kryptor® Thyroglobulin Minirecovery Test in patients with differentiated thyroid carcinoma

