Charge-offs, Defaults and the Financial Accelerator
-
Christopher M. Gunn
 ,
Alok Johri
,
Alok Johri

Abstract
U.S. banks countercyclically vary the ratio of charge-offs to defaulted loans (COD) and the standard deviation of COD is roughly 15 times that of GDP. We show that canonical financial accelerator models cannot explain these facts, but introducing stochastic default costs and stochastic risk can potentially resolve the discrepancy. Estimating the augmented model and including both surprise and news shocks reveals that default cost news shocks account for most of the variance of COD. Also, in the many model specifications we work with, default cost news shocks always account for at least 20 percent of the variance of investment, while risk news shocks account for a significant portion of the variation in the credit spread, and around 10 percent of the variation in investment growth. Both news shocks also account for a material amount of the variance of hours and output growth.
Funding source: Social Science and Humanities Research Council of Canada
Award Identifier / Grant number: 435-2016-0708
Award Identifier / Grant number: 435 2020 0567
Acknowledgments
The authors thank the referees and editor as well as conference and seminar participants at the 2018 CEA meetings, the 2017 SAET meetings and the 2016 CEF meetings. Gunn and Johri received research support from grants from the Social Sciences and Humanities Research Council (SSHRC) of Canada.
Appendix A: Data
Real Gross Domestic Product, 3 Decimal, Billions of Chained 2009 Dollars, Quarterly, Seasonally Adjusted Annual Rate.
Source: search on series code GDPC96 at https://fred.stlouisfed.org/
Gross Domestic Product – Implicit Price Deflator - 1996=100, Seasonally Adjusted
Source: search on series code GDPDEF at https://fred.stlouisfed.org/
Personal Consumption Expenditures, Billions of Dollars, Seasonally Adjusted Annual Rate
Source: search on series code PCEC at https://fred.stlouisfed.org/
Fixed Private Investment, Billions of Dollars, Seasonally Adjusted Annual Rate
Source: search on series code FPI at https://fred.stlouisfed.org/
Civilian Employment: Sixteen Years and Over, Thousands, Seasonally Adjusted
Source: search on series code CE16OV at https://fred.stlouisfed.org/
Effective Federal Funds Rate
Source: search on FEDFUNDS at https://fred.stlouisfed.org/
Average Weekly Hours Duration, Nonfarm Business, All Persons, : index, 1992 = 100, Seasonally Adjusted
Source: search on series code PRS85006023 at https://fred.stlouisfed.org/
Hourly Compensation Duration, Nonfarm Business, All Persons, : index, 1992 = 100, Seasonally Adjusted.
Source: Search series id PRS85006103 at U.S. Bureau of Labour Statistics, http://data.bls.gov/cgi-bin/srgate
Labor Force Status: Civilian noninstitutional population – Age: 16 years and over – Seasonally Adjusted – Number in thousands.
Source: Search series id LNS10000000 at U.S. Bureau of Labour Statistics, http://data.bls.gov/cgi-bin/srgate
Credit Spread: Moody’s Seasoned Baa Corporate Bond Yield Relative to Yield on 10-Year Treasury Constant Maturity, Percent, Quarterly, Not Seasonally Adjusted.
Source: search on series code BAA10YM at https://fred.stlouisfed.org/
Charge-offs: Total charge-offs on Total Loans and Leases, All FDIC-Insured Institutions, Millions of Dollars,
Source: Quarterly Loan Portfolio Performance Indicators
https://www.fdic.gov/analysis/quarterly-banking-profile/index.html
Defaults: Loans 90 days or more past due, All FDIC-Insured Institutions, Millions of Dollars,
Source: Quarterly Loan Portfolio Performance Indicators
https://www.fdic.gov/analysis/quarterly-banking-profile/index.html
QUSPAMUSDA: Total Credit to Private Non-Financial Sector, Adjusted for Breaks, for United States. Source: search on series code QUSPAMUSDA at https://fred.stlouisfed.org/
Comparison of alternative news specifications evaluated at the mode.
| Specification | Log data density |
|---|---|
| No news | −2061.53 |
| News 4pd and 8pd | −2061.18 |
| News 8pd and 12 pd | −2054.45 |
| News 4pd, 8pd and 12pd | −2056.96 |
Benchmark Model: priors and posteriors – Economic parameters.
| Description | Parameter | Prior mean | Posterior mode | SD | Prior distrib. | Prior std dev. |
|---|---|---|---|---|---|---|
| Habit in consumption | b′ | 0.5 | 0.5520 | 0.0554 | beta | 0.1 |
| Curvature, investment adjust cost | s″ | 4 | 7.5409 | 1.2399 | norm | 2 |
| Curvature, utilization cost | ϵ | 0.5 | 0.7681 | 0.1024 | beta | 0.1 |
| Monetary policy smoothing parameter | ρ rn | 0.75 | 0.9039 | 0.0086 | beta | 0.1 |
| Monetary policy weight on inflation | ϕ pi | 1.5 | 1.9907 | 0.1860 | gamm | 0.25 |
| Monetary policy weight on output | ϕ y | 0.25 | 0.6221 | 0.0825 | gamm | 0.05 |
| Calvo price stickiness | ζ p | 0.66 | 0.9574 | 0.0064 | beta | 0.15 |
| Calvo wage stickiness | ζ w | 0.66 | 0.9282 | 0.0127 | beta | 0.15 |
| Price indexing weight on inflation | ι p | 0.5 | 0.2360 | 0.0684 | beta | 0.15 |
| Price indexing weight on wage inflation | ι w | 0.5 | 0.6840 | 0.1387 | beta | 0.15 |
| Steady state default cost | θ | 0.12 | 0.0986 | 0.0123 | beta | 0.1 |
| Steady state default rate |
|
0.0076 | 0.0075 | 0.0011 | gamm | 0.001 |
Benchmark Model: priors and posteriors – Shock parameters.
| Description | Parameter | Prior mean | Posterior mode | SD | Prior distrib. | Prior std dev. |
|---|---|---|---|---|---|---|
| Autocorrelation of shocks | ||||||
| Stationary tech. process | ρ z | 0.5 | 0.9682 | 0.0671 | beta | 0.2 |
| Non-stat tech. process | ρ gy | 0.5 | 0.3579 | 0.1139 | beta | 0.2 |
| MEI process | ρ mei | 0.5 | 0.9658 | 0.0101 | beta | 0.2 |
| Preference process | ρ J | 0.5 | 0.9600 | 0.0139 | beta | 0.2 |
| Government spending process | ρ g | 0.5 | 0.9805 | 0.0183 | beta | 0.2 |
| Price markup process |
|
0.5 | 0.2070 | 0.0967 | beta | 0.2 |
| Wage markup process |
|
0.5 | 0.1417 | 0.0750 | beta | 0.2 |
| Standard deviation of shocks | ||||||
| Stat. tech., unanticipated | ϵ z | 0.5 | 0.2447 | 0.0469 | invg | 1 |
| Stat. tech., anticipated 8pd |
|
0.5 | 0.2067 | 0.0466 | invg | 1 |
| Stat. tech., anticipated 12pd |
|
0.5 | 0.2231 | 0.0530 | invg | 1 |
| N-S tech., unanticipated | ϵ gy | 0.5 | 0.2563 | 0.0511 | invg | 1 |
| N-S tech., anticipated 8pd |
|
0.5 | 0.1694 | 0.0356 | invg | 1 |
| N-S tech., anticipated 12pd |
|
0.5 | 0.1778 | 0.0405 | invg | 1 |
| MEI, unanticipated | ϵ m | 0.5 | 2.3712 | 0.7222 | invg | 1 |
| MEI, anticipated 8pd |
|
0.5 | 0.2343 | 0.1027 | invg | 1 |
| MEI, anticipated 12pd |
|
0.5 | 1.3620 | 0.1032 | invg | 1 |
| Preferences | ϵ J | 0.1 | 2.0174 | 0.2951 | invg | 1 |
| Monetary policy, unanticipated | ϵ η | 0.1 | 0.0721 | 0.0089 | invg | 1 |
| Monetary policy, anticipated 8pd |
|
0.1 | 0.0724 | 0.0095 | invg | 1 |
| Monetary policy, anticipated 12pd |
|
0.1 | 0.0819 | 0.0122 | invg | 1 |
| Gov’t spending, unanticipated | ϵ g | 0.5 | 2.5338 | 0.8333 | invg | 1 |
| Gov’t spending, anticipated 8pd |
|
0.5 | 0.2555 | 0.8129 | invg | 1 |
| Gov’t spending, anticipated 12pd |
|
0.5 | 0.2556 | 0.6963 | invg | 1 |
| Price markup |
|
0.1 | 0.1150 | 0.0116 | invg | 1 |
| Wage markup |
|
0.1 | 0.3749 | 0.0323 | invg | 1 |
| Measurement error | ϵ meas | 0.5 | 47.512 | 2.3363 | invg | 2 |

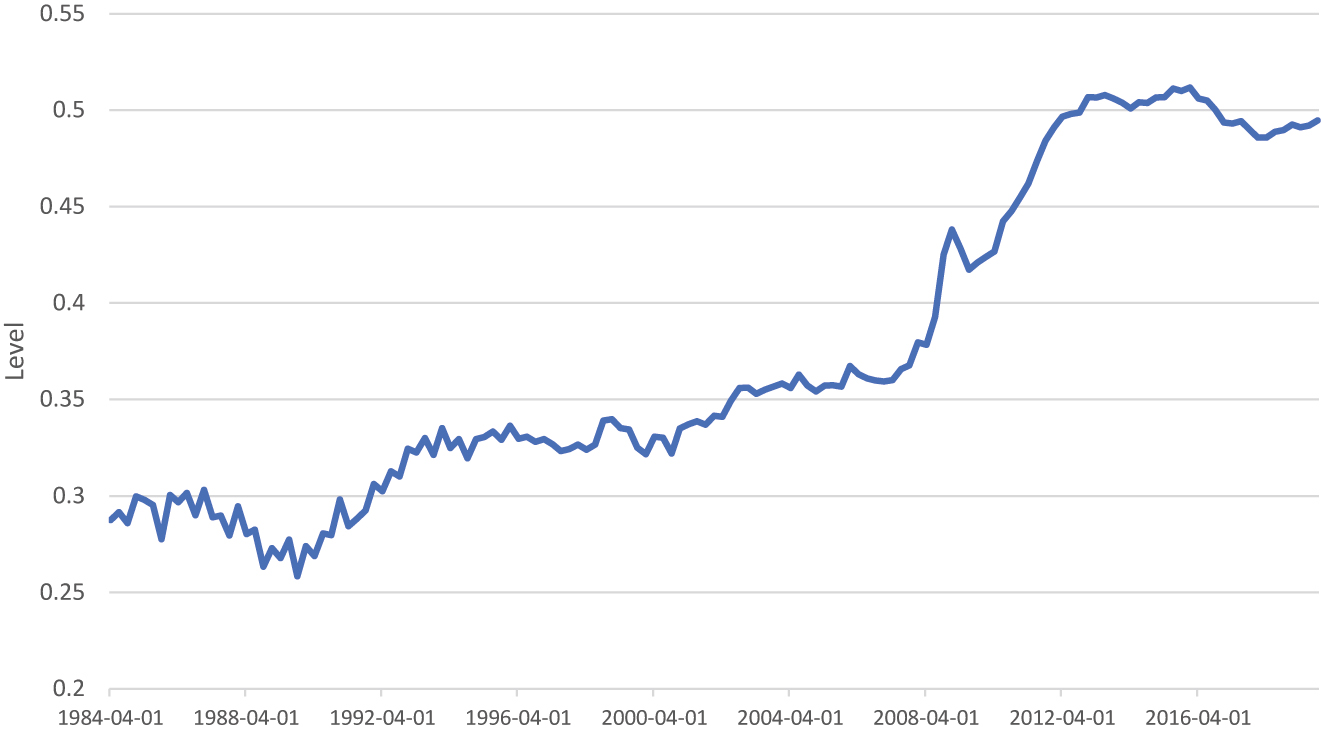
Default cost (θ t ).
Risk
References
Ajello, A. 2016. “Financial Intermediation, Investment Dynamics, and Business Cycle Fluctuations.” The American Economic Review 106: 2256–303. https://doi.org/10.1257/aer.20120079.Search in Google Scholar
An, S., and F. Schorfheide. 2007. “Bayesian Analysis of DSGE Models.” The American Economic Review 26: 113–72. https://doi.org/10.1080/07474930701220071.Search in Google Scholar
Aysun, U., and A. Honig. 2011. “Bankruptcy Costs, Liability Dollarization, and Vulnerability to Sudden Stops.” Journal of Development Economics 95: 201–11. https://doi.org/10.1016/j.jdeveco.2010.04.005.Search in Google Scholar
Bernanke, B. S., M. Gertler, and S. Gilchrist. 1999. “The Financial Accelerator in a Quantitative Business Cycle Framework.” In Handbook of Macroeconomics, Vol. 1, edited by J. B. Taylor, and M. Woodford, 1341–93. Amsterdam: Elsevier. Chapter 21.10.1016/S1574-0048(99)10034-XSearch in Google Scholar
Candian, G., and M. Dmitriev. 2020. “Default Recovery Rates and Aggregate Fluctuations.” Journal of Economic Dynamics and Control 121: 104011. https://doi.org/10.1016/j.jedc.2020.104011.Search in Google Scholar
Carlstrom, C. T., and T. S. Fuerst. 1997. “Agency Costs, Net Worth, and Business Fluctuations: A Computable General Equilibrium Analysis.” The American Economic Review 87: 893–910.10.26509/frbc-wp-199602Search in Google Scholar
Christiano, L. J., R. Motto, and M. Rostagno. 2003. “The Great Depression and the Friedman-Schwartz Hypothesis.” Proceedings: 1119–215, https://doi.org/10.1353/mcb.2004.0023. Also available at http://ideas.repec.org/a/fip/fedcpr/y2003p1119-1215.html.Search in Google Scholar
Christiano, L. J., R. Motto, and M. Rostagno. 2014. “Risk Shocks.” The American Economic Review 104: 27–65. https://doi.org/10.1257/aer.104.1.27.Search in Google Scholar
Cooper, R., and J. Ejarque. 2000. “Financial Intermediation and Aggregate Fluctuations: A Quantitative Analysis.” Macroeconomic Dynamics 4: 423–47. https://doi.org/10.1017/s1365100500017016.Search in Google Scholar
Curdia, V., and M. Woodford. 2009. Conventional and Unconventional Monetary Policy.10.2139/ssrn.1504864Search in Google Scholar
Fuentes-Albero, C. 2019. “Financial Frictions, Financial Shocks, and Aggregate Volatility.” Journal of Money, Credit, and Banking 51: 1581–621. https://doi.org/10.1111/jmcb.12554. Also available at https://ideas.repec.org/a/wly/jmoncb/v51y2019i6p1581-1621.html.Search in Google Scholar
Goodfriend, M., and B. T. McCallum. 2007. “Banking and Interest Rates in Monetary Policy Analysis: A Quantitative Exploration.” Journal of Monetary Economics 54: 1480–507. https://doi.org/10.1016/j.jmoneco.2007.06.009. Also available at https://ideas.repec.org/a/eee/moneco/v54y2007i5p1480-1507.html.Search in Google Scholar
Gunn, C. M. 2018. “Overaccumulation, Interest, and Prices.” Journal of Money, Credit, and Banking 50: 479–511. https://doi.org/10.1111/jmcb.12468. Also available at https://ideas.repec.org/a/wly/jmoncb/v50y2018i2-3p479-511.html.Search in Google Scholar
Gunn, C. M., and A. Johri. 2011. “News, Intermediation Efficiency and Expectations-Driven Boom-Bust Cycles.” In Department of Economics Working Papers. McMaster University.Search in Google Scholar
Gunn, C. M., and A. Johri. 2013. “An Expectations-Driven Interpretation of the “Great Recession”.” Journal of Monetary Economics 60: 391–407. https://doi.org/10.1016/j.jmoneco.2013.04.003.Search in Google Scholar
Justiniano, A., G. E. Primiceri, and A. Tambalotti. 2011. “Investment Shocks and the Relative Price of Investment.” Review of Economic Dynamics 14: 102–21. https://doi.org/10.1016/j.red.2010.08.004.Search in Google Scholar
Kiyotaki, N., and J. Moore. 2012. “Liquidity, Business Cycles, and Monetary Policy.” In Working Paper 17934. National Bureau of Economic Research.10.3386/w17934Search in Google Scholar
Levin, A. T., F. M. Natalucci, E. Zakrajsek, 2004. The Magnitude and Cyclical Behavior of Financial Market Frictions. Technical Report.10.2139/ssrn.655363Search in Google Scholar
Richard Higgins, C. 2020. “Financial Frictions and Changing Macroeconomic Volatility.” Journal of Macroeconomics 64. https://doi.org/10.1016/j.jmacro.2020.10310.1016/j.jmacro.2020.103204. Also available at https://ideas.repec.org/a/eee/jmacro/v64y2020ics0164070419302629.html.Search in Google Scholar
Schmitt-Grohe, S., and M. Uribe. 2007. “Optimal Inflation Stabilization in a Medium-Scale Macroeconomic Model.” In Monetary Policy under Inflation Targeting, p. 125–86.10.2139/ssrn.891011Search in Google Scholar
Smets, F., and R. Wouters. 2007. “Shocks and Frictions in Us Business Cycles: A Bayesian Dsge Approach.” The American Economic Review 97: 586–606. https://doi.org/10.1257/aer.97.3.586.Search in Google Scholar
Supplementary Material
The online version of this article offers supplementary material (https://doi.org/10.1515/bejm-2021-0078).
© 2022 Walter de Gruyter GmbH, Berlin/Boston
Articles in the same Issue
- Frontmatter
- Advances
- A New General Equilibrium Welfare Measure, with Application to Labor Income Taxes
- Labor Share Dynamics and Factor Complementarity
- Effect of Monetary Policy on Government Spending Multiplier
- News-Driven Housing Booms: Spain Versus Germany
- Sovereign Debt Crisis, Fiscal Consolidation, and Active Central Bankers in a Monetary Union
- Housing Taxation and Economic Growth: Analysis of a Balanced-Growth Model with Residential Capital
- Intergenerational Linkages, Uncertain Lifetime and Educational and Health Expenditures
- Contributions
- Tolerance of Informality and Occupational Choices in a Large Informal Sector Economy
- Uncertainty Shocks, Innovation, and Productivity
- Asymmetric Effects of Private Debt on Income Growth
- Interpreting Structural Shocks and Assessing Their Historical Importance
- Charge-offs, Defaults and the Financial Accelerator
- Filtering Persistent and Asymmetric Cycles
- Population Aging and Convergence of Household Credit
- Robustly Optimal Monetary Policy in a Behavioral Environment
- Forward Guidance Effectiveness in a New Keynesian Model with Housing Frictions
- The Welfare Effects of Social Insurance Reform in the Presence of Intergenerational Transfers