Monetary business cycle accounting for Sweden
-
Pedro Brinca


Abstract
When creating competing models of economic fluctuations, researchers typically introduce frictions in their models aiming at replicating the observed movements in the data. This paper implements a business cycle accounting procedure for the Swedish economy. Both the 1990s and the 2008 recessions are given special focus. Evidence is provided for properties that structural extensions to the business cycle model need to have in order to replicate the movements in the data. Distortions to the labor market and movements in total factor productivity are the most determinant features to be modeled with respect to real variables as well as deviations from a Taylor rule for interest rate setting, though the latter plays little role for both the 1990s and the 2008 recessions. The distortions share a structural break during the 1990s crisis but not during the recent one.
- 1
In the prototype economy, the wedge appears as a tax to investment rather than capital holdings. Chari, Kehoe, and McGrattan (2007b) show that in theory, it makes no difference. However, it does affect the probability space for the wedges when we work with approximated economies, though the effect of including a wedge that appears as a tax to investment versus capital holdings is found by Sustek (2010) to be quantitatively irrelevant in the context of the US economy.
- 2
The result is robust to different specifications of the breaking point during the crisis.
- 3
In this case, the results are more sensitive to the choice of the breaking point, given that we are too close to the end of the sample and the power of the test is thus greatly decreased.
- 4
The value of 1.64 is when compared with the 1990s crisis. If compared with the non-crisis periods, the result is still signficant and equal to 1.47.
- 5
Bear in mind that (Chari, Kehoe, and McGrattan 2007a) define 1–τl,t as the labor wedge which leads the authors to conclude it to be procyclical.
I am grateful for comments from Martin Flodén, Annika Alexius, Johan Söderberg, John Hassler, Almut Baleer, Abdulaziz Shifa, Yangzhou Yuan, Anna Lindahl, Alper Çenesiz, Kjetil Storesletten, Pedro Raposo, Tiago Cavalcanti (the editor), anonymous referees, seminar participants at NESU, FEUC, NIPE and, in particular, Sirus Dehdari for excellent research assistance.
Appendix A
Simulated vs. Observed data for 1982–2010
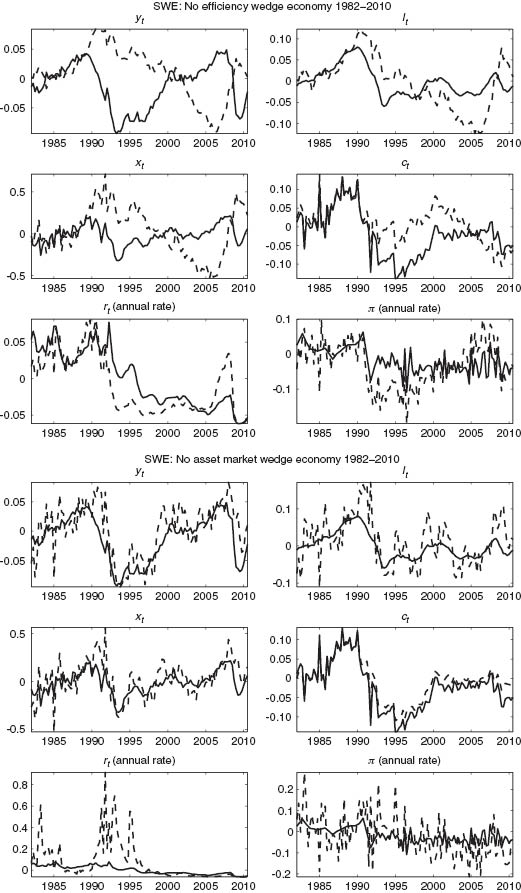
Observed data “—”, Simulated data “– –”
rt and πt in absolute % deviation from steady state. All others in relative % deviations.
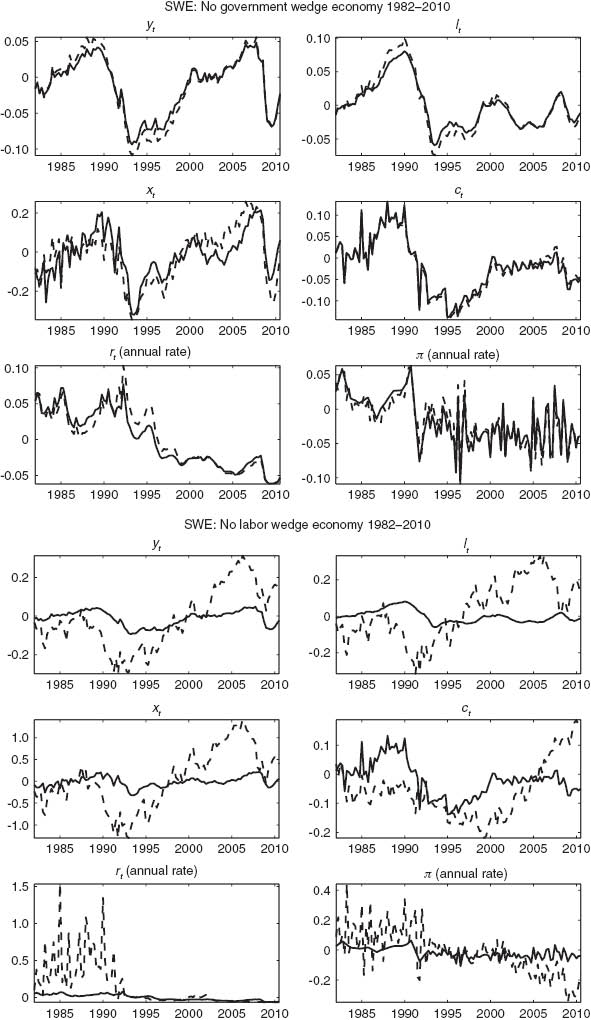
Observed data “—”, Simulated data “– –”
rt and πt in absolute % deviation from steady state. All others in relative % deviations.
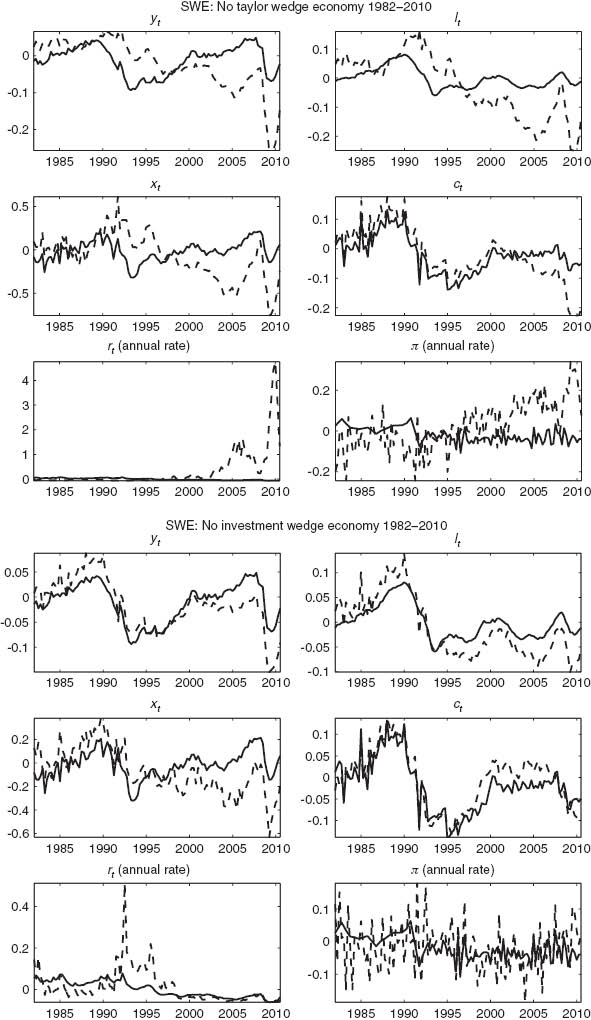
Observed data “—”, Simulated data “– –”
rt and πt in absolute % deviation from steady state. All others in relative % deviations.
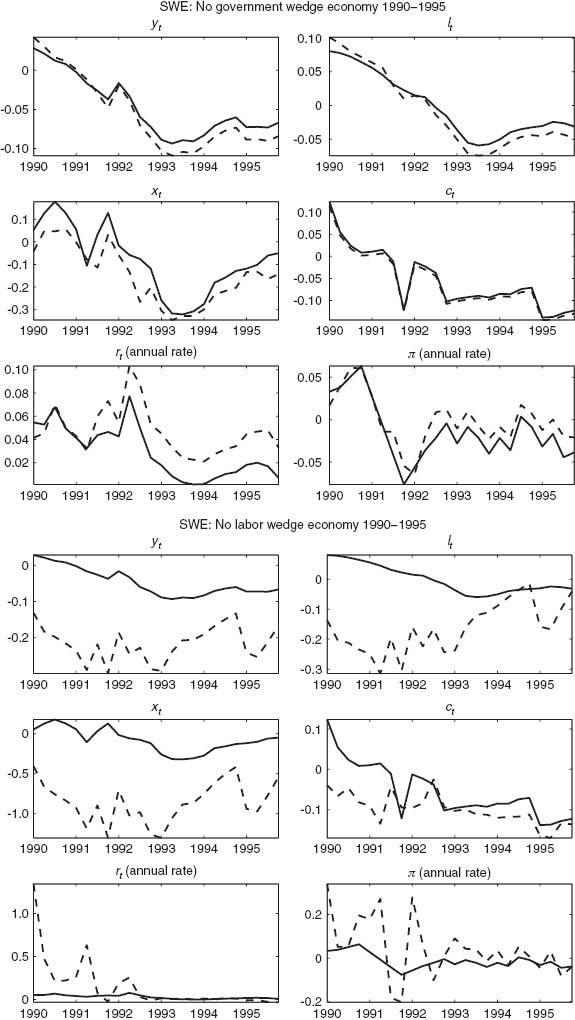
Appendix B
Simulated vs. Observed data for 1990–1995
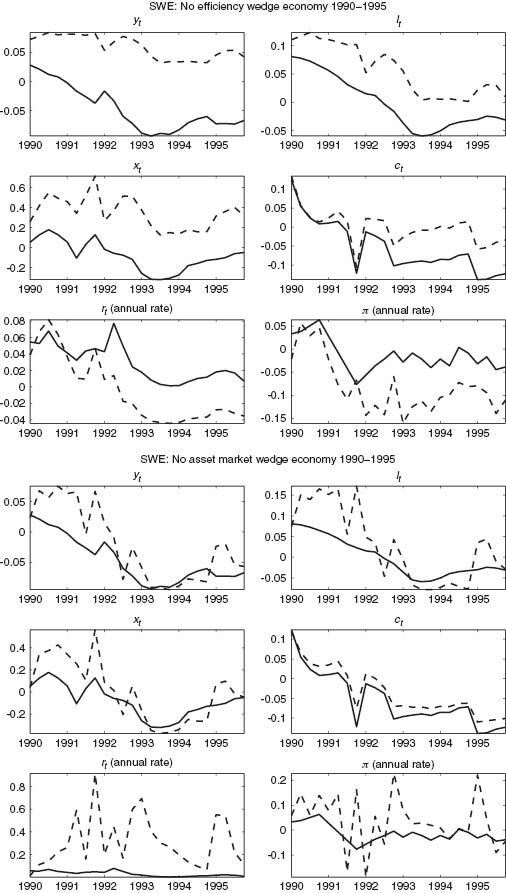
Observed data “—”, Simulated data “– –”
rt and πt in absolute % deviation from steady state. All others in relative % deviations.
Observed data “—”, Simulated data “– –”
rt and πt in absolute % deviation from steady state. All others in relative % deviations.
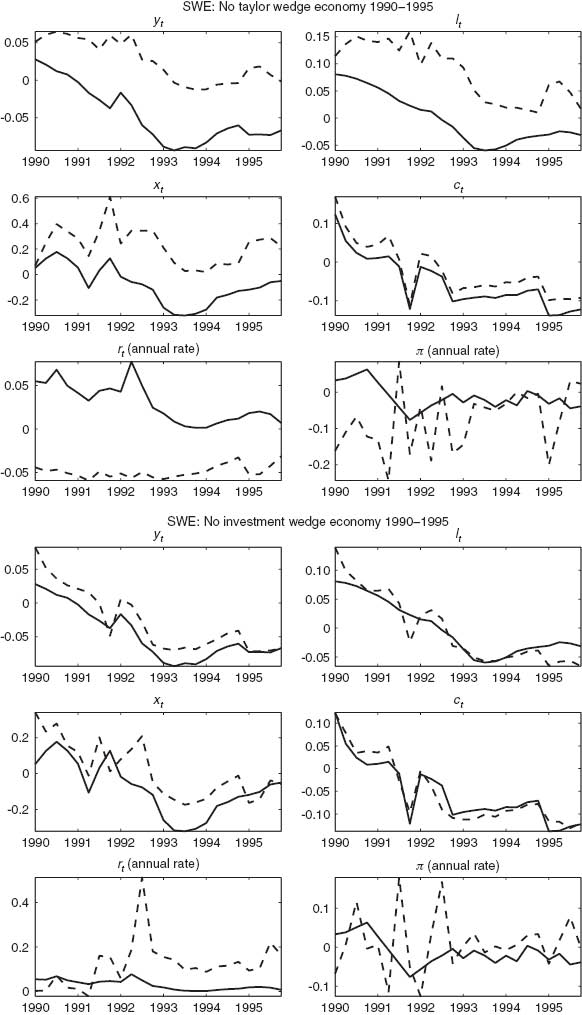
Observed data “—”, Simulated data “– –”
rt and πt in absolute % deviation from steady state. All others in relative % deviations.
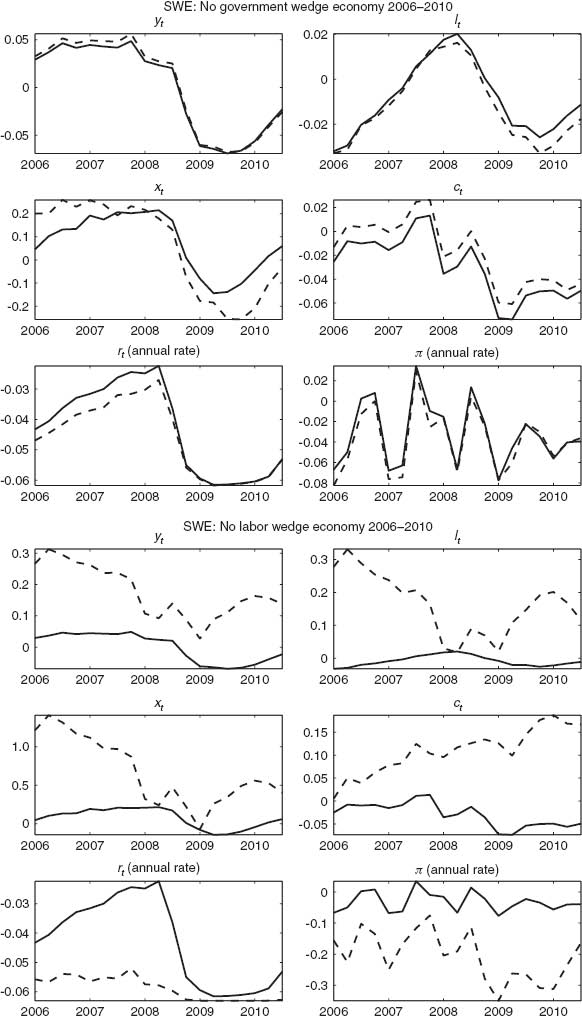
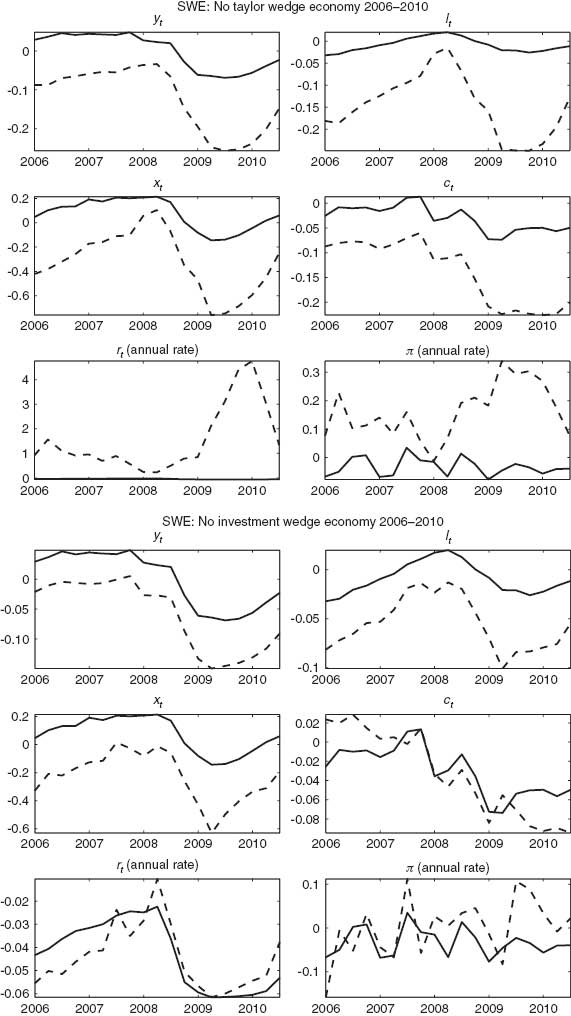
Appendix C
Simulated vs. Observed data for 2006–2010
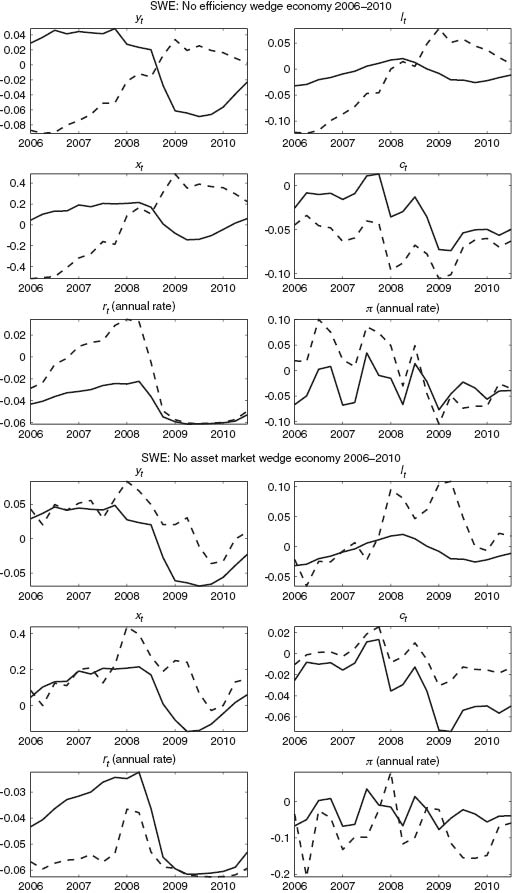
Observed data “—”, Simulated data “– –”
rt and πt in absolute % deviation from steady state. All others in relative % deviations.
Observed data “—”, Simulated data “– –”
rt and πt in absolute % deviation from steady state. All others in relative % deviations.
Observed data “—”, Simulated data “– –”
rt and πt in absolute % deviation from steady state. All others in relative % deviations.
References
Assarsson, B., and P. Jansson. 1998. “Unemployment Persistence: The Case of Sweden.” Applied Economic Letters 5 (1): 25–29.10.1080/758540121Search in Google Scholar
Cavalcanti, T. V. 2007. “Business Cycle and Level Accounting: The Case of Portugal.” Portuguese Economic Journal 6 (1): 47–64.10.1007/s10258-006-0017-2Search in Google Scholar
Chakraborty, S., and K. Otsu. 2012. “Deconstructing Growth – A Business Cycle Accounting Approach with Application to Brics.” MPRA Paper No. 41076.Search in Google Scholar
Chari, V., P. Kehoe, and E. McGrattan. 2007a. “Business Cycle Accounting.” Econometrica 75: 781–836.10.1111/j.1468-0262.2007.00768.xSearch in Google Scholar
Chari, V., P. Kehoe, and E. McGrattan. 2007b. “Comparing Alternative Representations, Methodologies and Decompositions in Business Cylce Accounting.” Federal Reserve Bank of Minneapolis Staff Reports 384.Search in Google Scholar
Cho, D., and A. Doblas-Madrid. 2012. “Business Cycle Accounting East and West: Asian Finance and the Investment Wedge.” Review of Economic Dynamics, Forthcoming. Available at: http://www.economicdynamics.org/RED14.htm.Search in Google Scholar
Christiano, L., and M. Eichenbaum. 1992. “Liquidity Effects and the Monetary Transmission Mechanism.” American Economic Review 82: 346–353.Search in Google Scholar
Christiano, L., M. Trabandt, and K. Walentin. 2011. “Introducing Financial Frictions and Unemployment into a Small Open Economy Model.” Sveriges Riksbank Working Paper Series, 214.Search in Google Scholar
Domeij, D., and M. Flodén. 2006. “Population Ageing and International Capital Flows.” International Economic Review 47 (3): 1013–1032.10.1111/j.1468-2354.2006.00404.xSearch in Google Scholar
Gao, X., and C. Ljungwall. 2009. “Sources of Business Cycle Fluctuactions: Comparing China and India.” China Economic Research Center Working Paper Series, May(7).Search in Google Scholar
Hansen, G., and K. Singleton. 1983. “Stochastic Consumption, Risk Aversion and the Temporal Behavior of Asset Returns.” Journal of Political Economy 91: 249–265.10.1086/261141Search in Google Scholar
Hassler, J., P. Lundvik, T. Persson, and P. Söderlind. 1992. “The Swedish Business Cycle: Stylized Facts Over 130 Years.” Federal Reserve Bank of Minneapolis, Institute for Empirical Macroeconomics Discussion Papers, 63.Search in Google Scholar
Hassler, J. 2010. Sweden in Past, Current and Future Economic Crisis – A Report for the OECD Economics Department. Technical report, Institute for International Economic Studies-Stockholm University.Search in Google Scholar
Kobayashi, K., and M. Inaba. 2006. “Business Cycle Accounting for the Japanese Economy.” RETI Discussion Paper, 05-E-023.Search in Google Scholar
Lama, R. 2009. “Accounting for Output Drops in Latin America.” IMF Working Paper Series, 67.Search in Google Scholar
Mincer, Jacob A., and Victor Zarnowitz. 1969. “The evaluation of economic forecasts.” Economic Forecasts and Expectations: Analysis of Forecasting Behavior and Performance. NBER. 1-46.Search in Google Scholar
Mulligan, C. 2002. “A Dual Method of Empirically Evaluating Dynamic Competitive Equilibrium Models with Market Distortions, Applied to the Great Depression and World War II.” NBER Working Paper, 8775.10.3386/w8775Search in Google Scholar
Otsu, K. 2009. “International Business Cycle Accounting.” IMES Discussion Paper Series, 29.Search in Google Scholar
Prescott, E. C. 2002. “Prosperity and Depression.” The American Economic Review 92 (2): 1–15.10.1257/000282802320188916Search in Google Scholar
Saijo, H. 2008. “The Japanese Depression in the Interwar Period: A General Equilibrium Analysis.” The BE Journal of Macroeconomics 8(1): Article 25.10.2202/1935-1690.1614Search in Google Scholar
Simonovska, I., and L. Söderling. 2008. “Business Cycle Accounting for Chile.” IMF Working Paper Series, 61.Search in Google Scholar
Sustek, R. 2010. “Monetary Business Cycle Accounting.” Review of Economic Dynamics 14 (4): 592–612.10.1016/j.red.2010.10.001Search in Google Scholar
Svensson, L. 2012. “The Possible Unemployment Cost of Average Inflation Below a Credible Target.” preprint (2012), available at http://people.su.se/leosven/papers/Phillips.pdf.10.3386/w19442Search in Google Scholar
©2013 by Walter de Gruyter Berlin Boston
Articles in the same Issue
- Masthead
- Masthead
- Advances
- How have global shocks impacted the real effective exchange rates of individual euro area countries since the euro’s creation?
- Employment by age, education, and economic growth: effects of fiscal policy composition in general equilibrium
- Overeducation and skill-biased technical change
- Strategic wage bargaining, labor market volatility, and persistence
- Households’ uncertainty about Medicare policy
- Contributions
- Deconstructing shocks and persistence in OECD real exchange rates1)
- A contribution to the empirics of welfare growth
- Development accounting with wedges: the experience of six European countries
- Implementation cycles, growth and the labor market
- International technology adoption, R&D, and productivity growth
- Bequest taxes, donations, and house prices
- Business cycle accounting of the BRIC economies
- Privately optimal severance pay
- Small business loan guarantees as insurance against aggregate risks
- Output growth and unexpected government expenditures
- International business cycles and remittance flows
- Effects of productivity shocks on hours worked: UK evidence
- A prior predictive analysis of the effects of Loss Aversion/Narrow Framing in a macroeconomic model for asset pricing
- Exchange rate pass-through and fiscal multipliers
- Credit demand, credit supply, and economic activity
- Distortions, structural transformation and the Europe-US income gap
- Monetary policy shocks and real commodity prices
- Topics
- News-driven international business cycles
- Business cycle dynamics across the US states
- Required reserves as a credit policy tool
- The macroeconomic effects of the 35-h workweek regulation in France
- Productivity and resource misallocation in Latin America1)
- Information and communication technologies over the business cycle
- In search of lost time: the neoclassical synthesis
- Divorce laws and divorce rate in the US
- Is the “Great Recession” really so different from the past?
- Monetary business cycle accounting for Sweden