The Effect of Elevating the Supplemental Poverty Measure on Government Program Eligibility and Spending
-
Kevin Corinth


Abstract
A recent National Academy of Sciences report recommends elevating the Supplemental Poverty Measure (SPM) to the “nation’s headline poverty statistic.” I project how making the SPM the official poverty measure would affect eligibility for government assistance programs whose eligibility thresholds are tied to the official poverty line. Making the SPM the official poverty measure would increase the poverty line for a family of four by 20 percent in 2024. The eligibility threshold for a family of four would consequentially increase by $8320 for the Supplemental Nutrition Assistance Program (SNAP), $8512 for Medicaid adults, and by larger amounts for Medicare Part D Low Income Subsidies, the National School Lunch Program, and Affordable Care Act premium subsidies (once temporarily relaxed eligibility rules are restored in 2026). Effects on eligibility thresholds would grow over time because the SPM thresholds grow faster over time than the current official thresholds. As a result of the higher eligibility thresholds, I estimate that in 2024 SNAP would cover 2.0 million additional households with spending rising by $2.6 billion, and that Medicaid would cover 1.3 million additional recipients with spending rising by $5.6 billion.
Acknowledgments
I thank Richard Burkhauser, Leslie Ford, Angela Rachidi, Matt Weidinger, and Scott Winship for helpful comments.
Average official poverty thresholds and poverty guidelines by family size, by year: Scenario in which Official Poverty Measure remains official measure.
| Family/household size | ||||||||
|---|---|---|---|---|---|---|---|---|
| Year | 1 | 2 | 3 | 4 | 5 | 6 | 7 | 8 |
| Average official poverty thresholds | ||||||||
| 2021 | $13,788 | $17,529 | $21,559 | $27,740 | $32,865 | $37,161 | $42,156 | $47,093 |
| 2022 | $14,891 | $18,932 | $23,284 | $29,960 | $35,495 | $40,135 | $45,530 | $50,862 |
| 2023 | $15,605 | $19,839 | $24,400 | $31,395 | $37,195 | $42,057 | $47,711 | $53,298 |
| 2024 | $16,075 | $20,437 | $25,135 | $32,341 | $38,316 | $43,325 | $49,148 | $54,904 |
| 2025 | $16,425 | $20,882 | $25,682 | $33,045 | $39,151 | $44,268 | $50,219 | $56,100 |
| 2026 | $16,762 | $21,310 | $26,210 | $33,724 | $39,954 | $45,177 | $51,250 | $57,252 |
| 2027 | $17,108 | $21,750 | $26,750 | $34,419 | $40,778 | $46,109 | $52,306 | $58,432 |
| 2028 | $17,482 | $22,225 | $27,335 | $35,171 | $41,669 | $47,116 | $53,449 | $59,709 |
| 2029 | $17,876 | $22,726 | $27,951 | $35,964 | $42,609 | $48,179 | $54,655 | $61,055 |
| 2030 | $18,282 | $23,242 | $28,585 | $36,781 | $43,576 | $49,272 | $55,895 | $62,441 |
| 2031 | $18,697 | $23,770 | $29,235 | $37,617 | $44,567 | $50,392 | $57,166 | $63,861 |
| 2032 | $19,123 | $24,312 | $29,901 | $38,474 | $45,582 | $51,540 | $58,468 | $65,315 |
| 2033 | $19,560 | $24,867 | $30,584 | $39,352 | $46,623 | $52,717 | $59,803 | $66,807 |
| Poverty guidelines | ||||||||
| 2023 | $14,580 | $19,720 | $24,860 | $30,000 | $35,140 | $40,280 | $45,420 | $50,560 |
| 2024 | $15,200 | $20,600 | $26,000 | $31,400 | $36,800 | $42,200 | $47,600 | $53,000 |
| 2025 | $15,670 | $21,230 | $26,790 | $32,350 | $37,910 | $43,470 | $49,030 | $54,590 |
| 2026 | $16,010 | $21,690 | $27,370 | $33,050 | $38,730 | $44,410 | $50,090 | $55,770 |
| 2027 | $16,350 | $22,150 | $27,950 | $33,750 | $39,550 | $45,350 | $51,150 | $56,950 |
| 2028 | $16,690 | $22,610 | $28,530 | $34,450 | $40,370 | $46,290 | $52,210 | $58,130 |
| 2029 | $17,080 | $23,120 | $29,160 | $35,200 | $41,240 | $47,280 | $53,320 | $59,360 |
| 2030 | $17,460 | $23,640 | $29,820 | $36,000 | $42,180 | $48,360 | $54,540 | $60,720 |
| 2031 | $17,840 | $24,160 | $30,480 | $36,800 | $43,120 | $49,440 | $55,760 | $62,080 |
| 2032 | $18,270 | $24,730 | $31,190 | $37,650 | $44,110 | $50,570 | $57,030 | $63,490 |
| 2033 | $18,700 | $25,300 | $31,900 | $38,500 | $45,100 | $51,700 | $58,300 | $64,900 |
-
Sources: Creamer et al. (2022); Becerra (2023); U.S. Department of Health and Human Services (2023); Congressional Budget Office (2023); author’s calculations. Average official poverty thresholds for 2021 are taken from page 20 of Creamer et al. (2022). Average official poverty thresholds in 2022 through 2033 are calculated by multiplying the average threshold in the previous year by the ratio of the annual CPI-U in the current year to the annual CPI-U in the previous year. Poverty guidelines are calculated in accordance with the process laid out in Becerra (2023) and U.S. Department of Health and Human Services (2023). For a given year T, the poverty guideline for a family of four is equal to the average official poverty threshold for year T − 2, times the ratio of the CPI-U in year T − 1 to the CPI-U in year T − 2, rounded up to the nearest $50. The poverty guidelines for all other family sizes in year T are calculated by applying the mean increment between family sizes from average poverty thresholds reported for year T − 1, rounded up to the nearest $20. Projected values of the CPI-U are from Congressional Budget Office (2023). Separate poverty guidelines for Alaska and Hawaii are not shown.
Average official poverty thresholds and poverty guidelines by family size, by year: Scenario in which Supplemental Poverty Measure becomes official measure.
| Family/household size | ||||||||
|---|---|---|---|---|---|---|---|---|
| Year | 1 | 2 | 3 | 4 | 5 | 6 | 7 | 8 |
| Average official poverty thresholds | ||||||||
| 2021 | $14,282 | $19,617 | $28,589 | $33,149 | $37,318 | $41,398 | $45,966 | $51,528 |
| 2022 | $15,526 | $21,326 | $31,079 | $36,037 | $40,569 | $45,004 | $49,970 | $56,017 |
| 2023 | $16,409 | $22,540 | $32,848 | $38,088 | $42,878 | $47,566 | $52,814 | $59,205 |
| 2024 | $17,077 | $23,457 | $34,185 | $39,638 | $44,623 | $49,501 | $54,964 | $61,615 |
| 2025 | $17,581 | $24,150 | $35,194 | $40,808 | $45,940 | $50,963 | $56,586 | $63,434 |
| 2026 | $18,488 | $25,396 | $37,010 | $42,913 | $48,310 | $53,592 | $59,505 | $66,706 |
| 2027 | $19,067 | $26,190 | $38,167 | $44,255 | $49,821 | $55,268 | $61,367 | $68,792 |
| 2028 | $19,670 | $27,019 | $39,376 | $45,657 | $51,398 | $57,018 | $63,310 | $70,970 |
| 2029 | $20,316 | $27,906 | $40,668 | $47,155 | $53,085 | $58,889 | $65,387 | $73,299 |
| 2030 | $21,012 | $28,862 | $42,061 | $48,771 | $54,904 | $60,907 | $67,628 | $75,811 |
| 2031 | $21,738 | $29,859 | $43,515 | $50,456 | $56,801 | $63,011 | $69,965 | $78,431 |
| 2032 | $22,491 | $30,894 | $45,023 | $52,204 | $58,769 | $65,195 | $72,389 | $81,148 |
| 2033 | $23,270 | $31,963 | $46,581 | $54,011 | $60,804 | $67,451 | $74,895 | $83,957 |
| Poverty guidelines | ||||||||
| 2023 | $18,570 | $24,330 | $30,090 | $35,850 | $41,610 | $47,370 | $53,130 | $58,890 |
| 2024 | $19,560 | $25,640 | $31,720 | $37,800 | $43,880 | $49,960 | $56,040 | $62,120 |
| 2025 | $20,350 | $26,650 | $32,950 | $39,250 | $45,550 | $51,850 | $58,150 | $64,450 |
| 2026 | $20,990 | $27,510 | $34,030 | $40,550 | $47,070 | $53,590 | $60,110 | $66,630 |
| 2027 | $21,550 | $28,250 | $34,950 | $41,650 | $48,350 | $55,050 | $61,750 | $68,450 |
| 2028 | $22,680 | $29,720 | $36,760 | $43,800 | $50,840 | $57,880 | $64,920 | $71,960 |
| 2029 | $23,470 | $30,730 | $37,990 | $45,250 | $52,510 | $59,770 | $67,030 | $74,290 |
| 2030 | $24,200 | $31,700 | $39,200 | $46,700 | $54,200 | $61,700 | $69,200 | $76,700 |
| 2031 | $24,970 | $32,730 | $40,490 | $48,250 | $56,010 | $63,770 | $71,530 | $79,290 |
| 2032 | $25,840 | $33,860 | $41,880 | $49,900 | $57,920 | $65,940 | $73,960 | $81,980 |
| 2033 | $26,750 | $35,050 | $43,350 | $51,650 | $59,950 | $68,250 | $76,550 | $84,850 |
-
Sources: Census Bureau, Current Population Survey Annual Social and Economic Supplement, 2022; Becerra (2023); U.S. Department of Health and Human Services (2023); Congressional Budget Office (2023); U.S. Bureau of Labor Statistics (2022); author’s calculations. Average official poverty thresholds for 2021 are calculated as the mean SPM threshold by family size calculated in the 2022 Current Population Survey Annual Social and Economic Supplement (corresponding to calendar year 2021). Average official poverty thresholds in 2022 through 2033 are calculated by multiplying the average threshold in the previous year by the percent change in the 5-year average of per capita Personal Consumption Expenditures (PCE). The 5-year average is based on the 5 years prior to the year in question, and values in the 5-year average are updated to current year dollars based on growth in the FCSUti CPI-U. The projected growth in the FCSUti CPI-U is equal to the growth in the CPI-U plus 0.1 percentage point. Poverty guidelines are calculated in accordance with the process laid out in Becerra (2023) and U.S. Department of Health and Human Services (2023). Projected values of the CPI-U are from Congressional Budget Office (2023). Separate poverty guidelines for Alaska and Hawaii are not shown.
Government spending on entitlement programs with eligibility thresholds that depend on poverty guidelines, 2019 and 2021.
| Government spending (billions $) | ||
|---|---|---|
| Program | 2019 | 2021 |
| Medicaid | $615 | $734 |
| SNAP | $60 | $114 |
| ACA premium subsidies | $40 | $67 |
| Medicare Part D subsidies | $27 | $34 |
| School lunch program | $14 | $9 |
| Total | $756 | $958 |
-
Source: Centers for Medicare and Medicaid Services; U.S. Department of Agriculture; Internal Revenue Service; Congressional Budget Office; U.S. Department of the Treasury. Government spending on ACA premium subsidies in 2021 is based on Treasury estimates of tax expenditures, which includes both monthly outlays and refundable credits paid at tax filing.
State-specific Supplemental Poverty Measure-based poverty guidelines, family of four, 2024–2033.
| 2024 | 2025 | 2026 | 2027 | 2028 | 2029 | 2030 | 2031 | 2032 | 2033 | |
|---|---|---|---|---|---|---|---|---|---|---|
| Alabama | $32,350 | $33,600 | $34,700 | $35,650 | $37,500 | $38,700 | $39,950 | $41,300 | $42,700 | $44,200 |
| Arizona | $36,750 | $38,150 | $39,400 | $40,500 | $42,600 | $44,000 | $45,400 | $46,900 | $48,500 | $50,200 |
| Arkansas | $31,200 | $32,400 | $33,450 | $34,400 | $36,150 | $37,350 | $38,550 | $39,800 | $41,200 | $42,600 |
| California | $46,150 | $47,950 | $49,500 | $50,900 | $53,500 | $55,250 | $57,050 | $58,900 | $60,950 | $63,050 |
| Colorado | $39,450 | $41,000 | $42,300 | $43,500 | $45,750 | $47,250 | $48,750 | $50,400 | $52,100 | $53,900 |
| Connecticut | $40,950 | $42,500 | $43,900 | $45,150 | $47,450 | $49,000 | $50,600 | $52,250 | $54,050 | $55,900 |
| Delaware | $36,750 | $38,150 | $39,400 | $40,500 | $42,600 | $44,000 | $45,400 | $46,900 | $48,500 | $50,200 |
| Dist. Columbia | $45,650 | $47,400 | $48,950 | $50,300 | $52,900 | $54,650 | $56,400 | $58,250 | $60,250 | $62,350 |
| Florida | $38,400 | $39,900 | $41,150 | $42,350 | $44,500 | $45,950 | $47,450 | $49,000 | $50,700 | $52,450 |
| Georgia | $35,300 | $36,700 | $37,900 | $38,950 | $40,950 | $42,300 | $43,650 | $45,100 | $46,650 | $48,250 |
| Idaho | $33,100 | $34,400 | $35,500 | $36,500 | $38,400 | $39,650 | $40,950 | $42,250 | $43,700 | $45,250 |
| Illinois | $36,650 | $38,050 | $39,300 | $40,400 | $42,500 | $43,850 | $45,300 | $46,800 | $48,400 | $50,050 |
| Indiana | $33,700 | $35,000 | $36,100 | $37,150 | $39,050 | $40,350 | $41,650 | $43,000 | $44,500 | $46,000 |
| Iowa | $32,350 | $33,600 | $34,700 | $35,650 | $37,500 | $38,750 | $40,000 | $41,300 | $42,700 | $44,200 |
| Kansas | $32,600 | $33,850 | $34,950 | $35,950 | $37,800 | $39,000 | $40,300 | $41,600 | $43,050 | $44,500 |
| Kentucky | $32,000 | $33,250 | $34,350 | $35,300 | $37,150 | $38,350 | $39,550 | $40,900 | $42,300 | $43,750 |
| Louisiana | $32,950 | $34,250 | $35,350 | $36,350 | $38,200 | $39,450 | $40,700 | $42,050 | $43,500 | $45,000 |
| Maine | $35,450 | $36,850 | $38,050 | $39,100 | $41,150 | $42,450 | $43,850 | $45,300 | $46,850 | $48,450 |
| Maryland | $42,800 | $44,450 | $45,900 | $47,200 | $49,650 | $51,250 | $52,900 | $54,650 | $56,500 | $58,450 |
| Massachusetts | $42,700 | $44,400 | $45,800 | $47,100 | $49,550 | $51,150 | $52,800 | $54,550 | $56,400 | $58,350 |
| Michigan | $34,400 | $35,750 | $36,900 | $37,950 | $39,900 | $41,200 | $42,550 | $43,950 | $45,450 | $47,000 |
| Minnesota | $36,300 | $37,700 | $38,900 | $40,000 | $42,050 | $43,450 | $44,850 | $46,300 | $47,900 | $49,550 |
| Mississippi | $31,000 | $32,200 | $33,250 | $34,200 | $35,950 | $37,100 | $38,300 | $39,550 | $40,950 | $42,350 |
| Missouri | $33,150 | $34,450 | $35,600 | $36,600 | $38,450 | $39,700 | $41,000 | $42,350 | $43,800 | $45,300 |
| Montana | $32,650 | $33,950 | $35,000 | $36,000 | $37,850 | $39,100 | $40,350 | $41,700 | $43,150 | $44,600 |
| Nebraska | $33,050 | $34,350 | $35,450 | $36,450 | $38,350 | $39,600 | $40,850 | $42,200 | $43,650 | $45,150 |
| Nevada | $37,100 | $38,550 | $39,800 | $40,900 | $43,050 | $44,450 | $45,850 | $47,400 | $49,000 | $50,700 |
| New Hampshire | $40,750 | $42,350 | $43,700 | $44,950 | $47,250 | $48,800 | $50,400 | $52,050 | $53,850 | $55,700 |
| New Jersey | $43,000 | $44,650 | $46,100 | $47,400 | $49,850 | $51,450 | $53,150 | $54,900 | $56,750 | $58,750 |
| New Mexico | $32,650 | $33,950 | $35,000 | $36,000 | $37,850 | $39,100 | $40,350 | $41,700 | $43,100 | $44,600 |
| New York | $41,600 | $43,250 | $44,600 | $45,900 | $48,250 | $49,800 | $51,450 | $53,150 | $54,950 | $56,850 |
| North Carolina | $33,850 | $35,200 | $36,350 | $37,350 | $39,300 | $40,550 | $41,850 | $43,250 | $44,750 | $46,300 |
| North Dakota | $32,300 | $33,550 | $34,650 | $35,600 | $37,450 | $38,650 | $39,900 | $41,250 | $42,650 | $44,100 |
| Ohio | $33,350 | $34,650 | $35,750 | $36,750 | $38,650 | $39,950 | $41,200 | $42,600 | $44,050 | $45,550 |
| Oklahoma | $31,200 | $32,400 | $33,450 | $34,400 | $36,200 | $37,350 | $38,550 | $39,850 | $41,200 | $42,600 |
| Oregon | $37,700 | $39,150 | $40,400 | $41,550 | $43,700 | $45,150 | $46,600 | $48,100 | $49,750 | $51,500 |
| Pennsylvania | $35,650 | $37,050 | $38,250 | $39,350 | $41,350 | $42,700 | $44,100 | $45,550 | $47,100 | $48,750 |
| Rhode Island | $36,000 | $37,400 | $38,600 | $39,700 | $41,750 | $43,100 | $44,500 | $45,950 | $47,550 | $49,200 |
| South Carolina | $33,050 | $34,350 | $35,450 | $36,450 | $38,350 | $39,600 | $40,900 | $42,250 | $43,650 | $45,200 |
| South Dakota | $31,100 | $32,350 | $33,350 | $34,300 | $36,100 | $37,250 | $38,450 | $39,750 | $41,100 | $42,500 |
| Tennessee | $33,800 | $35,100 | $36,250 | $37,250 | $39,200 | $40,450 | $41,800 | $43,150 | $44,650 | $46,200 |
| Texas | $36,000 | $37,400 | $38,650 | $39,700 | $41,750 | $43,150 | $44,500 | $46,000 | $47,550 | $49,200 |
| Utah | $35,000 | $36,350 | $37,500 | $38,600 | $40,550 | $41,900 | $43,250 | $44,650 | $46,200 | $47,800 |
| Vermont | $37,050 | $38,500 | $39,750 | $40,850 | $43,000 | $44,350 | $45,800 | $47,300 | $48,950 | $50,650 |
| Virginia | $41,100 | $42,700 | $44,100 | $45,300 | $47,650 | $49,200 | $50,800 | $52,500 | $54,300 | $56,150 |
| Washington | $40,450 | $42,050 | $43,400 | $44,600 | $46,950 | $48,450 | $50,000 | $51,650 | $53,450 | $55,300 |
| West Virginia | $30,950 | $32,150 | $33,200 | $34,100 | $35,900 | $37,050 | $38,250 | $39,500 | $40,850 | $42,250 |
| Wisconsin | $33,550 | $34,850 | $36,000 | $37,000 | $38,900 | $40,200 | $41,500 | $42,850 | $44,300 | $45,850 |
| Wyoming | $31,600 | $32,850 | $33,900 | $34,850 | $36,650 | $37,850 | $39,100 | $40,400 | $41,750 | $43,200 |
-
Sources: Census Bureau, Current Population Survey Annual Social and Economic Supplement, 2022; Becerra (2023); U.S. Department of Health and Human Services (2023); Congressional Budget Office (2023); U.S. Bureau of Labor Statistics (2022); author’s calculations. Poverty guidelines shown here are based on the scenario in which the Census Bureau reports state-specific average poverty thresholds under the Supplemental Poverty Measure. Poverty guidelines are calculated in accordance with the process laid out in Becerra (2023) and U.S. Department of Health and Human Services (2023), after calculating state-specific SPM thresholds based on average thresholds calculated from the Current Population Survey Annual and Social Economic Supplement and increasing state-specific thresholds based on the percentage increase in forecasted United States average thresholds. Projected values of the CPI-U are from Congressional Budget Office (2023). Separate poverty guidelines for Alaska and Hawaii are not shown.
Average Official Poverty Measure thresholds, survey-based calculation versus Census reported, 2021.
| Family size | Survey-based | Census reported | Difference |
|---|---|---|---|
| 1 | $13,788 | $13,788 | $0 |
| 2 | $17,536 | $17,529 | $7 |
| 3 | $21,561 | $21,559 | $2 |
| 4 | $27,739 | $27,740 | −$1 |
| 5 | $32,864 | $32,865 | −$1 |
| 6 | $37,161 | $37,161 | $0 |
| 7 | $42,153 | $42,156 | −$3 |
| 8 | $47,093 | $47,093 | $0 |
-
Source: Creamer et al. (2022); Current Population Survey Annual Social and Economic Supplement, 2022; author’s calculations. Thresholds are family weighted averages of Census reported thresholds calculated over all families in the 2022 Current Population Survey Annual Social and Economic Supplement (CPS ASEC), corresponding to income year 2021. Following Census, the primary family and related subfamilies are combined into a single family unit for purposes of calculating average thresholds. Survey-based average thresholds are calculated by the author using the public use CPS ASEC. Census reported thresholds are those reported on page 20 of Creamer et al. (2022).
Maximum, mean, and share receiving Supplemental Nutrition Assistance Program benefits, and mean income, by household size, select years.
| Maximum monthly | Mean monthly | Households between 100 % and 130 % | |||||
|---|---|---|---|---|---|---|---|
| SNAP benefit | SNAP benefit | and 130 % of poverty guidelines, 2019 | |||||
| Household | 2019 | 2023 | 2024 | 2033 | 2019 | Share receiving | Mean annual |
| size | SNAP | income | |||||
| 1 | $192 | $281 | $289 | $426 | $64 | 0.45 | $14,397 |
| 2 | $353 | $516 | $532 | $783 | $113 | 0.37 | $19,404 |
| 3 | $505 | $740 | $762 | $1126 | $174 | 0.45 | $24,595 |
| 4 | $642 | $939 | $967 | $1427 | $211 | 0.41 | $29,562 |
| 5 | $762 | $1116 | $1150 | $1697 | $224 | 0.45 | $34,821 |
| 6 | $914 | $1339 | $1379 | $2035 | $252 | 0.26 | $39,520 |
| 7 | $1011 | $1480 | $1525 | $2250 | $264 | 0.39 | $44,905 |
| 8 | $1155 | $1691 | $1742 | $2571 | $304 | 0.37 | $48,825 |
| 9 | $1299 | $1902 | $1959 | $2892 | $555 | 0.05 | $54,709 |
| 10 | $1443 | $2113 | $2177 | $3213 | $544 | 0.29 | $55,300 |
-
Sources: Census Bureau, Current Population Survey Annual Social and Economic Supplement, 2020; U.S. Department of Agriculture SNAP Quality Control Data, 2019; U.S. Department of Agriculture; Becerra (2023); U.S. Department of Health and Human Services (2023); Congressional Budget Office (2023); author’s calculations. Dollar values are in nominal terms. Maximum monthly SNAP benefits for 2019 and 2023 are the benefit levels published by the U.S. Department of Agriculture, and maximum benefits for 2024 and 2033 are imputed by the author. The mean SNAP benefit for 2019 and share of households between 100 % and 130 % of poverty guidelines is based on SNAP Quality Control data, using the gross income measure it reports. Mean annual income of households between 100 % and 130 % of poverty guidelines is based on the 2020 CPS ASEC, which is used to ensure consistency with the incomes of newly eligible households when calculating benefit phase outs. Households in Alaska and Hawaii are excluded.
Medicaid eligibility thresholds as share of poverty guidelines, by state and individual type.
| State | Age 0 | Age 1–5 | Age 6–18 | Adult parent | Adult non-parent |
|---|---|---|---|---|---|
| Alabama | 141 % | 141 % | 141 % | 13 % | |
| Alaska | 203 % | 203 % | 203 % | 133 % | 133 % |
| Arizona | 147 % | 141 % | 133 % | 133 % | 133 % |
| Arkansas | 142 % | 142 % | 142 % | 133 % | 133 % |
| California | 261 % | 261 % | 261 % | 133 % | 133 % |
| Colorado | 142 % | 142 % | 142 % | 133 % | 133 % |
| Connecticut | 196 % | 196 % | 196 % | 155 % | 133 % |
| Delaware | 212 % | 142 % | 133 % | 133 % | 133 % |
| Dist. of Columbia | 319 % | 319 % | 319 % | 216 % | 210 % |
| Florida | 206 % | 140 % | 133 % | ||
| Georgia | 205 % | 149 % | 133 % | ||
| Hawaii | 308 % | 308 % | 308 % | 133 % | 133 % |
| Idaho | 142 % | 142 % | 133 % | 133 % | 133 % |
| Illinois | 313 % | 313 % | 313 % | 133 % | 133 % |
| Indiana | 208 % | 158 % | 158 % | 133 % | 133 % |
| Iowa | 375 % | 167 % | 167 % | 133 % | 133 % |
| Kansas | 166 % | 149 % | 133 % | 33 % | |
| Kentucky | 195 % | 159 % | 159 % | 133 % | 133 % |
| Louisiana | 212 % | 212 % | 212 % | 133 % | 133 % |
| Maine | 191 % | 157 % | 157 % | 133 % | 133 % |
| Maryland | 317 % | 317 % | 317 % | 133 % | 133 % |
| Massachusetts | 200 % | 150 % | 150 % | 133 % | 133 % |
| Michigan | 212 % | 212 % | 212 % | 133 % | 133 % |
| Minnesota | 283 % | 275 % | 275 % | 200 % | 200 % |
| Mississippi | 194 % | 143 % | 133 % | ||
| Missouri | 196 % | 150 % | 150 % | 133 % | 133 % |
| Montana | 143 % | 143 % | 143 % | 133 % | 133 % |
| Nebraska | 213 % | 213 % | 213 % | 133 % | 133 % |
| Nevada | 160 % | 160 % | 133 % | 133 % | 133 % |
| New Hampshire | 318 % | 318 % | 318 % | 133 % | 133 % |
| New Jersey | 194 % | 142 % | 142 % | 133 % | 133 % |
| New Mexico | 300 % | 300 % | 240 % | 133 % | 133 % |
| New York | 218 % | 149 % | 149 % | 200 % | 200 % |
| North Carolina | 210 % | 210 % | 133 % | ||
| North Dakota | 170 % | 170 % | 170 % | 133 % | 133 % |
| Ohio | 206 % | 206 % | 206 % | 133 % | 133 % |
| Oklahoma | 205 % | 205 % | 205 % | 133 % | 133 % |
| Oregon | 185 % | 133 % | 133 % | 133 % | 133 % |
| Pennsylvania | 215 % | 157 % | 133 % | 133 % | 133 % |
| Rhode Island | 261 % | 261 % | 261 % | 133 % | 133 % |
| South Carolina | 208 % | 208 % | 208 % | 95 % | |
| South Dakota | 182 % | 182 % | 182 % | ||
| Tennessee | 195 % | 142 % | 133 % | ||
| Texas | 198 % | 144 % | 133 % | ||
| Utah | 139 % | 139 % | 133 % | 133 % | 133 % |
| Vermont | 312 % | 312 % | 312 % | 133 % | 133 % |
| Virginia | 143 % | 143 % | 143 % | 133 % | 133 % |
| Washington | 210 % | 210 % | 210 % | 133 % | 133 % |
| West Virginia | 158 % | 141 % | 133 % | 133 % | 133 % |
| Wisconsin | 301 % | 186 % | 151 % | 95 % | |
| Wyoming | 200 % | 200 % | 200 % |
-
Source: Centers for Medicare and Medicaid Services. Special eligibility thresholds for pregnant women are excluded because pregnancy status cannot be determined in the Current Population Survey Annual Social and Economic Supplement. Eligibility thresholds that are not directly tied to the poverty guidelines are excluded. Children’s Health Insurance Program benefits are excluded because they are not an entitlement. Adult parents are assumed to be able to obtain coverage under Medicaid expansion if not covered in their own right.
Appendix A: Translating Poverty Thresholds into Poverty Guidelines
The poverty guidelines are calculated annually by the HHS Secretary, who according to statute must take the official poverty thresholds published by the Census Bureau, update them forward one year by the percent increase in the CPI-U, and adjust them for families of different sizes.[6] In order to establish the poverty guidelines for 2023, this statutory guidance has been interpreted by the HHS Secretary to entail the following set of steps:[7]
Identify the average threshold for each family size reported by the Census Bureau in their latest annual report on poverty. The most recent thresholds correspond to calendar year 2021.
Multiply the average threshold for each family size by the ratio of the annual CPI-U in 2022 to the annual CPI-U in 2021.
Determine the mean increment when moving from family size n to family size n + 1, for n = {1, 2, …, 7}. Round up the mean increment to the nearest $20.
Calculate the poverty guideline for a family of four as the inflation adjusted poverty threshold for a family of four, rounded up to the nearest $50.
Apply the rounded, mean increment calculated in step 3 to calculate the poverty guideline for all other family sizes, relative to the guideline established for a family of four.
In order to translate poverty thresholds into poverty guidelines for future years using this set of steps, I rely on projections of the CPI-U published in the February 2023 forecasts of the Congressional Budget Office (CBO), which include forecasts for each year through 2033 (Congressional Budget Office 2023).
Appendix B: Methodology for Projecting Future SPM Thresholds
To project future increases in the SPM thresholds, I begin by calculating the average SPM threshold by family size in 2021 from the public use version of the 2022 CPS ASEC, which includes income and poverty information for calendar year 2021. Note that I must calculate the average SPM thresholds because they are not currently reported in the Census poverty report. As shown in Appendix Table B1, I can almost exactly replicate the average OPM thresholds reported by Creamer et al. (2022), validating the use of the public use CPS ASEC to calculate average SPM thresholds as well.[8]
The next step is to forecast how these average SPM thresholds in 2021 will change over time. Because I am not aware of projections over the next decade of spending on food, clothing, shelter, utilities, telephone and internet services, I instead rely on CBO forecasts of Personal Consumption Expenditures (PCE) more generally to update the SPM thresholds.
I begin by calculating per capita PCE in each year, using projections of PCE and the U.S. population aged 16 and over from Congressional Budget Office (2023). I then form 5-year averages of per capita PCE, to match the 5-year averages used by the Bureau of Labor Statistics (BLS) to calculate SPM thresholds. The 5-year average for year T is equal to the arithmetic mean of per capita PCE over the set of years, {T − 5, T − 4, T − 3, T − 2, T − 1, }, with per capita PCE in each of the five years put in terms of year T prices.[9]
BLS uses a specially created price index called the FCSUti CPI-U to adjust spending in all five years of the 5-year average to the current year.[10] I follow the same approach when calculating the 5-year average of per capita PCE. Because the FCSUti CPI-U is available only until 2021, and because there are no forecasts of which I am aware, I calculate the mean percentage point difference in the annual growth of the FCSUti CPI-U and CPI-U over the period 2002–2021, the entire period for which both measures are available (U.S. Bureau of Labor Statistics 2022).
The mean percentage point difference is 0.1 percentage point. I then form a projected FCSUti CPI-U whose annual growth is equal to the forecasted growth in the CPI-U plus an additional 0.1 percentage point each year. Finally, I increase the 2021 average SPM thresholds by the annual percent increase in the 5-year average of per capita PCE as defined above.
Because there could be important differences in annual changes in per capita PCE versus spending on food, clothing, shelter, utilities, telephone and internet services, I test whether these approaches lead to a similar evolution of SPM thresholds for the years 2007–2021, when sufficient data are available to calculate changes in both sets of thresholds. Appendix Figure B1 shows the SPM thresholds and SPM thresholds updated based on changes in per capita PCE (as adjusted using 5-year averages and the FCSUti CPI-U price index as described above), each indexed to 2007.
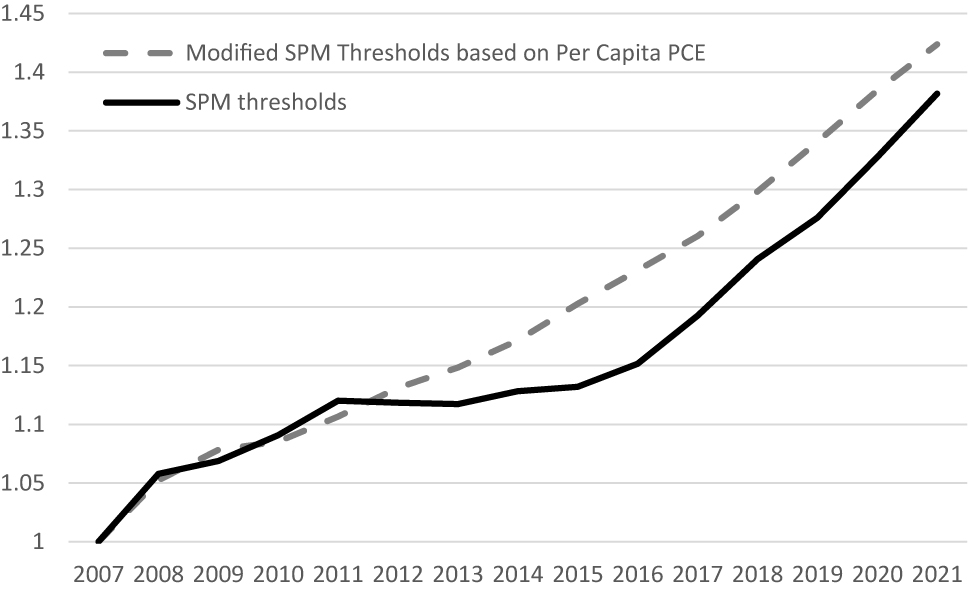
SPM Thresholds and Modified SPM Thresholds Based on Growth in Per Capita Personal Consumption Expenditures, Indexed to 2007, 2007–2021. Sources: U.S. Bureau of Labor Statistics (2022); Congressional Budget Office (2023); author’s calculations. SPM thresholds are obtained from U.S. Bureau of Labor Statistics (2022). For each year, I calculate the weighted average threshold over the three housing tenure types, using as weights the reported percentage of the weighted sample. The modified SPM thresholds are calculated by taking the same 2007 SPM threshold and increasing it each year based on changes in the 5-year average of per capita Personal Consumption Expenditures (PCE), using the FCSUti CPI-U as reported by U.S. Bureau of Labor Statistics (2022) to put dollar values in the 5-year average into dollars corresponding to the year in question.
The modified SPM thresholds based on per capita PCE grow slightly faster overall, as they are 42 percent higher in 2021 compared to 2007, while the SPM thresholds are 38 percent higher. The rates of change are similar except for 2012–2015 when the SPM series is flatter. The lower growth rate of the SPM series during the 2012–2015 period may be a result of lower spending growth in the middle part of the spending distribution relative to mean spending, which would be expected if spending inequality grew over this period. Consistent with this explanation Mayer and Sullivan (2023), find that the ratio of the 90th to the 50th percentile of total consumption fell from 2005 to 2011, and then grew from 2011 to 2016 before falling slightly in 2017. Unfortunately, I am unaware of forecasts of median expenditures, and thus, I rely on projections of overall mean expenditures for future forecasts of the SPM thresholds. Despite this limitation, the growth in the modified SPM thresholds that I use to project SPM threshold growth in future years appear to be a reasonable approximation to growth in the SPM thresholds themselves, at least historically.
Appendix C: Methodology for Estimating Effects on Program Recipients and Spending
This appendix describes the methodology for estimating the effects of making the SPM the official poverty measure on SNAP and Medicaid recipients and spending.
C.1 Supplemental Nutrition Assistance Program
To estimate the SNAP recipient and spending effects of basing the poverty guidelines on the SPM, I use a population of SNAP recipients in 2019 who were “barely” eligible for benefits to extrapolate the benefits received by newly eligible SNAP recipients in future years. To begin, I use the U.S. Department of Agriculture’s (USDA) 2019 SNAP Quality Control microdata, which provides a representative sample of SNAP recipients, including their income and benefit levels.
For each household size, I estimate the number of SNAP recipient households with gross income between 100 percent and 130 percent of the OPM-based poverty guidelines, along with their mean monthly SNAP benefit. I then use the 2020 CPS ASEC to estimate the total number of households in 2019 whose pre-tax, post transfer income (excluding in-kind transfers and the value of health insurance) falls between 100 percent and 130 percent of the 2019 OPM-based poverty guideline.[11] This allows me to calculate the share of households in this “barely” eligible group in 2019 that received SNAP. Appendix Table C1 reports, for 2019, the mean monthly SNAP benefit, the share of “barely” eligible households that received SNAP, and their mean annual income (three right-most columns).
The next step is to estimate how SNAP spending would increase in 2024–2033 by adopting SPM-based poverty guidelines. To do so, I again rely on the 2020 CPS ASEC which has income information for 2019. I do not use the more recent 2022 CPS ASEC (corresponding to income in 2021) because 2021 was atypical in terms of government assistance provided to households. I update each household’s income to future years based on projected growth in per capita wages and salaries, and I increase each household’s weight to reflect projected population growth, based on Congressional Budget Office (2023) projections. I identify newly eligible households as those whose pre-tax, post-transfer income is between 130 percent of the OPM-based poverty guideline and 130 percent of the SPM-based poverty guideline.
For each of these newly eligible households, I first impute their SNAP benefit (conditional on receiving any benefit) as the mean monthly amount in 2019 according to their household size (as reported in Appendix Table C1), updated to the relevant year. I update the SNAP benefit to the relevant year by increasing the 2019 mean amount by the dollar increase in the maximum benefit level for their household size.[12] The mean benefit amount increases dollar for dollar with the increase in the maximum benefit because of the structure of the benefit formula for SNAP—the awarded amount is equal to a maximum dollar amount that is reduced as income rises.
I next adjust for the phase out of SNAP benefits, which phase out at a rate of 24 cents per dollar of earnings.[13] To do so, I reduce the annualized SNAP benefit by 0.24 times the difference between the household’s income in a given year and the mean 2019 income of barely eligible households reported in Appendix Table C1. This can reduce the SNAP benefits to some households to zero. Finally, I account for incomplete take-up by multiplying the total SNAP benefit received among all newly eligible households by the share of barely eligible households who received SNAP in 2019, as reported in Appendix Table C1. Note that the share receiving SNAP among newly eligible households will ultimately be lower than the share receiving SNAP among the barely eligible, because the phase out of benefits leads some households to receive zero benefits.
C.2 Medicaid
To estimate the Medicaid recipient and spending effects of basing the poverty guidelines on the SPM, I identify individuals who are both (i) not currently covered by health insurance, and (ii) would become newly eligible for Medicaid if the poverty guidelines were based on the SPM. I rely on the 2020 CPS ASEC, corresponding to income and health insurance status as of 2019, prior to temporary COVID-era provisions that extended health insurance coverage and affected incomes of households. I again update household incomes and population weights based on projected per capita wage and salary growth and population growth respectively by Congressional Budget Office (2023). I use Medicaid eligibility rules as of July 1, 2022 to determine the ratio of the poverty guidelines states use to determine Medicaid eligibility for children of different ages, parents and other adults in all years from 2024 to 2033 (see Appendix Table C2). I also use average per-person Medicaid spending according to the risk class and state of each individual as calculated by Burkhauser et al. (Forthcoming), updated to future years for inflation.
I then assume Medicaid coverage expansions due to SPM-based poverty guidelines do not lead to increased coverage among the disabled or elderly, and thus apply Medicaid spending averages only for children and non-disabled, non-elderly adults. I also assume that expanded Medicaid eligibility does not crowd out other forms of coverage, by restricting new Medicaid enrollees to individuals without any existing health insurance coverage.[14]
References
Becerra, Xavier. 2023. Annual Update of the HHS Poverty Guidelines. Federal Register. Also available at: https://www.federalregister.gov/documents/2023/01/19/2023-00885/annual-update-of-the-hhs-poverty-guidelines.Search in Google Scholar
Burkhauser, Richard V., Kevin Corinth, James Elwell, and Jeff Larrimore. Forthcoming. “Evaluating the Success of the War on Poverty Since 1963 Using an Absolute Full-Income Poverty Measure.” Journal of Political Economy. https://www.journals.uchicago.edu/doi/10.1086/725705.Search in Google Scholar
Burkhauser, Richard V., Kevin C. Corinth, Bruce D. Meyer, Angela Rachidi, Matt Weidinger, and Scott Winship. 2021. Addressing the Shortcomings of the Supplemental Poverty Measure. American Enterprise Institute. Also available at: https://www.aei.org/wp-content/uploads/2021/07/Addressing-the-Shortcomings-of-the-Supplemental-Poverty-Measure.pdf?x91208.Search in Google Scholar
Congressional Budget Office. 2023. The Budget and Economic Outlook: 2023 to 2033. Also available at: https://www.cbo.gov/system/files/2023-02/58848-Outlook.pdf.Search in Google Scholar
Creamer, John, Emily A. Shrider, Kalee Burns, and Frances Chen. 2022. Poverty in the United States: 2021. Current Population Reports. United States Census Bureau. Also available at: https://www.census.gov/content/dam/Census/library/publications/2022/demo/p60-277.pdf.Search in Google Scholar
Diamond, Rebecca, and Enrico Moretti. 2021. Where Is Standard of Living the Highest? Local Prices and the Geography of Consumption. w29533. Cambridge: National Bureau of Economic Research.10.3386/w29533Search in Google Scholar
Fisher, Gordon M. 1992. “The Development and History of the Poverty Thresholds.” Social Security Bulletin 55 (4): 3–14.Search in Google Scholar
Flood, Sarah, Miriam King, Renae Rodgers, Steven Ruggles, Warren J. Robert, and Michael Westberry. 2022. Integrated Public Use Microdata Series, Current Population Survey: Version 10.0 [Dataset]. Minneapolis: IPUMS.Search in Google Scholar
Meyer, Bruce D., and James X. Sullivan. 2023. “Consumption and Income Inequality in the United States since the 1960s.” Journal of Political Economy 131 (2): 247–84. https://doi.org/10.1086/721702.Search in Google Scholar
Meyer, Bruce D., Derek Wu, and Brian Curran. 2021. Does Geographically Adjusting Poverty Thresholds Improve Poverty Measurement and Program Targeting? Working Paper. Also available at: https://bpb-us-w2.wpmucdn.com/voices.uchicago.edu/dist/d/1370/files/2022/06/Geographic-Adjustments-Paper-4.7-NBER-SI_compressed.pdf.Search in Google Scholar
National Academy of Sciences. 2023. An Updated Measure of Poverty: (Re)Drawing the Line, edited byJames P. Ziliak, Christopher Mackie, and Constance F. Citro. Washington: National Academies Press.Search in Google Scholar
Rothbaum, Jonathan, and Adam Bee. 2021. Coronavirus Infects Surveys, Too: Survey Nonresponse Bias and the Coronavirus Pandemic. United States Census Bureau Working Paper. Also available at: https://www.census.gov/content/dam/Census/library/working-papers/2020/demo/sehsd-wp2020-10.pdf.Search in Google Scholar
U.S. Bureau of Labor Statistics. 2022. Research Poverty Thresholds. Also available at: https://www.bls.gov/pir/spmhome.htm.Search in Google Scholar
U.S. Department of Health and Human Services. 2023. 2023 Poverty Guidelines Computations. Also available at: https://aspe.hhs.gov/topics/poverty-economic-mobility/poverty-guidelines/prior-hhs-poverty-guidelines-federal-register-references/2023-poverty-guidelines-computations.Search in Google Scholar
© 2023 Walter de Gruyter GmbH, Berlin/Boston
Articles in the same Issue
- Frontmatter
- Research Articles
- Gender Differences and Firm Performance: Evidence from India
- The Effect of Soft Skills on Academic Outcomes
- Search and Matching in Political Corruption
- The New Form Agency Problem: Cooperation and Circular Agency
- Lobbying for Tariff Protection, International Technology Licensing and Consumer Surplus
- Active Labour Market Policies: What Works for the Long-Term Unemployed?
- Does Abolishing a Copayment Increase Doctor Visits? A Comparative Case Study
- An Experimental Analysis of Patient Dumping Under Different Payment Systems
- Does Excellence Pay Off? Evidence from the Italian Wine Market
- Letters
- Estimating the Socio-Economic Status of the U.S. Capitol Insurrectionists
- The Effect of Elevating the Supplemental Poverty Measure on Government Program Eligibility and Spending
- Data-Driven Health Innovation and Privacy Regulation