Early Childhood Education Attendance and Students’ Later Outcomes in Europe
-
Daniela Del Boca
 ,
Chiara Monfardini
and
Sarah Grace See
,
Chiara Monfardini
and
Sarah Grace See


Abstract
The importance of investments in early childhood education (ECE) has been widely documented in the literature. Among the benefits, particularly for children from disadvantaged backgrounds, is its potential to mitigate educational inequality. However, some evidence also suggests that the positive effects of ECE on later outcomes tend to dissipate over time, leaving children who attended such programmes no better off academically than those who did not. This paper studies the relationship between students’ years spent in ECE, from 0 to before starting primary school, and the results of their educational assessment outcomes at age 15. Using PISA survey data for 14 European countries from 2015 to 2018, we conduct a cross-country comparison of student performance in reading, mathematics, and science, correlating the results to the duration of ECE attendance. Our findings show that duration in ECE is associated with better assessments at age 15, but that the benefit is nonlinear and peaks at 3–4 years of attendance. Gender and migration background are associated with student performance on the assessments; but we don’t find evidence of heterogeneity in the relationship between ECE duration and test outcomes based on gender and migration background. Instead, we document differential effects of ECE duration according to age of entry to ECE, mother’s education, and the type of educational system attended.
1 Introduction
The early years are crucial to a child’s cognitive and non-cognitive development. Evidence has pointed to the positive effects of early childhood education (ECE) in improving children’s cognitive abilities and socio-emotional development. Several studies have been conducted in European countries such as Denmark (Datta Gupta and Simonsen 2016; Rossin-Slater and Wuest 2020), Norway (Havnes and Mogstad 2015), Spain (Felfe, Nollenberger, and Rodridguez-Planas 2015), and Italy (Brilli, Del Boca, and Pronzato 2016; Del Boca, Martino, and Pronzato 2021; Fort, Ichino, and Zanella 2020).
While most studies focused on the impact of ECE on child outcomes in the short term, there are fewer studies focusing on the long term. Dietrichson, Kristiansen, and Viinjolt (2020) provide a review of the long-term effects of universal childcare, finding that children from low socio-economic status benefit most from such programmes. Other studies, such as Magnuson, Ruhm, and Waldfogel (2007), point to the dissipation of academic skills. These “fadeout effects”, evidenced by declining impacts of short-term positive effects, may be the result of convergence of learning trajectories as children “catch up” with their peers.
The lasting effects of early childhood education programmes on cognitive and achievement outcomes have been investigated by Li et al. (2020), who consider starting age and programme duration in their studies. Using data published between 1960 and 2007, they find that children who started attending in infancy/toddlerhood experienced larger positive effects than those who started in preschool, and that the positive effects were greater following shorter programmes than longer ones.
Our paper contributes to this stream of literature in several ways. First, we examine long-term effects looking at outcome measures at the age of 15, which is approximately when students start secondary school. It is also the age at which they start making decisions about their own education, such as what track to follow. While most of the evidence on long-term effects tends to be based on rather small samples of participants (Karoly and Bigelow 2005; Reynolds et al. 2011; Temple and Reynolds 2007), our evidence draws from a large international sample, similarly to Schuetz (2009), Hanushek, Link, and Woessmann (2013), Bergbauer, Hanushek, and Woessmann (2021), and Laaninen, Kulic, and Erola (2022).
Second, we focus on the “dosage” aspect or the intensive margin of ECE attendance rather than on attendance at the extensive margin, and no consensus has been reached on how long attendance would be optimal. While there are converging results on a positive relation between ECE attendance at the extensive margin (especially in the age period 3–6 years) and educational outcomes, no consensus has been reached on how many years of attendance would be optimal. Loeb et al. (2007) investigate the duration and intensity of US children’s participation in childcare and their short-term effects on cognitive and social behaviours. They find positive effects of centre-based care on reading and math scores at the start of kindergarten. The greatest benefit is found among children who start at ages 2–3, with heterogeneous effects according to family income and race. Blanden et al. (2022) analyse the effect of an additional 3.5 months of preschool education at age 3 in England on children’s school achievement at age 5 and find similar positive effects, as well as a “fading out effect” by age 7. Cornelissen and Dustmann (2019) instead look at the effects of additional schooling before age 5 resulting from changes in school entry rules. They find significant effects for boys at ages 5 and 7, but the positive effects on cognitive outcomes disappear by age 11. Fort, Ichino, and Zanella (2020) exploited admission thresholds in the Bologna day care system, and found that an additional month in day care at ages 0–2 is associated to a 0.5 % reduction in intelligence quotient at ages 8–14. They also found that this negative effect increases with family income. These studies focus on single countries and look at short-term effects.
In our paper, we first examine the role of the duration of ECE attendance from 0 to 6 years (and the impact of age of entry) in shaping long-term cognitive outcomes, observed when students are 15 years of age, exploiting Programme for International Student Assessment (PISA) data across 14 countries. We then explore potential differences in the link between ECE attendance and students’ outcomes and assess heterogeneous effects across a number of dimensions: age of entry, mother’s education, student’s migration background, gender, and type of ECE services (unitary vs. separate settings). The information we have available in PISA data do not allow us to estimate the duration effects causally. However, we believe that the correlational evidence we provide in this paper, controlling for a rich set of observable and unobservable factors, will constitute a strong motivation for further studies aimed at identifying the heterogeneous effects of ECE duration causally.
The paper is organised as follows. The data are described in Section 2, followed by the empirical strategy in Section 3. The results of the main specifications and the heterogeneity analyses are presented in Section 4. The final section summarises the findings and provides some policy implications.
2 The Data
Our analysis is based on the Organisation for Economic Cooperation and Development (OECD)’s Programme for International Student Assessment (PISA), which is a survey of 15-year-old students from different countries that is conducted every three years. The first survey was administered in 2000. We use survey waves with information on our relevant variables, particularly on the duration of ECE attendance. The dataset is appropriate for our study because (1) it contains a rich set of information on the student’s background both family and school, which are important to control for, and (2) it contains a retrospective question on the student’s ISCED-0 or ECE participation, which allows us to look at the long-term relationship to their outcome at age 15.
We follow Rivkin and Schiman (2015) and use the first of the 10 plausible values of assessment scores as the test outcomes in reading, mathematics, and science for our analysis and present estimates based on them.
Among the rich set of information about the student, family background, school, and home environment, of particular interest to our study is the student’s ECE participation (ISCED-0) before entering compulsory school (ISCED-1). For waves 2003, 2009, 2012, 2015, and 2018, the survey asked student respondents to provide some retrospective information about their participation in ISCED level 0 programmes. “ISCED level 0 programmes are usually school-based or otherwise institutionalised for a group of children (e.g. centre-based, community-based, home-based). ISCED level 0 excludes purely family-based arrangements that may be purposeful but are not organised in a ‘programme’ (e.g. informal learning by children from their parents, other relatives or friends is not included under ISCED 0). Within ISCED-0, early childhood educational development programmes are targeted at children aged 0–2 years; and pre-primary education programmes are targeted at children aged three years until the age to start ISCED-1. The upper age limit for the pre-primary education category depends in each case on the theoretical age of entry into ISCED level 1” (OECD 2015).
In the 2003, 2009, and 2012 waves, the survey asks the students whether they attended ISCED-0. Students can answer: no, yes for one year or less, or yes for more than one year. In the 2015 and 2018 waves instead, students are asked the following questions: “How old were you when you started ISCED-0?” and “How old were you when you started ISCED-1?” Students can then respond with the specific age in years. A variable DURECEC is available in the dataset, constructed from the two questions above. Our variable of interest, the duration of participation in ECE, is only available in the 2015 and 2018 PISA data. Hence, we use only these two waves in our analysis to investigate the relationship of the years of ECE attendance (corresponding to ISCED-0 level) with student assessment outcomes in reading, mathematics, and science at 15 years of age.
We control for student’s characteristics, such as age, gender (male or female), and migration background (native, first-generation, or second-generation migrant). Family characteristics that also indicate socio-economic status include: an index for the highest parental occupation status, and mother’s and father’s education recoded into 3 levels (up to ISCED-2 corresponding to education up to lower secondary level, ISCED-3 and ISCED-4 corresponding to upper secondary and post-secondary non-tertiary education, and ISCED-5 and ISCED-6 corresponding to stages of tertiary education). Indicators for the household learning environment are: the language spoken at home (whether similar or different with the test) and categories for the number of books at home (0–10 books, 11–25 books, 26–100 books, 101–200 books, 201–500 books, and more than 500 books). We also include school-level characteristics such as: school size, an indicator whether the school is public (vs. private), the share of funding received from the government, an index for the proportion of all fully-certified teachers, and indicators for the community where the school is located (a village of fewer than 3000 people, a small town of 3000–15,000 people, a town of 15,000 to about 100,000 people, a city of 100,000 to about 1,000,000 people, or a large city or over 1,000,000 people).
We limit our analysis to the following EU countries: Austria, Belgium, Denmark, Finland, France, Germany, Greece, Ireland, Italy, Luxembourg, Netherlands, Portugal, Spain, and the United Kingdom. After removing observations with missing information, our sample consists of 109,012 observations[1] from the 2015 (45,346; 11 countries) and 2018 (63,666, 12 countries) waves of PISA data. Table 1 reports the descriptive statistics for the variables used in our analyses based on the full sample. A little more than half of the sample are girls, 88 % are natives, 6 % are first-generation migrants, and 7 % are second-generation migrants. The parents’ education is given as ISCED levels. Like Dustmann, Frattini, and Lanzara (2012), we classified ISCED levels 0–2 (up to lower-secondary education) as low education, and ISCED levels 5 and 6 (tertiary education) as high education. Around half of the student sample have high-educated parents, at 51 and 48 % for maternal and paternal education, respectively. Comparing the two, mothers are generally more educated than fathers, with 24 % of the fathers being low educated, as opposed to 20 % of the mothers. As regards the number of books at home, there is an inverted U-shaped pattern, wherein 30 % of the sample have 26–100 books, followed by 20 % with 101–200 books. Approximately 85 % of the sample speak the language used on the test at home. In terms of school characteristics, 80 % are public schools, with an average of 79 % of the funding coming from the government, and 87 % average having fully certified teachers. The schools are mostly in towns (64 %), with some in cities (30 %) and a few in villages (6 %).
Descriptive statistics.
| Variable | Mean | Std. dev. |
|---|---|---|
| (1) Test assessment outcomes, overall | ||
| Reading | 502.000 | 93.848 |
| Mathematics | 501.881 | 87.911 |
| Science | 501.857 | 91.781 |
| Test assessment outcomes, low-educated mothers | ||
| Reading | 487.836 | 91.372 |
| Mathematics | 487.717 | 86.886 |
| Science | 486.217 | 89.340 |
| Test assessment outcomes, high-educated mothers | ||
| Reading | 515.668 | 94.180 |
| Mathematics | 515.549 | 86.823 |
| Science | 516.949 | 91.579 |
| Test assessment outcomes, native background | ||
| Reading | 506.681 | 92.013 |
| Mathematics | 506.187 | 86.654 |
| Science | 506.677 | 90.387 |
| Test assessment outcomes, first-generation migrants | ||
| Reading | 460.927 | 100.617 |
| Mathematics | 465.069 | 91.640 |
| Science | 463.442 | 95.160 |
| Test assessment outcomes, second-generation migrants | ||
| Reading | 474.263 | 98.799 |
| Mathematics | 475.564 | 89.477 |
| Science | 470.035 | 93.331 |
| Test assessment outcomes, girls | ||
| Reading | 513.041 | 89.855 |
| Mathematics | 496.177 | 84.878 |
| Science | 499.811 | 88.613 |
| Test assessment outcomes, boys | ||
| Reading | 489.833 | 96.610 |
| Mathematics | 508.166 | 90.722 |
| Science | 504.111 | 95.100 |
| Test assessment outcomes, unitary ECE setting | ||
| Reading | 507.339 | 91.845 |
| Mathematics | 506.003 | 84.964 |
| Science | 510.105 | 90.817 |
| Test assessment outcomes, separate ECE setting | ||
| Reading | 496.229 | 95.633 |
| Mathematics | 497.427 | 90.779 |
| Science | 492.943 | 91.984 |
| (2a) Duration of ECE attendance | ||
| ECE: 0 to <1 year | 0.033 | 0.180 |
| ECE: 1 to <2 years | 0.116 | 0.320 |
| ECE: 2 to <3 years | 0.241 | 0.428 |
| ECE: 3 to <4 years | 0.436 | 0.496 |
| ECE: 4 to <5 years | 0.124 | 0.330 |
| ECE: 5 or more years | 0.049 | 0.216 |
| (2b) Age of entry to ECE | ||
| Did not attend ECE | 0.018 | 0.133 |
| Starting age: 1 year or younger | 0.054 | 0.225 |
| Starting age: 2 years old | 0.174 | 0.382 |
| Starting age: 3 years old | 0.485 | 0.500 |
| Starting age: 4 years old | 0.166 | 0.373 |
| Starting age: 5 years or older | 0.100 | 0.299 |
| (3) Student characteristics | ||
| Age | 15.793 | 0.292 |
| Female | 0.524 | 0.499 |
| Native background | 0.879 | 0.327 |
| First-generation migrant | 0.056 | 0.229 |
| Second-generation migrant | 0.066 | 0.248 |
| (4) Parents’ characteristics | ||
| Mother’s education: low | 0.196 | 0.397 |
| Mother’s education: middle | 0.296 | 0.456 |
| Mother’s education: high | 0.509 | 0.500 |
| Father’s education: low | 0.238 | 0.426 |
| Father’s education: middle | 0.284 | 0.451 |
| Father’s education: high | 0.479 | 0.500 |
| Highest parental occupational status (ISEI index) | 51.788 | 22.210 |
| (5) Home environment | ||
| Books at home: 0–10 books | 0.110 | 0.313 |
| Books at home: 11–25 books | 0.150 | 0.357 |
| Books at home: 26–100 books | 0.299 | 0.458 |
| Books at home: 101–200 books | 0.195 | 0.396 |
| Books at home: 201–500 books | 0.159 | 0.366 |
| Books at home: more than 500 books | 0.086 | 0.280 |
| Language at home is same as test | 0.844 | 0.363 |
| (6) School characteristics | ||
| School size | 803.509 | 586.478 |
| Public school | 0.790 | 0.407 |
| Share of total funding for school year from government | 85.068 | 24.118 |
| Index proportion of all fully certified teachers | 0.873 | 0.256 |
| School is in a village | 0.058 | 0.234 |
| School is in a small town | 0.260 | 0.439 |
| School is in a town | 0.383 | 0.486 |
| School is in a city | 0.232 | 0.422 |
| School is in a large city | 0.067 | 0.250 |
| Number of observations from the full sample | 109,012 |
-
Note: This table reports the mean and standard deviation of the variables from our full sample, consisting of 109,012 student-level observations, derived from the pooled 2015 and 2018 waves of PISA data that we used in our analysis. Each block corresponds to a group of variables: (1) Test assessment outcomes in reading (pv1read), mathematics (pv1math), and science (pv1scie) for the full sample, for students with low-educated mothers, with high-educated mothers, for students with native, first-generation migrant, second-generation migrant background, for girls, boys, and for unitary ECE and separate ECE settings, (2) Categories of duration spent in ECE or ISCED-0 level, and of age of entry to ECE, (3) Student characteristics including age, gender, and migration background, (4) Parents’ characteristics including categories of mother’s and father’s education and an index for the highest parental occupation status, (5) The home environment which include categories of the number of books at home and an indicator for whether the language at home is the same as in the test, and (6) School characteristics such as school size, an indicator for public school versus private, the share of total funding for the school year received from the government, an index indicating the proportion of all fully-certified teachers, and indicators for the community where the school is located. We use these groupings of covariates in our estimation. See Section 3 for the model and Section 4 for the empirical results.
The students in our sample are born in years 1999/2000 and 2002/2003. Most of them attended ECE for 3–4 years (43.6 %) or for 2–3 years (24.13 %). That would roughly coincide with students entering ISCED-0 at ages 3 or 2 years old. We are interested in how the duration of ECE attendance during the early years correlates with assessment scores at age 15. Table 2 shows the average test scores by years of ECE attendance. The test averages increase with additional years of ECE attendance reaching the highest value in correspondence to 3–4 years of ECE: 506.33, 508.10, and 506.74 for reading, mathematics, and science, respectively. Attendance of four years or more corresponds to lower test scores, but not as low as 0 to less than two years of ECE attendance. This pattern may be the result of ECE settings and the ages at which children experience the learning environment. Shorter ECE participation means children have had less time to acquire skills, while longer ECE participation implies that they started attending when they were younger. For children aged 0–2, the educational environments in the ECE may not be appropriately stimulating to promote development for all young children. We explore the impact of duration for each age of entry in ECE in Section 4.1.
Average test scores and years of ECE attendance.
| Reading | Mathematics | Science | ||||
|---|---|---|---|---|---|---|
| Mean | Std. dev. | Mean | Std. dev. | Mean | Std. dev. | |
| ECE: 0 to <1 year | 459.264 | 97.406 | 463.664 | 88.980 | 463.172 | 92.712 |
| ECE: 1 to <2 years | 499.420 | 95.332 | 491.581 | 87.693 | 497.100 | 94.708 |
| ECE: 2 to <3 years | 500.866 | 93.746 | 501.538 | 88.743 | 500.918 | 92.576 |
| ECE: 3 to <4 years | 506.333 | 91.496 | 508.096 | 86.224 | 506.742 | 88.990 |
| ECE: 4 to <5 years | 503.386 | 95.168 | 503.309 | 87.449 | 502.485 | 92.421 |
| ECE: 5 or more years | 500.662 | 97.925 | 494.996 | 90.285 | 498.975 | 95.879 |
| Overall mean | 502.000 | 93.848 | 501.881 | 87.911 | 501.857 | 91.781 |
| Number of observations | 109,012 | 109,012 | 109,012 | |||
-
Note: This table reports the average assessment scores in reading (pv1read), mathematics (pv1math), and science (pv1scie), and the corresponding standard deviations, according to the years of participation in ECE. The highest values correspond to 3 to less than 4 years of ECE participation, and the lowest values correspond to 0 to less than one year of ECE participation.
3 Empirical Model
To estimate the correlational link between ECE and later student achievement – net of a rich set of observables and unobservable covariates, we use an education production function framework, where student outcome is conceived as a function of family and school inputs (e.g. Lazear 2001; Todd and Wolpin 2007). A simple linear formulation of the education production function yields the following empirical model,
where reading, mathematics, and science assessment T of student i in school s of country c at time t (2015 or 2018) is a function of the student’s attendance to ECE or ISCED-0 programmes in the early years ( E ) before entering compulsory (primary) schooling t 0, and inputs from family ( F ) and school ( S ). The parameters μ c , μ t , and μ ct are country, year, and country-by-year fixed effects, respectively, and ε ict is an individual-specific time-varying error term. The model allows for non-constant partial effects of ECE attendance, since E is a vector composed of dummy variables indicating the years of ECE attended (0 to <1, 1 to <2, 2 to <3, 3 to <4, 4 to <5, and 5 or more years). The vector of student and family characteristics includes: age (in years), gender, migration background (native, first-generation, second-generation), mother’s education (ISCED levels), father’s education (ISCED levels), highest parental occupation status (ISEI index),[2] books at home (0–10, 11–25, 26–100, 101–200, 201–500, more than 500), and language at home (if the same as test). School-level variables include: public school (vs. private), school size (number of students), share of funding received from the government, proportion of fully certified teachers, and school community (whether located in a village, small town, town, city, or large city).
Our parameters of interest are the six parameters contained in α, which are the partial effects of each level of ECE attendance on achievement, holding other inputs and covariates constant.
We pooled two waves of PISA data that contain student-level information and implement a fixed effects estimation approach, similar to Hanushek, Link, and Woessmann (2013) and Bergbauer, Hanushek, and Woessmann (2021). Country fixed effects μ c account for country-specific time-invarying factors, such as the state of social and economic institutions, or families’ attitudes to children’s education. Time fixed effects μ t account for common shocks affecting PISA data tests in a wave or changes in testing instruments across waves, as well as for cohort-specific characteristics. Country-by-year fixed effects μ ct account for country-specific time-varying characteristics, such as changes in spending levels.
In a further specification, we include school fixed effects, like Lavy (2015) and Freeman and Viarengo (2014). Because the schools are not observed panel-wise, we are essentially removing school-specific covariates that are time-constant. Since schools are nested within a country, school fixed effects also effectively capture country fixed effects. Basically, this approach allows us to estimate school effects through the similarity of outcomes among students in the same school without measures of school policies.
Our estimation is therefore based on variations in students’ attendance of early education, exploiting within-country (and within-school) variation in individual ECE participation and eliminating any time influences on the estimates. The OLS estimators adjust for observable factors, though the resulting estimates do not lead to a causal interpretation. The plausibility of the conditional independence assumption required for a causal interpretation depends on the relationship between the assessment outcomes ( T ) and the covariates ( F , S ). As such, we explore the stability of the parameters of interest by varying the set of control variables. We use four sets of covariates. The first includes variables that refer to the student: age, gender, and migration background. The second includes parents’ characteristics such as mother’s education, father’s education, and the highest parental ISEI index. The third set includes the home learning environment which is represented by a set of dummy variables indicating the categories of number of books at home. And lastly, the fourth set of covariates include the school characteristics such as school size, public/private school, share of funding from the government, proportion of fully certified teachers, and school location.
4 The Empirical Results
This section presents our main results, as well as heterogeneity analysis based on duration-by-age, mother’s education, migration background, student gender, and on the institutional characteristics of the ECE provision. Tables 3 –5 show the estimated coefficients of ECE attendance on reading, mathematics, and science in international education production functions, with various sets of controls and country, year, country-by-year, and school fixed effects. The sets of controls in our specifications include student, family, and school characteristics as explanatory variables.
Regression results for reading.
| VARIABLES | Reading | |||||
|---|---|---|---|---|---|---|
| (1) | (2) | (3) | (4) | (5) | (6) | |
| ECE: 1 to <2 years | 32.746a | 27.015a | 21.984a | 19.070a | 19.176a | 16.085a |
| (3.169) | (2.343) | (2.472) | (2.120) | (2.143) | (1.581) | |
| ECE: 2 to <3 years | 44.556a | 37.452a | 29.318a | 24.938a | 24.741a | 20.519a |
| (4.794) | (3.881) | (3.652) | (3.520) | (3.532) | (1.523) | |
| ECE: 3 to <4 years | 53.756a | 44.352a | 33.863a | 27.950a | 27.613a | 23.818a |
| (4.698) | (3.791) | (4.013) | (3.735) | (3.801) | (1.499) | |
| ECE: 4 to <5 years | 46.042a | 37.105a | 24.988a | 19.750a | 18.948a | 17.105a |
| (4.074) | (3.480) | (3.353) | (3.105) | (3.169) | (1.603) | |
| ECE: 5 or more years | 39.469a | 30.265a | 18.151a | 14.200b | 13.227b | 12.780a |
| (6.400) | (6.015) | (5.046) | (4.856) | (4.775) | (1.869) | |
| Student characteristics | Y | Y | Y | Y | Y | |
| Parents’ characteristics | Y | Y | Y | Y | ||
| Home environment | Y | Y | Y | |||
| School characteristics | Y | |||||
| Country, year FE | Y | Y | Y | Y | Y | Y |
| Country-by-year FE | Y | Y | Y | Y | Y | Y |
| School FE | Y | |||||
| Observations | 109,012 | 109,012 | 109,012 | 109,012 | 109,012 | 109,012 |
| R-squared | 0.017 | 0.049 | 0.136 | 0.212 | 0.220 | 0.112 |
| Number of countries | 14 | 14 | 14 | 14 | 14 | |
| Number of schools | 4983 | |||||
-
Note: This table reports the estimated coefficients for regressions on the reading test (pv1read) as the dependent variable. Column 1 shows the results for estimation controlling for country, year, and country-by-year fixed effects. Column 2 additionally includes student characteristics: age, gender, and migration background. Column 3 additionally includes parents’ characteristics: mother’s education, father’s education, and highest parental ISEI. Column 4 additionally includes home environment: the number of books and the language spoken at home. Column 5 additionally includes school characteristics: school size, public/private school, share of funding from the government, proportion of fully certified teachers, and school location. Column 6 implements a school fixed effects estimation. Full regression results are shown in Table A1 in the Appendix. Robust standard errors are clustered (Columns 1–5 by country, Column 6 by school) in parentheses. a p < 0.01, b p < 0.05, c p < 0.10.
Regression results for mathematics.
| VARIABLES | Math | |||||
|---|---|---|---|---|---|---|
| (1) | (2) | (3) | (4) | (5) | (6) | |
| ECE: 1 to <2 years | 24.379a | 20.080a | 15.025a | 12.645a | 12.701a | 10.465a |
| (1.890) | (1.353) | (1.451) | (1.215) | (1.095) | (1.454) | |
| ECE: 2 to <3 years | 37.615a | 32.411a | 24.288a | 20.485a | 20.383a | 16.692a |
| (3.508) | (3.106) | (2.929) | (2.896) | (2.849) | (1.374) | |
| ECE: 3 to <4 years | 46.459a | 40.364a | 29.904a | 24.731a | 24.419a | 20.681a |
| (3.485) | (2.761) | (2.867) | (2.738) | (2.769) | (1.367) | |
| ECE: 4 to <5 years | 39.364a | 33.784a | 21.666a | 17.062a | 16.319a | 13.753a |
| (3.673) | (3.044) | (2.698) | (2.494) | (2.512) | (1.475) | |
| ECE: 5 or more years | 30.144a | 24.827a | 12.691b | 9.212b | 8.477c | 7.628a |
| (5.499) | (5.584) | (4.314) | (4.161) | (4.118) | (1.720) | |
| Student characteristics | Y | Y | Y | Y | Y | |
| Parents’ characteristics | Y | Y | Y | Y | ||
| Home environment | Y | Y | Y | |||
| School characteristics | Y | |||||
| Country, year FE | Y | Y | Y | Y | Y | Y |
| Country-by-year FE | Y | Y | Y | Y | Y | Y |
| School FE | Y | |||||
| Observations | 109,012 | 109,012 | 109,012 | 109,012 | 109,012 | 109,012 |
| R-squared | 0.014 | 0.038 | 0.135 | 0.208 | 0.215 | 0.107 |
| Number of countries | 14 | 14 | 14 | 14 | 14 | |
| Number of schools | 4983 | |||||
-
Note: This table reports the estimated coefficients for regressions on the mathematics test (pv1math) as the dependent variable. Column 1 shows the results for estimation controlling for country, year, and country-by-year fixed effects. Column 2 additionally includes student characteristics: age, gender, and migration background. Column 3 additionally includes parents’ characteristics: mother’s education, father’s education, and highest parental ISEI. Column 4 additionally includes home environment: the number of books and the language spoken at home. Column 5 additionally includes school characteristics: school size, public/private school, share of funding from the government, proportion of fully certified teachers, and school location. Column 6 implements a school fixed effects estimation. Full regression results are shown in Table A2 in the Appendix. Robust standard errors are clustered (Columns 1–5 by country, Column 6 by school) in parentheses. a p < 0.01, b p < 0.05, c p < 0.10.
Regression results for science.
| VARIABLES | Science | |||||
|---|---|---|---|---|---|---|
| (1) | (2) | (3) | (4) | (5) | (6) | |
| ECE: 1 to <2 years | 27.260a | 22.528a | 17.457a | 14.784a | 14.793a | 11.988a |
| (2.689) | (2.220) | (2.304) | (1.960) | (1.967) | (1.531) | |
| ECE: 2 to <3 years | 38.944a | 33.196a | 25.010a | 20.812a | 20.683a | 16.590a |
| (4.613) | (3.964) | (3.748) | (3.549) | (3.550) | (1.445) | |
| ECE: 3 to <4 years | 47.462a | 40.504a | 29.951a | 24.228a | 23.929a | 19.908a |
| (4.746) | (4.177) | (4.208) | (3.747) | (3.822) | (1.426) | |
| ECE: 4 to <5 years | 38.951a | 32.502a | 20.266a | 15.183a | 14.555a | 12.394a |
| (3.972) | (3.518) | (3.229) | (2.935) | (3.034) | (1.535) | |
| ECE: 5 or more years | 30.900a | 24.663a | 12.398b | 8.574c | 7.909 | 6.928a |
| (5.871) | (5.857) | (4.781) | (4.603) | (4.597) | (1.829) | |
| Student characteristics | Y | Y | Y | Y | Y | |
| Parents’ characteristics | Y | Y | Y | Y | ||
| Home environment | Y | Y | Y | |||
| School characteristics | Y | |||||
| Country, year FE | Y | Y | Y | Y | Y | Y |
| Country-by-year FE | Y | Y | Y | Y | Y | Y |
| School FE | Y | |||||
| Observations | 109,012 | 109,012 | 109,012 | 109,012 | 109,012 | 109,012 |
| R-squared | 0.014 | 0.034 | 0.126 | 0.207 | 0.212 | 0.106 |
| Number of countries | 14 | 14 | 14 | 14 | 14 | |
| Number of schools | 4983 | |||||
-
Note: This table reports the estimated coefficients for regressions on the science test (pv1scie) as the dependent variable. Column 1 shows the results for estimation controlling for country, year, and country-by-year fixed effects. Column 2 additionally includes student characteristics: age, gender, and migration background. Column 3 additionally includes parents’ characteristics: mother’s education, father’s education, and highest parental ISEI. Column 4 additionally includes home environment: the number of books and the language spoken at home. Column 5 additionally includes school characteristics: school size, public/private school, share of funding from the government, proportion of fully certified teachers, and school location. Column 6 implements a school fixed effects estimation. Full regression results are shown in Table A3 in the Appendix. Robust standard errors are clustered (Columns 1–5 by country, Column 6 by school) in parentheses. a p < 0.01, b p < 0.05, c p < 0.10.
The results show that the years of attendance of ECE has a positive and statistically significant partial correlation with all three test outcomes. The magnitudes of the estimated coefficients indicate a nonlinear relationship, with the maximum “benefit” observable at three to less than four years of ECE attendance, compared to 0 to less than one year of ECE attendance.
Column 1 shows results from an estimation with country, year, and country-by-year fixed effects. Attendance of three to less than four years of ECE is associated with 53.76 more standard deviation points in reading, 46.46 more in mathematics, and 47.46 more in science. These magnitudes are higher than the estimated magnitudes for one to less than two years of ECE attendance – 32.75 for reading, 24.38 for mathematics, and 27.26 for science, respectively. Statistical tests show that the difference between the two duration categories for the three outcomes are significant at 99 % confidence levels for reading and mathematics, and 95 % confidence level for science.
The general results hold true even after introducing other covariates. Column 2 includes student characteristics, namely: age, gender, and migrant background; column 3 includes the education of both parents and the highest parental ISEI. The magnitudes of our estimated coefficients for duration of ECE attendance decrease by about 20 % when we include student-level covariates (column 2), and by 30–50 % (compared to column 1) when we also include parent characteristics. A drastic drop (70–90 %) in the estimated coefficients occurs when we further include home environment variables, such as the number of books and the language spoken at home, shown in column 4. The differences of these results with the estimated coefficients from the basic model (column 1) are all statistically significant at 99 % confidence level. The estimated coefficients we get are similar to those shown in column 5, which additionally includes school-level covariates such as school size, an indicator for public (vs. private) school, share of funding from government, proportion of fully certified teachers, and school location. This is also supported by the non-significant statistical result of a Chow test comparing the coefficients of the two models. In column 6, we include school fixed effects. We find that adding school fixed effects in the estimation substantially decreases the estimated impacts of ECE attendance (and student and family background) on test scores, but the impact of ECE attendance remains positive and statistically significant in explaining reading, mathematics, and science assessments at 15 years old. Having participated in ECE is associated with 12.78–23.82 more standard deviation points in reading. This is equivalent to 14–25 % of the standard deviation of reading at 93.85. Results for mathematics are between 7.63 and 20.68, which is equivalent to 9–24 % of the standard deviation at 87.91; and science results are between 6.93 and 19.91, equivalent to 8–22 % of the standard deviation of 91.78. We note that while the results for our ECE variables are still positive and statistically significant, the magnitudes in column 6 have dropped by at least 50 % of the results in column 1, the differences of which are statistically significant at 99 % confidence levels. This gives an indication of the possible relation of ECE participation with student, family, and school-specific covariates that may confound its impact on the assessment outcomes. As a result, the initial minimum benefit shown at one to less than two years of ECE participation changes. Once we control for parental characteristics, the minimum has changed instead to five or more years of ECE participation, while the peak remains at three to less than four years. This is true for all three outcomes.
Looking at the estimated coefficients of the other explanatory variables provides additional information. Parental education and occupation are positively related to student outcomes, as is commonly reported in the literature (e.g. Martins and Veiga 2010). We find that together with parental characteristics, variables indicating the home learning environment are strong predictors of student performance. Taking the test in the same language as that spoken at home is particularly significant for the reading test. Similar to Brunello, Weber, and Weiss (2017), the number of books at home is a similarly strong predictor of test outcomes, with the magnitudes of the contribution to the test scores increasing with the number of additional books at home. By looking at column 5, we can also see the contribution of school inputs to student performance (e.g. Das et al. 2013). We find schools with more students and more fully certified teachers are positively associated with student assessment scores. School location in towns and (big) cities are likewise positively related to our outcomes.
Our OLS specifications include a rich set of student, family, and school controls that aim to help establish the true relationship between duration of ECE participation and student assessment outcomes. We additionally removed school-specific time-invariant unobserved heterogeneity by implementing a school fixed effects regression, minimizing the potential omitted variable bias. While we can argue that ECE participation does not have a reverse causal relationship on the assessment scores precisely because ECE participation is an event that happened during the student’s early years, while we look at the outcomes at 15 years old, and the latter cannot influence the former, this information may be subject to recall bias and measurement error given the time elapsed in between events. Moreover, the parents’ decision for the student to participate in ECE, at what age, and for how long may be endogenous. Unobserved dimensions such as parental beliefs can drive such decisions. Studies have shown that higher-educated mothers are more likely to utilize formal childcare and education services, not only for its potential benefits to the child, but also because higher-educated mothers are more likely to be employed and would need to access such services. Similarly, non-migrant (native) parents are more likely to send their offspring to such care, compared to migrant parents who are less likely to do so. Literature on ECE is also largely divided between those that investigate children at 3–5 years old referring to pre-primary education, and those that examine children at 0–2 years old referring to early childhood education programmes or day/child care (See Carta and Rizzica 2018; Corrazzini, Meschi, and Pavese 2021; Fort, Ichino, and Zanella 2020; Morando and Platt 2022 for some discussions on this issue).
We do not have access to appropriate instruments to construct a causal analysis out of this relationship. Hence, our estimates can only be interpreted as descriptive, but they provide new insights on the importance of duration of ECE in shaping long-term outcomes. Exploiting information contained in PISA data, we can indeed explore a rich set of heterogeneous duration effects. Specifically, in the next section, we analyse differences in ECE duration and student outcomes relationship based on age of entry, maternal education, migration background, gender, and lastly, on the ECE institutional setting.
4.1 Heterogeneity of Duration Effects by Age of Entry
Students can start ECE at the same age, but participate for different duration periods. Consider two students who both started ECE at age 3, but one stayed for two years and the other stayed for four years. How would this difference affect their outcomes at 15 years old? In this sub-section, we explore heterogeneity effects of duration periods for each ECE starting age, removing students who have not attended ECE (n=1959) from the sample. Table A4 in the Appendix shows the distribution of the two variables: duration of ECE participation and age of entry to ECE. From the frequency distribution, about 74 % of our sample started ECE at ages 2 to less than three and three to less than four years old. We focus the discussion on them.
The analysis is done by inserting into our original specification a set of dummy variables indicating the age of entry to ECE and then interacting this set of variables with the set of dummy variables indicating the duration of ECE participation. Figure 1A–C show the marginal effects of each duration period for every starting age for reading, mathematics, and science, respectively. These are computed from the linear combinations of the two variables and the interaction between them.
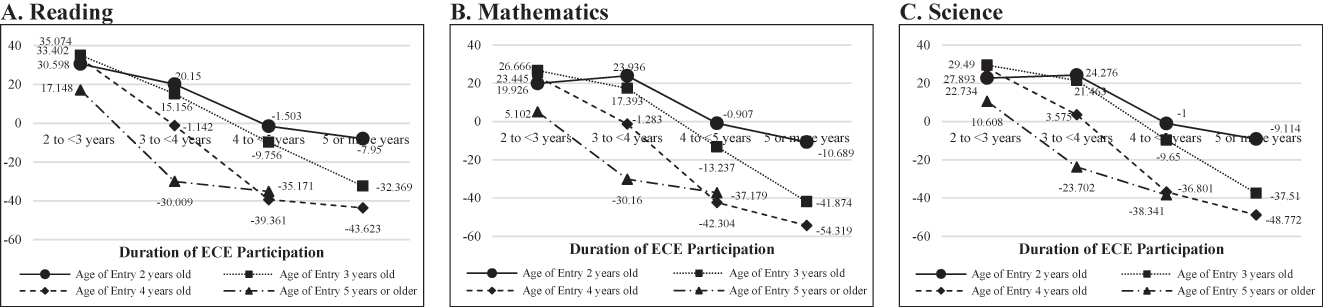
Marginal effects of duration-by-starting age on test scores. Note: The three graphs show the marginal effects of duration of ECE participation for each age of entry estimated for reading (pv1read), mathematics (pv1math), and science (pv1scie) scores. See Table A6 in the Appendix for the numerical figures. Full regression results are shown in Table A5 in the Appendix.
Among the students who started ECE at two years of age, a two to less than three years of ECE participation improves the reading, mathematics, and science assessment outcomes by 30.60, 19.93, and 22.73 points, respectively. This is in reference to students who started at the same age but participated for a shorter time of less than two years. The “positive gain” is a bit less when students start ECE at two years old but participate for three to less than four years. Reading improves by 20.15 points, while mathematics and science increase by 23.94 and 24.28 points, respectively. ECE duration of four years or more instead lead to negative gains, vis-à-vis those who participated for less than two years.
We next look at students who started ECE at three years old. Compared to those who participated for less than two years, students who stayed for two to less than three years gain 35.07, 26.67, and 29.49 points on reading, mathematics, and science, respectively. The positive gains are reduced to 15.16, 17.39, and 21.46 points for the three tests, when students who started at three years old participate on ECE for three to less than four years. Again, results for ECE duration of four or more years lead to negative gains in their assessment outcomes, compared to the students who participated in ECE for less than two years.
The combination of the ECE duration and the starting age of three years old corresponds to the age that student started primary school. Studies exploring the age effects of students in class investigate the relative age of students based on birthday cut-offs with policy implications on legal school age policies and redshirting for children (see e.g. Bedard and Dhuey 2006; Black, Devereux, and Salvanes 2011; Datar 2006; Elder and Lubotsky 2009). While related, our study focuses on formal education received before starting school. Overall, we see the largest positive gains among students who have participated in ECE for two to less than three years for all ages of entry. Among all the starting ages, the biggest positive gain is seen among those who started ECE at three years old, generally corresponding to starting age for pre-primary or ISCED-02. The combination corresponds to starting primary school at about 5 or 6 years old.
4.2 Mother’s Education
The descriptive statistics in Table 1 indicate that students of mothers with tertiary education, considered as high-educated, score higher than the other students. This is true for all three outcomes, and the differences are statistically different from 0 at 99 % level of significance based on a t-test comparing the means of the two groups. Here, we investigate whether the link between duration of ECE attendance and test outcomes at age 15 is similar for students. We do so by estimating the same specification as the school fixed effects model from our main results, with all the covariates interacted with a dummy variable indicating a high-educated mother. Figure 2A–2C show the estimates differentiating students with high-educated mothers from the rest, based on the values shown in Appendix Table A8. The magnitudes indicate that compared to the rest of the students, the estimated coefficients of ECE duration for those with high-educated mothers are larger for all three assessment outcomes. We also see a peak at three to less than four years of ECE participation, supporting our previous findings.
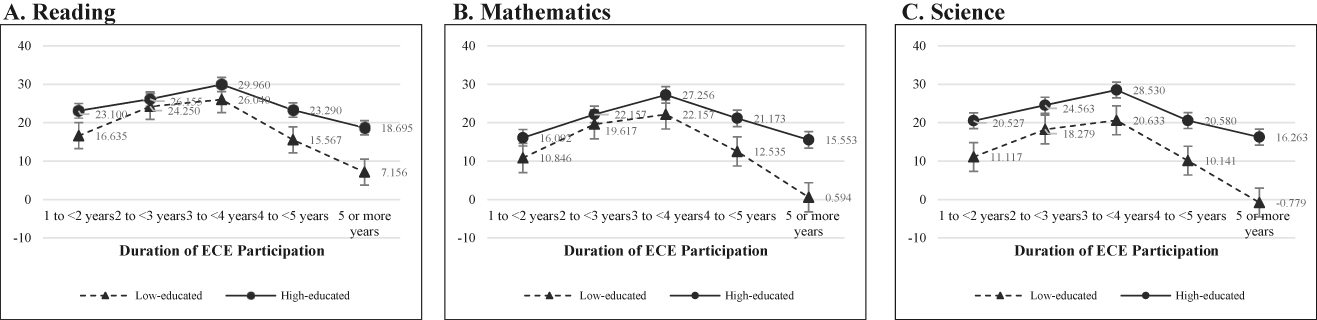
Duration of ECE participation and test scores, by maternal education. Note: The graphs plot the estimated coefficients of the duration of ECE participation for reading (pv1read), mathematics (pv1math), and science (pv1scie) assessment scores for students with low-educated and with high-educated mothers. See Table A8 in the Appendix for the numerical figures. Full regression results are shown in Table A7 in the Appendix.
We performed Wald tests on different groups of covariates. Table A9 in Appendix reports the p-values from the test of parameters equality across mother’s education on groups of covariates to verify whether there are significant differences. Results from the Wald tests show statistical significance for all groups of covariates except school characteristics for science, indicating differences according to mother’s education in how ECE duration affects student assessment outcomes at 15 years old.
Our results differ from findings such as studies by Corrazzini, Meschi, and Pavese (2021) and Carta and Rizzica (2018), who found positive to no heterogeneity effects of early childcare and early access to kindergarten. In our sample, students with high-educated mothers have participated in ECE longer than those with low-educated mothers, with averages of 2.711 and 2.587 years respectively. A simple t-test reveals that this 1.5 month difference is statistically significant. This may be related to high-educated mothers entering the workforce earlier and enrolling their children to ECE earlier as well. Another related reason is that high-educated mothers may be more informed of the beneficial effects of ECE. Students with high-educated mothers started ECE at about 2.975 years old, compared to 3.080 years old for students with low-educated mothers. While seemingly small in magnitude, this 1.26 month difference is again statistically significant at 1 % level using a simple t-test. High-educated mothers may also be choosing ECE with high quality, and/or may be providing additional or alternative care and provision (family care, relatives, grandparents, nannies, etc.) that are of high quality. Unfortunately, the PISA dataset does not contain these information, which are needed to capture such impacts.
4.3 Migration Background (Natives and Second-Generation Migrants)
We also investigate whether the link between duration of ECE attendance and test outcomes at age 15 is similar for students based on migration background. For this analysis, we subset our sample to students born in the country of test, namely the native-born and the second-generation migrant students, removing the first-generation migrant students (n=6062) from our sub-sample. This is consistent with the practice in the migration literature (e.g. Corrazzini, Meschi, and Pavese 2021; Dustmann, Frattini, and Lanzara 2012). Our sample shows that the test scores of native-born students have higher averages at about 506 points for all three subject outcomes, while those of second-generation migrant student are about 470.03–475.56 points. A means comparison test of the two groups show that the difference for each subject is statistically different from zero, with a 99.9 % level of significance.
We performed a similar procedure of estimating a model with school FE that is fully-interacted with a dummy variable indicating the second-generation migration background status on the sub-sample described above. We then performed the Wald tests, wherein the results indicate that ECE duration for natives and second-generation migrants are not statistically different. This is contrary to the findings from Corrazzini, Meschi, and Pavese (2021) who found that early childcare attendance in Italy improves the immigrant students’ language test scores while affecting native students’ negatively. The p-values from a test of equality of subsets of parameter across migration are shown in Table 6 below, to see whether there are significant differences based on migration background.
Results of tests of equality of subset of parameters across migration (p-values).
| Reading | Mathematics | Science | |
|---|---|---|---|
| Second-generation migrant dummy variable interacted with: | |||
| All covariates, plus migrant dummy | 0.000 | 0.000 | 0.000 |
| ECE duration | 0.064 | 0.346 | 0.340 |
| Student characteristics | 0.997 | 0.810 | 0.945 |
| Parents characteristics | 0.024 | 0.002 | 0.004 |
| Home environment | 0.527 | 0.630 | 0.431 |
| School characteristics | 0.000 | 0.000 | 0.000 |
| Country, year, country-by-year FE | Yes | Yes | Yes |
-
Note: This table contains p-values of the tests of equality of subset of parameters across migration background of the covariates listed in the first column. The test is obtained in a model fully-interacted with the second-generation migrant dummy variable. Full regression results are shown in Table A10 in the Appendix.
Parent and school characteristics have p-values below 0.05, which indicate statistical significance in migration background difference in these parameters of 95 and 99 % confidence intervals. For all the other sets of characteristics, including the ECE duration (apart from that for reading), the significance of the joint tests of these variables interacted with migration background is not statistically significance. This means that although native-born and second-generation migrant students perform differently on reading, mathematics, and science tests in PISA data, the link between ECE attendance and test scores is not different for these two groups.
4.4 Gender Differences
From the descriptive statistics in Table 1, female students perform better than males in reading, but worse in mathematics and science. This is also confirmed by the corresponding signs of our estimated coefficients for the variable indicating the student’s gender as female, seen in Tables A1–A3 – positive for reading and negative for mathematics and science. This finding resembles that of Dee (2007). However, our focus here is to investigate whether the link between duration of ECE attendance and test outcomes at age 15 is similar for male and female students. We therefore perform a similar exercise of estimating the same specification as the school FE model, with all the covariates interacted with the gender variable. Table 7 reports a test of parameters equality across gender on groups of covariates to verify whether there are gender significant differences.[3]
Results on tests of equality of subset of parameters gender (p-values).
| Reading | Mathematics | Science | |
|---|---|---|---|
| Equality of gender of parameters of: | |||
| All covariates, plus constant | 0.000 | 0.000 | 0.000 |
| ECE duration | 0.308 | 0.122 | 0.147 |
| Student characteristics | 0.034 | 0.015 | 0.040 |
| Parents characteristics | 0.006 | 0.016 | 0.001 |
| Home environment | 0.001 | 0.001 | 0.003 |
| School characteristics | 0.001 | 0.002 | 0.005 |
| Country, year, country-by-year FE | Yes | Yes | Yes |
-
Note: This table contains p-values of the tests of equality of subset of parameters across gender of the covariates listed in the first column. The test is obtained in a model fully-interacted with the gender dummy variable. Full regression results are available from the authors.
Apart from ECE duration, each of the set of characteristics has p-values below 0.05, indicating statistical significance in gender difference in the parameters at 95 % and 99 % confidence intervals. Instead, the significance of the joint test of ECE variables interacted with gender is not statistically significant, which indicates that although male and female students perform differently on the tests, the link between ECE attendance and test scores is not different between the two groups.
Given these results, we estimate a model where all the covariates are interacted with gender, except for the variables indicating ECE duration. The estimated coefficients are shown in columns 4–6 of Appendix Table A11. Our results show evidence of a non-differential gender link between ECE attendance and assessment outcomes at 15 years of age. This is in line with the findings in the literature, such as by Corrazzini, Meschi, and Pavese (2021; see Dietrichson, Kristiansen, and Viinjolt 2020, which provides a systematic review on preschool programs and long-run outcomes), though differently from Fort, Ichino, and Zanella (2020) who found negative effects of additional daycare attendance (ages 0–2) on later (age 8–14) Big Five personality traits of girls from affluent families in Italy.
With this model, we find the same non-constant patterns previously described. The largest magnitudes are at three to less than four years, with 27.71, 24.48, and 24.06 for reading, mathematics, and science, respectively. These results are similar to those in Columns 5 in Tables 3 –5. The lowest are at five or more years of participation.
4.5 The Characteristics of the Institutional Context of ECE Provision
All the countries in our sample analysis provide full-time ECE provision. Two of them – the UK and Ireland – provide an additional part-time care option. Apart from those in Finland, Ireland, and the UK, children start primary school (ISCED-1) at age 6. Meanwhile, the average starting age for ISCED-0 is three years old. Children from Denmark and Finland can start earlier (0 years) but most do so at one year old. Those from Spain, Italy, and the UK can also start at 0 years, but usually do so at two years old. The variations in starting ages eventually lead to a range of 1 (e.g. Greece and Ireland) to 5–6 (e.g. Denmark and Finland) years of ECE attendance, but most eventually spend three years (OECD 2016). The structures of ECE settings also differ in terms of organisation and governance and can be classified as either unitary or separate (European Commission/EACEA/Eurydice 2019). Figure 3 shows a map of the EU-15 countries with its corresponding theoretical duration of ECE (top line) and the official starting age to pre-primary education (bottom line), by unitary and separate (italicised text) settings.
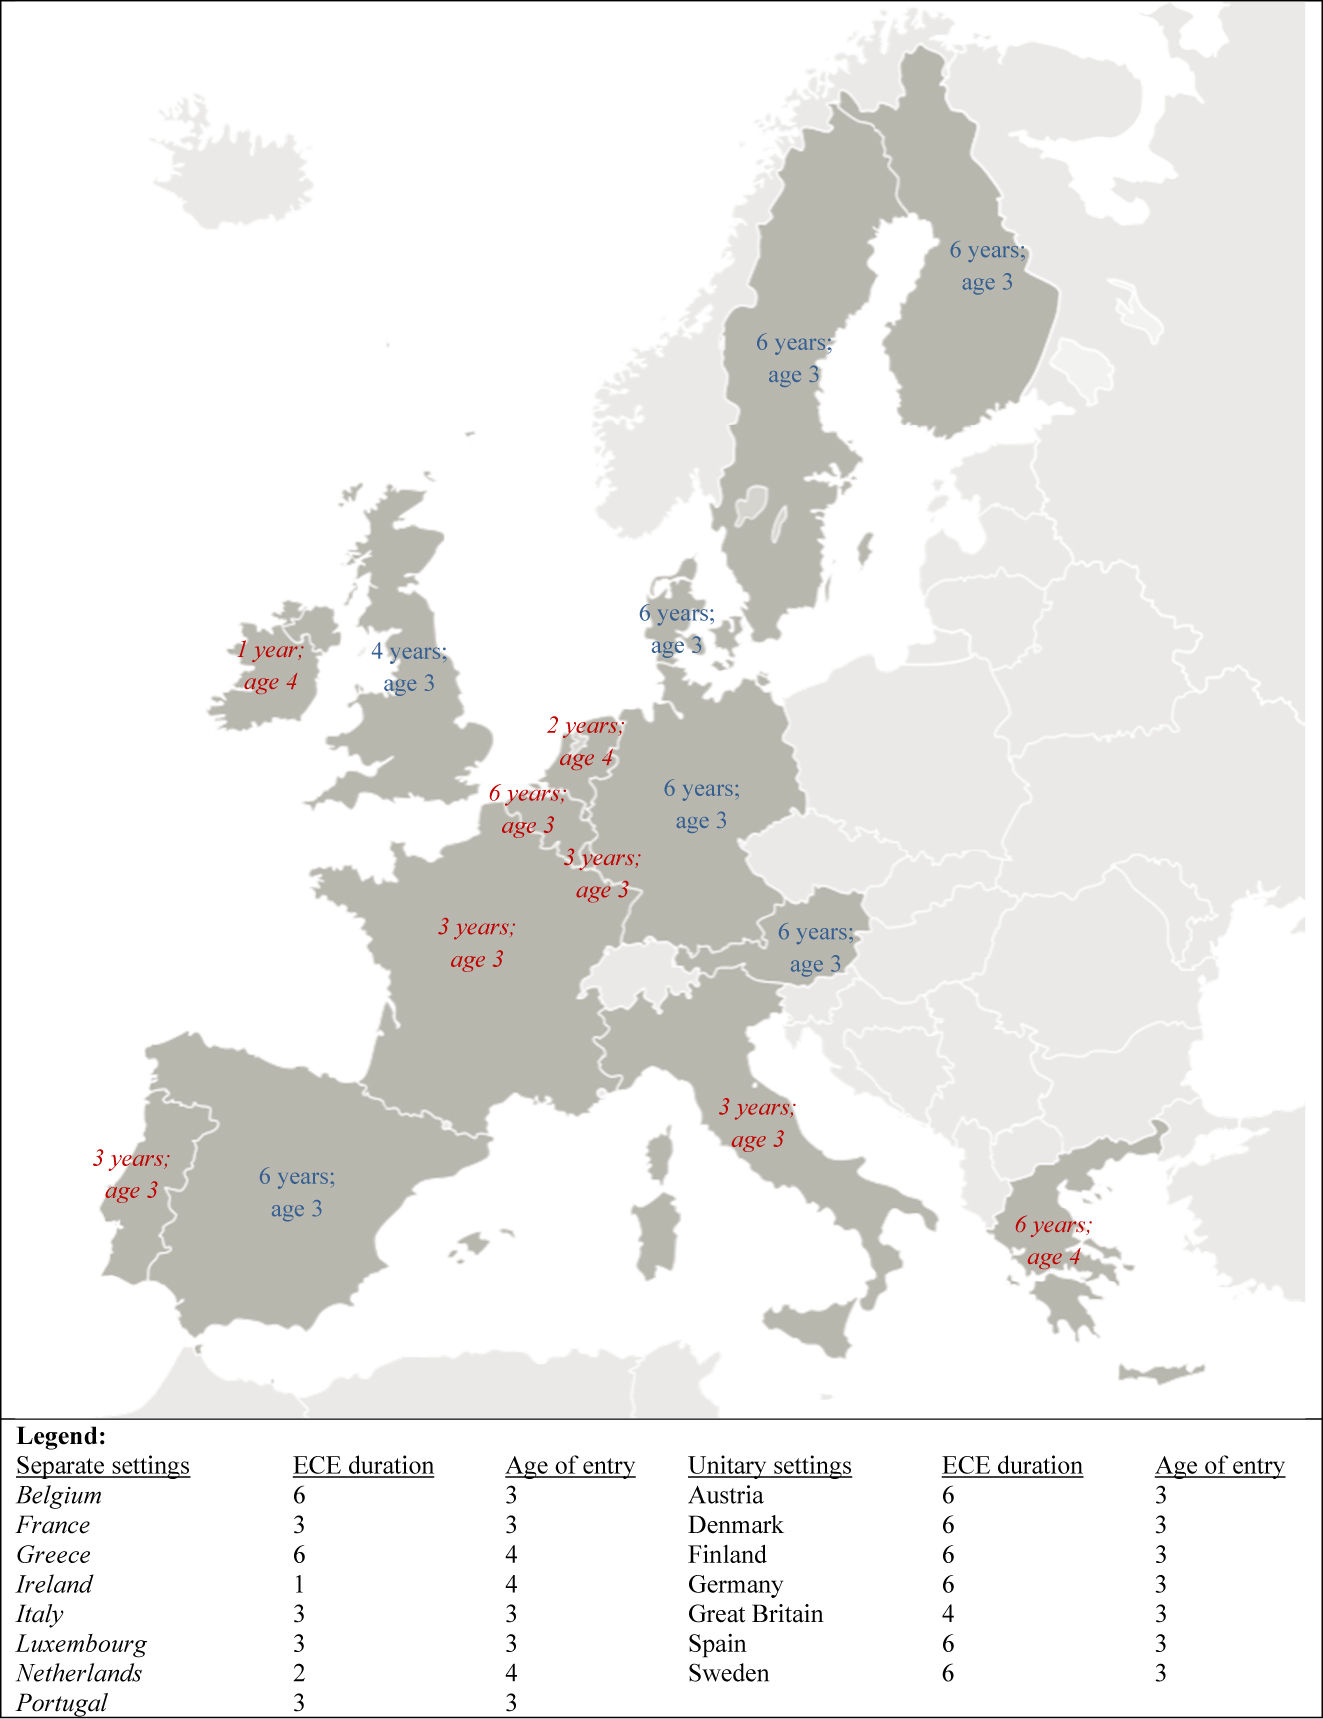
Theoretical duration of ECE and official starting age to pre-primary among EU-15. Note: This figure maps the EU-15 countries and the corresponding theoretical duration of ECE (on the first line) and official starting ages to pre-primary school (on the second line) as reported by UIS UNESCO. Text in italics indicate countries with separate ECE settings: Belgium, France, Greece, Ireland, Italy, Luxembourg, Netherlands, and Portugal. The rest are countries with unitary ECE settings: Austria, Denmark, Finland, Germany, Great Britain, Spain, and Sweden.
The service provided by the separate setting system focuses on (non-educational) childcare for younger children, usually until the age of 3, before transitioning older children to a pre-primary school set-up with educational goals. Unitary settings, on the other hand, cover the entire age range until the start of primary schooling, and include both care and early education. With a unitary setting, governance falls under a single entity, usually the Ministry of Education, though other rules and conditions may also apply. Separate settings are instead governed by multiple authorities, creating disparities in provision in terms of access, legal entitlement, and staff qualifications (Vandenbroeck, Lenaerts, and Beblavy 2018). The lack of continuity evident in separate settings also affects the quality of programming and may disrupt students’ learning (Kaga, Bennett, and Moss 2010). One can view the separate setting as corresponding to the ISCED-01 and ISCED-02 system described above.
While separate systems are prevalent in Europe, as reported by Bertram and Pascal (2016), some countries like Austria, Denmark, Germany, and Spain, commonly have both types of systems. There is a recent trend in countries with separate settings to move towards a unitary model, with the aim of providing a more coherent and higher-quality programme that is also more universal and affordable (Bennett 2008).
We followed the grouping by Eurydice (European Commission, EACEA, Eurydice and Eurostat 2014), and distinguished between the unitary/mixed and separate/split systems. Countries with separate ECE settings include Belgium, France, Greece, Ireland, Italy, Luxembourg, Netherlands, and Portugal. The others (Austria, Denmark, Finland, Germany, Sweden, and UK) have either unitary or mixed settings. We then performed analyses similar to those above to investigate whether the impact of ECE duration differs according to the type of institutional setting.
We ran a regression model with all the covariates interacted with a dummy variable indicating whether the ECE setting is separate or unitary/mixed. The p-values resulting from the Wald tests on the different groups of variables all indicate statistical significance, showing differences between the two institutional settings in how ECE duration affects the assessment outcomes of 15-year-olds. Given these results, Figure 4A–4C (based on Table A13) plot the estimated coefficients of the ECE variables differentiating between unitary and separate settings. The magnitudes indicate a similar “peak” at three to less than four years of attendance. This is true for both ECE settings and for all three outcomes. Comparing the unitary and separate systems, it can be noticed that having attended ECE in a separate setting corresponds to greater magnitudes of the estimated coefficients, resulting in a stronger impact on test outcomes than having attended ECE in a unitary setting. However, this is only true up to three to less than four years of attendance, which is also the maximum effect. In the unitary ECE setting instead, the magnitudes for the unitary ECE setting parameters are greater after four or more years, implying an inflection point at the maximum. Considering the educational component related to the different ECE settings, we do not find our results overly surprising. While a unitary setting shows smaller magnitudes, the positive effects are consistently evident in all years, with the exception of five or more years of ECE participation for science. Meanwhile, a separate setting proves to be advantageous up until less than five years of ECE attendance, with the magnitudes for four to less than five years of attendance are comparable to those of one to less than two years. These results indicate that the strongest benefits provided by the educational component in unitary settings occur during the first two years of ECE.
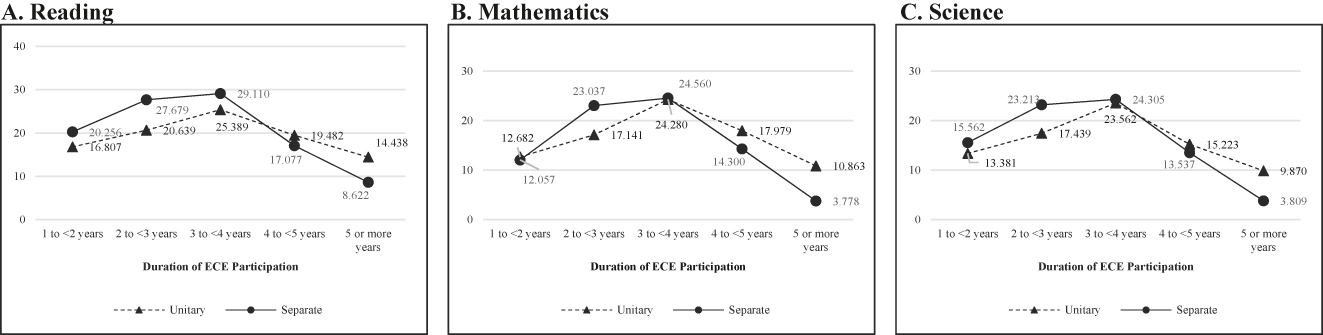
Duration of ECE participation and test scores, by ECE institutional setting. Note: The graphs plot the estimated coefficients of the duration of ECE participation for reading (pv1read), mathematics (pv1math), and science (pv1scie) assessment scores referring to unitary and separate ECE settings. See Table A13 in the Appendix for the numerical figures. Full regression results are shown in Table A12 in the Appendix.
In our sample, the average age of entry in separate ECE settings is higher at 3.133 years old, which is slightly higher than the average of 2.928 years old in unitary ECE settings. A t-test reveals that this 2.5-month difference is statistically significant. Our results showed that for both settings, the highest positive gain is seen at three to less than four years of ECE duration, with the separate setting yielding higher positive gains than the unitary setting, but the reverse is seen for four years or more. We surmise that the resulting pattern is driven by the preschool. This is corroborated by our findings on heterogeneity with age of entry, wherein the largest positive gain was seen with starting ECE at three years old and having a duration of two to less than three years.
To test for the robustness of our results, we performed estimations using the other available plausible values in the PISA data as dependent variables. This is in line with Rivkin and Schiman (2015), “To estimate regression using plausible values, one must estimate separate regression with each of the five [ten] plausible values and then average across the estimates. See Adams and Wu (2002) for a detailed description of plausible values. Practically speaking, however, estimates from larger samples will be very similar regardless of which plausible value is used.” Jerrim et al. (2017) replicated Lavy (2015) and showed that using one plausible value yields results similar to when using all plausible values. Indeed, we obtained similar nonlinear partial effects in the duration of ECE attendance. We also get similar results in the heterogeneity patterns. This confirms that estimates will be similar using other plausible values, so long as the sample is large. We also estimated the models excluding students who are first-generation migrants, given that we do not have information on where they attended ECE (i.e. in the current country or the country of origin). Again, the results we obtained are similar.
5 Conclusions
Supporting early childcare availability and attendance is considered one of the most effective policies for promoting the development of children’s human capital and reducing socio-economic disparities. Our study provides new insights into this important issue. We provide new evidence on the link between duration of early childcare attendance and later cognitive outcomes. More specifically, we exploit PISA data 2015 and 2018 waves to explore the long-term effects of ECE by looking at assessment of reading, mathematics, and science skills measured at 15 years of age. We estimate the partial effects of years of attendance of ECE within a very broad specification in which we control for a number of fixed effects and include a rich set of student- and household-specific covariates. We document statistically significant positive non-constant partial effects of ECE duration on test outcomes, which peak at three to less than four years of participation. We investigate duration effects across age of entry and show that starting at two years old and participating for three to less than four years yield the highest magnitude of increase in the assessment score. Similarly, we find heterogeneity across mother’s education, where the link between ECE duration and student outcomes are significantly higher for the high-educated mothers. We don’t find any heterogeneous effect of ECE duration on later outcomes across gender and migration background. Finally, we explore the role of different institutional characteristics of the ECE system, and find that separate settings provide the strongest benefits until three to less than four years of ECE, whereas the unitary settings provide the stronger benefit for longer duration periods of ECE attendance, specifically for four years or more. Our results have potential implications to inform policies relating to investment in early education, especially in terms of the duration of ECE provision, and the educational and schooling components associated with it.
Full regression results for reading.
| VARIABLES | Reading | |||||
|---|---|---|---|---|---|---|
| (1) | (2) | (3) | (4) | (5) | (6) | |
| ECE: 1 to <2 years | 32.746a | 27.015a | 21.984a | 19.070a | 19.176a | 16.085a |
| (3.169) | (2.343) | (2.472) | (2.120) | (2.143) | (1.581) | |
| ECE: 2 to <3 years | 44.556a | 37.452a | 29.318a | 24.938a | 24.741a | 20.519a |
| (4.794) | (3.881) | (3.652) | (3.520) | (3.532) | (1.523) | |
| ECE: 3 to <4 years | 53.756a | 44.352a | 33.863a | 27.950a | 27.613a | 23.818a |
| (4.698) | (3.791) | (4.013) | (3.735) | (3.801) | (1.499) | |
| ECE: 4 to <5 years | 46.042a | 37.105a | 24.988a | 19.750a | 18.948a | 17.105a |
| (4.074) | (3.480) | (3.353) | (3.105) | (3.169) | (1.603) | |
| ECE: 5 or more years | 39.469a | 30.265a | 18.151a | 14.200b | 13.227b | 12.780a |
| (6.400) | (6.015) | (5.046) | (4.856) | (4.775) | (1.869) | |
| Age | 18.001a | 18.162a | 16.847a | 16.539a | 14.855a | |
| (1.329) | (1.329) | (1.390) | (1.351) | (0.838) | ||
| Female | 22.615a | 23.594a | 20.221a | 20.126a | 17.320a | |
| (2.334) | (2.368) | (2.217) | (2.208) | (0.528) | ||
| First-generation migrant | −39.882a | −27.473a | −6.724c | −9.409b | −8.642a | |
| (5.416) | (4.432) | (3.648) | (4.232) | (1.465) | ||
| Second-generation migrant | −31.159a | −15.379a | −1.551 | −4.559 | −4.587a | |
| (5.142) | (3.174) | (3.105) | (3.199) | (1.180) | ||
| Mother’s education: ISCED-3, 4 | 14.479a | 8.650a | 8.426a | 4.8889a | ||
| (1.826) | (1.446) | (1.649) | (0.779) | |||
| Mother’s education: ISCED-5, 6 | 11.678a | 2.453c | 1.887 | −0.911 | ||
| (1.915) | (1.342) | (1.357) | (0.799) | |||
| Father’s education: ISCED-3, 4 | 9.221a | 5.513a | 4.934a | 2.444a | ||
| (1.172) | (1.077) | (1.232) | (0.733) | |||
| Father’s education: ISCED-5, 6 | 8.856a | 2.089 | 0.763 | −1.946a | ||
| (1.776) | (1.436) | (1.347) | (0.730) | |||
| Highest parental occupation status | 1.112a | 0.761a | 0.699a | 0.452a | ||
| (0.085) | (0.055) | (0.047) | (0.014) | |||
| 11–25 books at home | 27.653a | 27.230a | 18.191a | |||
| (1.441) | (1.277) | (0.927) | ||||
| 26–100 books at home | 53.630a | 53.030a | 37.484a | |||
| (2.079) | (1.962) | (0.895) | ||||
| 101–200 books at home | 71.105a | 70.010a | 50.814a | |||
| (2.467) | (2.410) | (0.990) | ||||
| 201–500 books at home | 89.280a | 87.638a | 64.665a | |||
| (3.369) | (3.128) | (1.055) | ||||
| More than 500 books at home | 89.901a | 88.262a | 65.273a | |||
| (4.724) | (4.453) | (1.284) | ||||
| Same language at home and test | 17.600a | 15.742a | 13.802a | |||
| (3.732) | (4.026) | (1.031) | ||||
| School size | 0.009b | |||||
| (0.004) | ||||||
| Public school | 0.412 | |||||
| (3.174) | ||||||
| Share of funding from government | −0.132b | |||||
| (0.051) | ||||||
| Proportion of fully certified teachers | 9.996c | |||||
| (5.403) | ||||||
| School community in a small town | 6.161c | |||||
| (3.153) | ||||||
| School community in a town | 10.968a | |||||
| (3.608) | ||||||
| School community in a city | 16.418a | |||||
| (4.590) | ||||||
| School community in a large city | 15.851b | |||||
| (5.572) | ||||||
| Constant | 445.956a | 163.608a | 94.526a | 76.322b | 73.787b | 163.568a |
| (3.683) | (20.128) | (23.991) | (26.509) | (26.656) | (13.377) | |
| Country, year FE | Y | Y | Y | Y | Y | Y |
| Country-by-year FE | Y | Y | Y | Y | Y | Y |
| School FE | Y | |||||
| Observations | 109,012 | 109,012 | 109,012 | 109,012 | 109,012 | 109,012 |
| R-squared | 0.017 | 0.049 | 0.136 | 0.212 | 0.220 | 0.112 |
| Number of countries | 14 | 14 | 14 | 14 | 14 | |
| Number of schools | 4983 | |||||
-
Note: This table reports the estimated coefficients for regressions on the reading test (pv1read) as the dependent variable. Column 1 shows the results for estimation controlling for country, year, and country-by-year fixed Effects. Column 2 additionally includes student characteristics: age, gender, and migration background. Column 3 additionally includes parents’ characteristics: mother’s education, father’s education, and highest parental ISEI. Column 4 additionally includes home environment: the number of books and the language spoken at home. Column 5 additionally includes school characteristics: school size, public/private school, share of funding from the government, proportion of fully certified teachers, and school location. Column 6 implements a school fixed effects estimation. Robust standard errors are clustered (Columns 1–5 by country, Column 6 by school) in parentheses. a p < 0.01, b p < 0.05, c p < 0.10.
Full regression results for mathematics.
| VARIABLES | Math | |||||
|---|---|---|---|---|---|---|
| (1) | (2) | (3) | (4) | (5) | (6) | |
| ECE: 1 to <2 years | 24.379a | 20.080a | 15.025a | 12.645a | 12.701a | 10.465a |
| (1.890) | (1.353) | (1.451) | (1.215) | (1.095) | (1.454) | |
| ECE: 2 to <3 years | 37.615a | 32.411a | 24.288a | 20.485a | 20.383a | 16.692a |
| (3.508) | (3.106) | (2.929) | (2.896) | (2.849) | (1.374) | |
| ECE: 3 to <4 years | 46.459a | 40.364a | 29.904a | 24.731a | 24.419a | 20.681a |
| (3.485) | (2.761) | (2.867) | (2.738) | (2.769) | (1.367) | |
| ECE: 4 to <5 years | 39.364a | 33.784a | 21.666a | 17.062a | 16.319a | 13.753a |
| (3.673) | (3.044) | (2.698) | (2.494) | (2.512) | (1.475) | |
| ECE: 5 or more years | 30.144a | 24.827a | 12.691b | 9.212b | 8.477c | 7.628a |
| (5.499) | (5.584) | (4.314) | (4.161) | (4.118) | (1.720) | |
| Age | 17.225a | 17.427a | 16.207a | 15.952a | 14.251a | |
| (1.319) | (1.177) | (1.323) | (1.291) | (0.792) | ||
| Female | −12.619a | −11.638a | −14.698a | −14.786a | −15.954a | |
| (1.731) | (1.834) | (1.673) | (1.650) | (0.486) | ||
| First-generation migrant | −37.476a | −25.263a | −8.743b | −10.696a | −8.939a | |
| (5.320) | (4.143) | (3.071) | (2.797) | (1.306) | ||
| Second-generation migrant | −32.808a | −17.105a | −6.280b | −8.377a | −7.513a | |
| (5.189) | (3.475) | (2.480) | (2.486) | (1.074) | ||
| Mother’s education: ISCED-3, 4 | 15.142a | 9.806a | 9.576a | 5.318a | ||
| (1.579) | (1.184) | (1.304) | (0.747) | |||
| Mother’s education: ISCED-5, 6 | 13.338a | 4.847a | 4.268a | 0.863 | ||
| (1.621) | (1.338) | (1.191) | (0.777) | |||
| Father’s education: ISCED-3, 4 | 10.139a | 6.678a | 6.187a | 3.163a | ||
| (0.858) | (0.722) | (0.794) | (0.693) | |||
| Father’s education: ISCED-5, 6 | 10.258a | 4.027b | 2.861c | −0.149 | ||
| (1.743) | (1.648) | (1.596) | (0.704) | |||
| Highest parental occupation status | 1.072a | 0.752a | 0.695a | 0.460a | ||
| (0.064) | (0.038) | (0.037) | (0.013) | |||
| 11–25 books at home | 24.580a | 24.108a | 15.366a | |||
| (1.729) | (1.628) | (0.907) | ||||
| 26–100 books at home | 50.053a | 49.329a | 34.109a | |||
| (2.246) | (2.222) | (0.852) | ||||
| 101–200 books at home | 66.932a | 65.671a | 46.515a | |||
| (1.990) | (1.943) | (0.957) | ||||
| 201–500 books at home | 81.175a | 79.402a | 56.803a | |||
| (2.518) | (2.256) | (1.003) | ||||
| More than 500 books at home | 83.239a | 81.462a | 58.115a | |||
| (3.620) | (3.488) | (1.204) | ||||
| Same language at home and test | 9.020b | 7.117 | 6.934a | |||
| (3.682) | (4.177) | (0.920) | ||||
| School size | 0.010a | |||||
| (0.003) | ||||||
| Public school | −2.712 | |||||
| (3.333) | ||||||
| Share of funding from government | −0.167b | |||||
| (0.063) | ||||||
| Proportion of fully certified teachers | 8.098 | |||||
| (4.751) | ||||||
| School community in a small town | 4.832c | |||||
| (2.280) | ||||||
| School community in a town | 5.199c | |||||
| (2.833) | ||||||
| School community in a city | 8.937b | |||||
| (3.375) | ||||||
| School community in a large city | 8.169c | |||||
| (4.332) | ||||||
| Constant | 453.064a | 198.430a | 128.773a | 117.964a | 126.204a | 201.704a |
| (2.464) | (20.544) | (20.529) | (23.850) | (26.170) | (12.646) | |
| Country, year FE | Y | Y | Y | Y | Y | Y |
| Country-by-year FE | Y | Y | Y | Y | Y | Y |
| School FE | Y | |||||
| Observations | 109,012 | 109,012 | 109,012 | 109,012 | 109,012 | 109,012 |
| R-squared | 0.014 | 0.038 | 0.135 | 0.208 | 0.215 | 0.107 |
| Number of countries | 14 | 14 | 14 | 14 | 14 | |
| Number of schools | 4983 | |||||
-
Note: This table reports the estimated coefficients for regressions on the mathematics test (pv1math) as the dependent variable. Column 1 shows the results for estimation controlling for country, year, and country-by-year fixed Effects. Column 2 additionally includes student characteristics: age, gender, and migration background. Column 3 additionally includes parents’ characteristics: mother’s education, father’s education, and highest parental ISEI. Column 4 additionally includes home environment: the number of books and the language spoken at home. Column 5 additionally includes school characteristics: school size, public/private school, share of funding from the government, proportion of fully certified teachers, and school location. Column 6 implements a school fixed effects estimation. Robust standard errors are clustered (Columns 1–5 by country, Column 6 by school) in parentheses. a p < 0.01, b p < 0.05, c p < 0.10.
Full regression results for science.
| VARIABLES | Science | |||||
|---|---|---|---|---|---|---|
| (1) | (2) | (3) | (4) | (5) | (6) | |
| ECE: 1 to <2 years | 27.260a | 22.528a | 17.457a | 14.784a | 14.793a | 11.988a |
| (2.689) | (2.220) | (2.304) | (1.960) | (1.967) | (1.531) | |
| ECE: 2 to <3 years | 38.944a | 33.196a | 25.009a | 20.818a | 20.683a | 16.590a |
| (4.613) | (3.964) | (3.748) | (3.549) | (3.550) | (1.445) | |
| ECE: 3 to <4 years | 47.462a | 40.504a | 29.951a | 24.228a | 23.929a | 19.908a |
| (4.746) | (4.177) | (4.208) | (3.747) | (3.822) | (1.426) | |
| ECE: 4 to <5 years | 38.951a | 32.502a | 20.266a | 15.183a | 14.555a | 12.394a |
| (3.972) | (3.518) | (3.229) | (2.935) | (3.034) | (1.535) | |
| ECE: 5 or more years | 30.899a | 24.663a | 12.398b | 8.574c | 7.909 | 6.928a |
| (5.871) | (5.857) | (4.781) | (4.603) | (4.597) | (1.829) | |
| Age | 16.503a | 16.719a | 15.362a | 15.135a | 13.258a | |
| (1.515) | (1.461) | (1.614) | (1.571) | (0.823) | ||
| Female | −4.941b | −3.942 | −7.318a | −7.408a | −8.611a | |
| (2.208) | (2.339) | (2.097) | (2.088) | (0.521) | ||
| First-generation migrant | −38.791a | −26.481a | −7.482c | −9.170c | −7.663a | |
| (5.441) | (4.240) | (3.962) | (4.596) | (1.404) | ||
| Second-generation migrant | −36.421a | −20.576a | −7.998b | −9.820b | −9.018a | |
| (5.570) | (3.664) | (3.490) | (3.795) | (1.160) | ||
| Mother’s education: ISCED-3, 4 | 14.581a | 8.744a | 8.555a | 4.810a | ||
| (1.587) | (1.328) | (1.416) | (0.760) | |||
| Mother’s education: ISCED-5, 6 | 13.248a | 3.910a | 3.446b | 0.656 | ||
| (1.717) | (1.231) | (1.167) | (0.794) | |||
| Father’s education: ISCED-3, 4 | 9.953a | 6.180a | 5.750a | 2.791a | ||
| (1.052) | (0.929) | (1.042) | (0.720) | |||
| Father’s education: ISCED-5, 6 | 10.503a | 3.620b | 2.645c | −0.347 | ||
| (1.856) | (1.440) | (1.328) | (0.726) | |||
| Highest parental occupation status | 1.084a | 0.730a | 0.682a | 0.450a | ||
| (0.082) | (0.052) | (0.045) | (0.014) | |||
| 11–25 books at home | 25.749a | 25.308a | 16.328a | |||
| (1.558) | (1.375) | (0.920) | ||||
| 26–100 books at home | 53.139a | 52.489a | 36.961a | |||
| (2.090) | (1.962) | (0.881) | ||||
| 101–200 books at home | 72.253a | 71.179a | 51.761a | |||
| (2.655) | (2.664) | (0.982) | ||||
| 201–500 books at home | 89.271a | 87.789a | 64.249a | |||
| (3.836) | (3.532) | (1.032) | ||||
| More than 500 books at home | 90.191a | 88.739a | 64.962a | |||
| (4.877) | (4.591) | (1.272) | ||||
| Same language at home and test | 12.3937b | 10.769c | 10.794a | |||
| (4.530) | (5.095) | (0.995) | ||||
| School size | 0.009b | |||||
| (0.004) | ||||||
| Public school | −2.274 | |||||
| (4.077) | ||||||
| Share of funding from government | −0.114c | |||||
| (0.057) | ||||||
| Proportion of fully certified teachers | 9.274c | |||||
| (4.627) | ||||||
| School community in a small town | 3.410 | |||||
| (2.619) | ||||||
| School community in a town | 4.827 | |||||
| (3.202) | ||||||
| School community in a city | 7.865c | |||||
| (4.134) | ||||||
| School community in a large city | 6.591 | |||||
| (4.730) | ||||||
| Constant | 465.273a | 219.030a | 148.745a | 136.196a | 138.589a | 207.848a |
| (3.594) | (24.007) | (26.289) | (28.968) | (29.611) | (13.142) | |
| Country, year FE | Y | Y | Y | Y | Y | Y |
| Country-by-year FE | Y | Y | Y | Y | Y | Y |
| School FE | Y | |||||
| Observations | 109,012 | 109,012 | 109,012 | 109,012 | 109,012 | 109,012 |
| R-squared | 0.014 | 0.034 | 0.126 | 0.207 | 0.212 | 0.106 |
| Number of countries | 14 | 14 | 14 | 14 | 14 | |
| Number of schools | 4983 | |||||
-
Note: This table reports the estimated coefficients for regressions on the science test (pv1scie) as the dependent variable. Column 1 shows the results for estimation controlling for country, year, and country-by-year fixed Effects. Column 2 additionally includes student characteristics: age, gender, and migration background. Column 3 additionally includes parents’ characteristics: mother’s education, father’s education, and highest parental ISEI. Column 4 additionally includes home environment: the number of books and the language spoken at home. Column 5 additionally includes school characteristics: school size, public/private school, share of funding from the government, proportion of fully certified teachers, and school location. Column 6 implements a school fixed effects estimation. Robust standard errors are clustered (Columns 1–5 by country, Column 6 by school) in parentheses. a p < 0.01, b p < 0.05, c p < 0.10.
Distribution of age of entry to ECE and duration of ECE participation.
| Age of entry to ECE | Duration of ECE participation | ||||||
|---|---|---|---|---|---|---|---|
| 0 | 1 to <2 years | 2 to <3 years | 3 to <4 years | 4 to <5 years | 5 years or more | Total | |
| Did not attend ECE | 1959 | 0 | 0 | 0 | 0 | 0 | 1959 |
| % | 1.800 % | 0 % | 0 % | 0 % | 0 % | 0 % | 1.800 % |
| 1 year or younger | 0 | 0 | 274 | 703 | 1629 | 3242 | 5848 |
| % | 0 % | 0 % | 0.251 % | 0.645 % | 1.474 % | 2.974 % | 5.365 % |
| 2 years old | 0 | 271 | 2168 | 7411 | 7841 | 1,648 | 19,339 |
| % | 0 % | 0.249 % | 1.989 % | 6.798 % | 7.193 % | 1.512 % | 17.740 % |
| 3 years old | 0 | 3273 | 9,970 | 35,522 | 3732 | 378 | 52,875 |
| % | 0 % | 3.002 % | 9.146 % | 32.585 % | 3.423 % | 0.347 % | 48.504 % |
| 4 years old | 0 | 3,635 | 10,898 | 3297 | 210 | 101 | 18,141 |
| % | 0 % | 3.334 % | 10.000 % | 3.024 % | 0.193 % | 0.093 % | 16.641 % |
| 5 years or older | 0 | 7109 | 2999 | 594 | 148 | 0 | 10,850 |
| % | 0 % | 6.521 % | 2.751 % | 0.525 % | 0.136 % | 0 % | 9.953 % |
| Total | 1959 | 14,288 | 26,309 | 47,527 | 13,560 | 5369 | 109,012 |
| 1.800 % | 13.107 % | 24.134 % | 43.600 % | 12.439 % | 4.925 % | 100 % | |
-
Note: This table shows the distribution of duration of ECE participation with the age of entry to ECE. Among the 109,012 students, 1959 or 1.8 % did not attend ECE, while 35,522 or 32.6 % attended for 3 to <4 years and started at three years old.
Full regression results for a model interacted with age of entry to ECE.
| VARIABLES | (1) | (2) | (3) |
|---|---|---|---|
| Reading | Mathematics | Science | |
| Age of entry: 2 years old | −40.776a | −35.710a | −41.543a |
| (8.386) | (8.141) | (7.788) | |
| Age of entry: 3 years old | −24.768a | −22.884a | −30.084a |
| (7.226) | (7.188) | (6.744) | |
| Age of entry: 4 years old | −23.162a | −25.816a | −26.928a |
| (7.184) | (7.142) | (6.677) | |
| Age of entry: 5 years or older | −35.172a | −37.179a | −38.341a |
| (6.928) | (6.976) | (6.451) | |
| ECE: 2 to <3 years | −53.170a | −43.589a | −51.443a |
| (8.506) | (8.223) | (7.998) | |
| ECE: 3 to <4 years | −31.116a | −32.514a | −40.773a |
| (7.734) | (7.651) | (7.254) | |
| ECE: 4 to <5 years | −20.056a | −18.825a | −25.121a |
| (6.781) | (6.822) | (6.240) | |
| ECE: 5 or more years | −24.622a | −24.391a | −29.670a |
| (7.194) | (7.182) | (6.704) | |
| Age of entry: 2 years old × ECE: 2 to <3 years | 71.374a | 55.636a | 64.277a |
| (9.970) | (9.530) | (9.498) | |
| Age of entry: 2 years old × ECE: 3 to <4 years | 60.926a | 59.646a | 65.819a |
| (9.021) | (8.750) | (8.473) | |
| Age of entry: 2 years old × ECE: 4 to <5 years | 39.273a | 34.803a | 40.544a |
| (8.249) | (8.012) | (7.608) | |
| Age of entry: 2 years old × ECE: 5 or more years | 32.826a | 25.021a | 32.430a |
| (8.759) | (8.489) | (8.203) | |
| Age of entry: 3 years old × ECE: 2 to <3 years | 59.842a | 49.550a | 59.574a |
| (8.736) | (8.410) | (8.262) | |
| Age of entry: 3 years old × ECE: 3 to <4 years | 39.924a | 40.277a | 51.547a |
| (8.009) | (7.837) | (7.539) | |
| Age of entry: 3 years old × ECE: 4 to <5 years | 15.012b | 9.647 | 20.434a |
| (7.176) | (7.090) | (6.621) | |
| Age of entry: 3 years old × ECE: 5 or more years | −7.602 | −18.990b | −7.426 |
| (8.402) | (8.287) | (7.947) | |
| Age of entry: 4 years old × ECE: 2 to <3 years | 56.564a | 49.261a | 54.821a |
| (8.656) | (8.345) | (8.156) | |
| Age of entry: 4 years old × ECE: 3 to <4 years | 22.019a | 24.533a | 30.503a |
| (8.026) | (7.871) | (7.545) | |
| Age of entry: 4 years old × ECE: 4 to <5 years | −16.199c | −16.488c | −9.873 |
| (8.942) | (8.747) | (8.372) | |
| Age of entry: 4 years old × ECE: 5 or more years | −20.461b | −28.503a | −21.843b |
| (9.359) | (9.805) | (9.402) | |
| Age of entry: 5 years or older × ECE: 2 to <3 years | 52.320a | 42.281a | 48.949a |
| (8.514) | (8.221) | (8.021) | |
| Age of entry: 5 years or older × ECE: 3 to <4 years | 5.163 | 7.020 | 14.638c |
| (8.244) | (8.056) | (7.736) | |
| Age | 15.802a | 15.398a | 13.862a |
| (0.849) | (0.800) | (0.835) | |
| Female | 16.948a | −16.438a | −9.068a |
| (0.530) | (0.488) | (0.522) | |
| First-generation migrant | −7.061a | −7.224a | −6.003a |
| (1.503) | (1.351) | (1.428) | |
| Second-generation migrant | −4.168a | −7.233a | −8.795a |
| (1.182) | (1.083) | (1.168) | |
| Mother’s education: ISCED-3, 4 | 4.820a | 5.280a | 4.869a |
| (0.785) | (0.745) | (0.764) | |
| Mother’s education: ISCED-5, 6 | −0.768 | 0.913 | 0.843 |
| (0.804) | (0.776) | (0.796) | |
| Father’s education: ISCED-3, 4 | 2.492a | 3.169a | 2.746a |
| (0.734) | (0.693) | (0.721) | |
| Father’s education: ISCED-5, 6 | −1.792b | 0.176 | −0.199 |
| (0.735) | (0.706) | (0.731) | |
| Highest parental occupation status | 0.446a | 0.451a | 0.442a |
| (0.014) | (0.013) | (0.014) | |
| 11–25 books at home | 18.065a | 15.266a | 16.371a |
| (0.940) | (0.915) | (0.930) | |
| 26–100 books at home | 37.086a | 33.652a | 36.653a |
| (0.902) | (0.857) | (0.886) | |
| 101–200 books at home | 50.389a | 45.831a | 51.373a |
| (0.997) | (0.959) | (0.986) | |
| 201–500 books at home | 63.992a | 55.902a | 63.658a |
| (1.065) | (1.010) | (1.040) | |
| More than 500 books at home | 65.148a | 57.557a | 64.917a |
| (1.291) | (1.210) | (1.277) | |
| Same language at home and test | 13.392a | 6.499a | 10.375a |
| (1.019) | (0.906) | (0.984) | |
| Constant | 191.296a | 222.731a | 241.149a |
| (15.380) | (14.481) | (14.885) | |
| Country, year FE | Y | Y | Y |
| Country-by-year FE | Y | Y | Y |
| School FE | Y | Y | Y |
| Observations | 107,053 | 107,053 | 107,053 |
| R-squared | 0.117 | 0.115 | 0.113 |
| Number of school | 4976 | 4976 | 4976 |
-
Note: This table reports the estimated coefficients for regressions on a model applying school fixed effects with the variables interacted with the age of entry to ECE. Column 1 shows the results for the reading (pv1read) score, column 2 shows the results for mathematics (pv1math), and column 3 shows the results for science (pv1scie) test score. Robust standard errors are clustered by school in parentheses. a p < 0.01, b p < 0.05, c p < 0.10.
Marginal effects of ECE duration by different starting ages.
| Reading | Mathematics | Science | ||
|---|---|---|---|---|
| dy/dx | dy/dx | dy/dx | ||
| (std. err.) | (std. err.) | (std. err.) | ||
| Age of entry: 1 year or younger | (base) | (base) | (base) | |
| Age of entry: 2 years old | ||||
| Duration of ECE | ||||
| 0 to <2 years | . | . | . | |
| 2 to <3 years | 30.598a | 19.926a | 22.734a | |
| (5.066) | (4.602) | (4.953) | ||
| 3 to <4 years | 20.150a | 23.936a | 24.276a | |
| (3.361) | (3.160) | (3.348) | ||
| 4 to <5 years | −1.503 | −0.907 | −1.000 | |
| (2.183) | (2.021) | (2.141) | ||
| 5 or more years | −7.950a | −10.689a | −9.114a | |
| (2.433) | (2.262) | (2.464) | ||
| Age of entry: 3 years old | ||||
| Duration of ECE | ||||
| 0 to <2 years | . | . | . | |
| 2 to <3 years | 35.074a | 26.666a | 29.490a | |
| (4.848) | (4.340) | (4.740) | ||
| 3 to <4 years | 15.156a | 17.393a | 21.463a | |
| (3.289) | (3.097) | (3.282) | ||
| 4 to <5 years | −9.756a | −13.237a | −9.650a | |
| (2.415) | (2.272) | (2.391) | ||
| 5 or more years | −32.369a | −41.874a | −37.510a | |
| (4.339) | (4.0312) | (4.282) | ||
| Age of entry: 4 years old | ||||
| Duration of ECE | ||||
| 0 to <2 years | . | . | . | |
| 2 to <3 years | 33.403a | 23.445a | 27.893a | |
| (4.831) | (4.341) | (4.722) | ||
| 3 to <4 years | −1.143 | −1.283 | 3.575 | |
| (3.559) | 3.362a | (3.537) | ||
| 4 to <5 years | −39.361a | (-42.304) | −36.801a | |
| (5.900) | 5.641a | (5.785) | ||
| 5 or more years | −43.623a | −54.319a | −48.772a | |
| (6.472) | (6.925) | (6.799) | ||
| Age of entry: 5 years or older | ||||
| Duration of ECE | ||||
| 0 to <2 years | . | . | . | |
| 2 to <3 years | 17.148a | 5.102 | 10.608b | |
| (5.021) | (4.501) | (4.904) | ||
| 3 to <4 years | −30.009a | −30.160a | −23.702a | |
| (4.669) | (4.244) | (4.511) | ||
| 4 to <5 years | −35.171a | −37.179a | −38.341a | |
| (6.928) | (6.976) | (6.451) | ||
| 5 or more years | . | . | . | |
-
Note: This table reports the marginal effects of ECE duration by different starting ages, derived from linear combination results of the two variables interacted in the specification based of the school fixed effects model presented above. a p < 0.01, b p < 0.05, c p < 0.10.
Full regression results for high-educated-mother interacted model.
| VARIABLES | (1) | (2) | (3) |
|---|---|---|---|
| Reading | Math | Science | |
| ECE: 1 to <2 years | 16.635a | 10.846a | 11.117a |
| (2.242) | (1.453) | (2.385) | |
| ECE: 2 to <3 years | 24.250a | 19.617a | 18.279a |
| (3.655) | (3.471) | (4.051) | |
| ECE: 3 to <4 years | 26.040a | 22.475a | 20.633a |
| (3.731) | (3.067) | (3.779) | |
| ECE: 4 to <5 years | 15.567a | 12.535a | 10.141b |
| (3.817) | (3.503) | (3.576) | |
| ECE: 5 or more years | 7.156 | 0.594 | −0.779 |
| (4.658) | (4.693) | (4.670) | |
| High-educated mother | −49.856c | 2.774 | −4.512 |
| (24.463) | (19.224) | (22.947) | |
| ECE: 1 to <2 years × high-educated mother | 6.465b | 5.246c | 9.410a |
| (2.918) | (2.751) | (3.031) | |
| ECE: 2 to <3 years × high-educated mother | 1.905 | 2.540 | 6.284b |
| (2.308) | (2.779) | (2.394) | |
| ECE: 3 to <4 years × high-educated mother | 3.920 | 4.780c | 7.897b |
| (3.320) | (2.252) | (2.711) | |
| ECE: 4 to <5 years × high-educated mother | 7.722 | 8.638b | 10.439a |
| (4.401) | (3.519) | (3.406) | |
| ECE: 5 or more years × high-educated mother | 11.540b | 14.959a | 17.042a |
| (4.885) | (4.605) | (4.716) | |
| Age | 16.112a | 16.981a | 16.260a |
| (1.178) | (1.503) | (1.622) | |
| Age × high-educated mother | 0.485 | −2.323c | −2.545 |
| (1.624) | (1.285) | (1.671) | |
| Female | 17.732a | −16.921a | −9.832a |
| (1.627) | (1.545) | (1.418) | |
| Female × high-educated mother | 4.303b | 3.757b | 4.370b |
| (1.552) | (1.442) | (1.939) | |
| First-generation migrant | −11.658b | −14.299a | −13.224b |
| (4.183) | (1.725) | (4.479) | |
| Second-generation migrant | −5.430c | −9.988a | −11.582a |
| (3.011) | (2.246) | (3.591) | |
| First-generation migrant × high-educated mother | 3.907 | 6.444b | 7.406b |
| (3.512) | (2.774) | (2.860) | |
| Second-generation migrant × high-educated mother | 0.705 | 1.492 | 2.267 |
| (2.461) | (2.684) | (2.466) | |
| Father’s education: ISCED-3, 4 | 10.987a | 12.313a | 12.096a |
| (1.455) | (0.807) | (0.817) | |
| Father’s education: ISCED-5, 6 | 5.205a | 6.641b | 7.526a |
| (1.615) | (2.227) | (1.767) | |
| Father’s education: ISCED-3, 4 × high-educated mother | −6.210a | −6.274a | −7.855a |
| (1.337) | (1.389) | (1.454) | |
| Father’s education: ISCED-5, 6 × high-educated mother | −4.659 | −3.388 | −6.278c |
| (2.972) | (2.937) | (3.328) | |
| Highest parental occupation status | 0.584a | 0.570a | 0.578a |
| (0.062) | (0.052) | (0.058) | |
| Highest parental occupation status × high-educated mother | 0.227a | 0.251a | 0.208a |
| (0.040) | (0.032) | (0.042) | |
| 11–25 books at home | 25.961a | 23.696a | 24.641a |
| (1.394) | (2.113) | (1.424) | |
| 26–100 books at home | 51.338a | 48.432a | 51.444a |
| (1.775) | (2.313) | (2.026) | |
| 101–200 books at home | 67.355a | 63.611a | 69.528a |
| (2.326) | (2.503) | (2.917) | |
| 201–500 books at home | 82.995a | 75.930a | 83.351a |
| (3.113) | (2.517) | (3.541) | |
| More than 500 books at home | 74.006a | 69.707a | 75.070a |
| (3.896) | (3.525) | (4.263) | |
| 11–25 books at home × high-educated mother | 5.174a | 2.646 | 3.036 |
| (1.502) | (1.874) | (2.163) | |
| 26–100 books at home × high-educated mother | 7.345b | 5.054 | 4.976c |
| (2.828) | (3.034) | (2.566) | |
| 101–200 books at home × high-educated mother | 9.344a | 7.371b | 6.410c |
| (2.957) | (3.331) | (3.048) | |
| 201–500 books at home × high-educated mother | 11.748a | 8.837b | 10.160b |
| (3.220) | (3.568) | (3.421) | |
| More than 500 books at home × high-educated mother | 23.995a | 19.533a | 22.030a |
| (3.879) | (4.145) | (4.246) | |
| Same language at home and test | 11.584b | 2.871 | 6.101 |
| (4.250) | (4.781) | (5.602) | |
| Same language at home and test × high-educated mother | 9.417a | 9.795a | 10.554a |
| (2.236) | (2.761) | (2.897) | |
| School size | 0.011b | 0.011a | 0.100b |
| (0.004) | (0.003) | (0.004) | |
| School size × high-educated mother | −0.003 | −0.001 | −0.001 |
| (0.002) | (0.001) | (0.002) | |
| Public school | −1.385 | −3.390 | −4.239 |
| (3.147) | (3.421) | (4.085) | |
| Public school × high-educated mother | 2.830 | 1.502 | 3.270c |
| (1.778) | (1.768) | (1.699) | |
| Share of funding from government | −0.125c | −0.154c | −0.105 |
| (0.061) | (0.082) | (0.066) | |
| Share of funding from government × high-educated mother | −0.012 | −0.018 | −0.017 |
| (0.067) | (0.057) | (0.063) | |
| Proportion of fully-certified teachers | 7.550 | 5.854 | 7.597 |
| (5.443) | (5.101) | (4.561) | |
| Proportion of fully-certified teachers × high-educated mother | 4.367 | 4.309 | 3.006 |
| (4.703) | (3.476) | (3.474) | |
| School community in a small town | 7.600c | 6.292b | 3.999 |
| (3.942) | (2.888) | (3.315) | |
| School community in a town | 11.567b | 5.577 | 4.563 |
| (4.675) | (3.744) | (4.277) | |
| School community in a city | 15.965b | 9.042c | 7.131 |
| (6.276) | (4.629) | (5.764) | |
| School community in a large city | 15.548b | 7.020 | 5.366 |
| (5.775) | (4.933) | (5.111) | |
| School community in a small town × high-educated mother | −3.847 | −3.688 | −1.769 |
| (3.950) | (2.676) | (3.651) | |
| School community in a town × high-educated mother | −1.784 | −1.040 | 0.319 |
| (4.189) | (2.957) | (4.011) | |
| School community in a city × high-educated mother | −0.533 | −0.988 | 0.652 |
| (5.185) | (3.713) | (4.995) | |
| School community in a large city × high-educated mother | −0.442 | 1.417 | 1.854 |
| (3.615) | (2.900) | (3.391) | |
| Constant | 97.430a | 123.110a | 140.449a |
| (23.359) | (28.966) | (27.846) | |
| Country FE × high-educated mother | Y | Y | Y |
| Year FE, Year FE × high-educated mother | Y | Y | Y |
| Country-by-year FE, country-by-year FE × high-educated mother | Y | Y | Y |
| Observations | 109,012 | 109,012 | 109,012 |
| R-squared | 0.224 | 0.218 | 0.216 |
| Number of countries | 14 | 14 | 14 |
-
Note: This table reports the estimated coefficients for regressions on a model applying school fixed effects with the variables interacted with the dummy variable indicating high-educated mother. Column 1 shows the results for the reading (pv1read) score, column 2 shows the results for mathematics (pv1math), and column 3 shows the results for science (pv1scie) test score. Robust standard errors are clustered by school in parentheses. a p < 0.01, b p < 0.05, c p < 0.10.
Results on a model interacted with high-educated mother.
| Reading | Mathematics | Science | ||||
|---|---|---|---|---|---|---|
| Low-educated | High-educated | Low-educated | High-educated | Low-educated | High-educated | |
| ECE: 1 to <2 years | 16.635a | 23.100a | 10.846a | 16.092a | 11.117a | 20.527a |
| (2.242) | (3.087) | (1.453) | (2.080) | (2.385) | (2.912) | |
| ECE: 2 to <3 years | 24.250a | 26.155a | 19.617a | 22.157a | 18.279a | 24.563a |
| (3.655) | (3.693) | (3.471) | (2.595) | (4.051) | (3.597) | |
| ECE: 3 to <4 years | 26.040a | 29.960a | 22.157a | 27.256a | 20.633a | 28.530a |
| (3.731) | (4.522) | (3.067) | (2.742) | (3.779) | (4.639) | |
| ECE: 4 to <5 years | 15.567a | 23.290a | 12.535a | 21.173a | 10.141b | 20.580a |
| (3.817) | (3.798) | (3.503) | (2.248) | (3.576) | (3.490) | |
| ECE: 5 or more years | 7.156 | 18.695b | 0.594 | 15.553a | −0.779 | 16.263a |
| (4.658) | (5.565) | (4.693) | (4.083) | (4.670) | (5.028) | |
-
Note: This table reports the marginal effects of ECE duration for students with low- and high-educated mothers, derived from linear combination results of the two variables interacted in the specification based of the school fixed effects model presented above.a p < 0.01, b p < 0.05, c p < 0.10.
Results on tests of equality of subsets of parameters across mother’s education.
| Reading | Mathematics | Science | |
|---|---|---|---|
| Equality across mother’s education of parameters of: | |||
| All covariates, plus constant | 0.000 | 0.000 | 0.000 |
| ECE duration | 0.009 | 0.003 | 0.024 |
| Student characteristics | 0.000 | 0.000 | 0.000 |
| Parents characteristics | 0.000 | 0.000 | 0.000 |
| Home environment | 0.000 | 0.000 | 0.000 |
| School characteristics | 0.029 | 0.000 | 0.150 |
| Country, year, country-by-year FE | Yes | Yes | Yes |
-
Note: This table contains p-values of the tests of equality of subset of parameters across mother’s education of the covariates listed in the first column. The test is obtained in a model fully-interacted with the high-educated mother dummy variable.
Full regression results for a model fully-interacted with migration variable.
| VARIABLES | (1) | (2) | (3) |
|---|---|---|---|
| Reading | Math | Science | |
| ECE: 1 to <2 years | 0.938 | −2.883 | −1.796 |
| (4.497) | (4.394) | (4.561) | |
| ECE: 2 to <3 years | 9.890a | 7.830a | 6.870b |
| (3.931) | (3.281) | (3.523) | |
| ECE: 3 to <4 years | 13.690a | 12.458c | 11.008a |
| (4.784) | (3.839) | (4.756) | |
| ECE: 4 to <5 years | 5.370 | 4.771 | 1.854 |
| (4.923) | (4.578) | (4.683) | |
| ECE: 5 or more years | 0.453 | −2.453 | −4.485 |
| (5.327) | (4.780) | (5.111) | |
| Second-generation migrant | 25.820 | 44.969 | 35.484 |
| (65.994) | (49.486) | (55.516) | |
| ECE: 1 to <2 years × second-generation migrant | 8.736 | −4.591 | −0.831 |
| (9.835) | (8.357) | (8.932) | |
| ECE: 2 to <3 years × second-generation migrant | 13.760 | −1.596 | 2.914 |
| (9.777) | (7.069) | (8.883) | |
| ECE: 3 to <4 years × second-generation migrant | 12.774 | −0.026 | 3.034 |
| (10.226) | (7.011) | (8.719) | |
| ECE: 4 to <5 years × second-generation migrant | 3.997 | −8.612 | −4.556 |
| (10.006) | (8.204) | (9.209) | |
| ECE: 5 or more years × second-generation migrant | −4.558 | −11.742 | −5.928 |
| (7.549) | (7.544) | (7.583) | |
| Age | 16.681c | 16.196c | 15.359c |
| (1.429) | (1.509) | (1.667) | |
| Age × second-generation migrant | −0.183 | −0.997 | 0.013 |
| (3.451) | (3.358) | (3.480) | |
| Female | 20.192c | −14.774c | −7.384c |
| (2.411) | (1.736) | (2.208) | |
| Female × second-generation migrant | −0.295 | 1.167 | 0.907 |
| (3.383) | (1.986) | (2.878) | |
| Mother’s education: ISCED-3, 4 | 7.964c | 10.016c | 8.149c |
| (1.923) | (1.284) | (1.647) | |
| Mother’s education: ISCED-5, 6 | 1.798 | 4.754c | 3.245a |
| (1.674) | (1.334) | (1.469) | |
| Mother’s education: ISCED-3, 4 × second-generation migrant | 2.009 | −3.274 | 1.136 |
| (5.095) | (4.278) | (5.323) | |
| Mother’s education: ISCED-5, 6 × second-generation migrant | 1.207 | −4.352 | 0.995 |
| (4.995) | (5.128) | (5.861) | |
| Father’s education: ISCED-3, 4 | 4.836c | 6.381c | 5.468c |
| (1.226) | (0.879) | (1.184) | |
| Father’s education: ISCED-5, 6 | 1.161 | 3.262 | 2.735b |
| (1.485) | (1.874) | (1.427) | |
| Father’s education: ISCED-3, 4 × second-generation migrant | −0.004 | −0.820 | 0.748 |
| (2.018) | (2.993) | (3.163) | |
| Father’s education: ISCED-5, 6 × second-generation migrant | −6.222b | −3.017 | −4.973b |
| (2.880) | (3.636) | (2.657) | |
| Highest parental occupation status | 0.709c | 0.709c | 0.696c |
| (0.045) | (0.037) | (0.040) | |
| Highest parental occupation status × second-generation migrant | −0.119 | −0.178b | −0.144 |
| (0.122) | (0.086) | (0.099) | |
| 11–25 books at home | 27.930c | 25.142c | 26.700c |
| (1.190) | (1.591) | (1.255) | |
| 26–100 books at home | 53.825c | 50.456c | 54.060c |
| (2.039) | (2.270) | (2.025) | |
| 101–200 books at home | 71.081c | 67.072c | 73.058c |
| (2.552) | (2.185) | (2.830) | |
| 201–500 books at home | 87.922c | 80.183c | 89.042c |
| (2.969) | (2.087) | (3.361) | |
| More than 500 books at home | 88.827c | 82.171c | 89.870c |
| (3.966) | (2.928) | (4.159) | |
| 11–25 books at home × second-generation migrant | −2.358 | −4.029 | −4.908 |
| (4.142) | (3.529) | (3.681) | |
| 26–100 books at home × second-generation migrant | −5.780 | −6.130 | −8.516a |
| (4.516) | (3.812) | (3.933) | |
| 101–200 books at home × second-generation migrant | −9.981 | −9.588b | −13.781a |
| (6.014) | (5.330) | (6.039) | |
| 201–500 books at home × second-generation migrant | −2.084 | −5.617 | −8.076 |
| (5.858) | (4.119) | (4.926) | |
| More than 500 books at home × second-generation migrant | −10.826 | −4.996 | −8.028 |
| (11.681) | (11.359) | (11.714) | |
| Same language at home and test | 13.776a | 6.817 | 8.164 |
| (5.360) | (5.668) | (6.531) | |
| Same language at home and test × second-generation migrant | 6.767 | 2.798 | 8.498 |
| (6.987) | (6.900) | (7.228) | |
| School size | 0.010a | 0.011c | 0.100a |
| (0.004) | (0.003) | (0.004) | |
| School size × second-generation migrant | −0.004 | −0.001 | −0.003 |
| (0.006) | (0.004) | (0.005) | |
| Public school | 0.515 | −2.573 | −2.208 |
| (2.936) | (2.974) | (3.797) | |
| Public school × second-generation migrant | −3.263 | 1.956 | −1.414 |
| (8.429) | (6.301) | (6.886) | |
| Share of funding from government | −0.098a | −0.135a | −0.077 |
| (0.042) | (0.059) | (0.048) | |
| Share of funding from government × second-generation migrant | −0.395c | −0.355c | −0.396c |
| (0.094) | (0.065) | (0.085) | |
| Proportion of fully certified teachers | 8.318 | 6.649 | 7.744b |
| (5.193) | (4.512) | (4.272) | |
| Proportion of fully certified teachers × second-generation migrant | 15.551a | 15.284a | 15.189a |
| (5.937) | (5.365) | (5.732) | |
| School community in a small town | 5.953b | 4.949b | 3.426 |
| (3.195) | (2.298) | (2.692) | |
| School community in a town | 10.751a | 4.953 | 4.640 |
| (3.626) | (2.850) | (3.376) | |
| School community in a city | 15.337c | 8.061a | 6.928b |
| (4.284) | (3.077) | (3.841) | |
| School community in a large city | 14.902a | 7.591 | 5.657 |
| (5.784) | (4.607) | (4.993) | |
| School community in a small town × second-generation migrant | 8.495 | −3.063 | −4.563 |
| (7.846) | (7.800) | (7.261) | |
| School community in a town × second-generation migrant | 6.837 | −0.4543 | −3.024 |
| (8.652) | (7.413) | (6.834) | |
| School community in a city × second-generation migrant | 11.970 | 5.024 | 2.718 |
| (8.145) | (7.517) | (7.625) | |
| School community in a large city × second-generation migrant | 16.404 | 6.201 | 4.537 |
| (10.08) | (7.322) | (7.874) | |
| Constant | 85.084a | 130.767c | 147.492c |
| (28.668) | (29.398) | (30.209) | |
| Country FE × gender | Y | Y | Y |
| Year FE, year FE × gender | Y | Y | Y |
| Country-by-year FE, country-by-year FE × gender | Y | Y | Y |
| Observations | 102,950 | 102,950 | 102,950 |
| R-squared | 0.212 | 0.208 | 0.205 |
| Number of countries | 14 | 14 | 14 |
-
Note: This table reports the estimated coefficients for regressions on a model applying school fixed effects with the variables interacted with the dummy variable indicating second-generation migrant. Column 1 shows the results for the reading (pv1read) score, column 2 shows the results for mathematics (pv1math), and column 3 shows the results for science (pv1scie) test score. First-generation migrant students are dropped from the sample. Robust standard errors are clustered by school in parentheses. a p < 0.05, b p < 0.10, c p < 0.01.
Full regression results for a model fully-interacted with gender variable.
| VARIABLES | (1) | (2) | (3) | (4) | (5) | (6) |
|---|---|---|---|---|---|---|
| Reading | Math | Science | Reading | Math | Science | |
| ECE: 1 to <2 years | 19.361a | 11.909a | 14.845a | 19.151a | 12.631a | 14.804a |
| (3.019) | (1.601) | (2.901) | (2.137) | (1.095) | (1.939) | |
| ECE: 2 to <3 years | 26.276a | 21.377a | 22.248a | 24.803a | 20.372a | 20.753a |
| (4.679) | (3.423) | (4.533) | (3.536) | (2.850) | (3.558) | |
| ECE: 3 to <4 years | 29.605a | 25.522a | 26.455a | 27.707a | 24.480a | 24.058a |
| (4.776) | (3.711) | (4.423) | (3.801) | (2.770) | (3.810) | |
| ECE: 4 to <5 years | 20.406a | 16.038a | 16.366a | 19.029a | 16.355a | 14.641a |
| (3.721) | (2.461) | (3.402) | (3.179) | (2.513) | (3.032) | |
| ECE: 5 or more years | 12.433b | 6.521 | 7.570 | 12.606b | 8.013c | 7.407 |
| (5.328) | (4.280) | (5.184) | (4.631) | (3.972) | (4.381) | |
| Female | 136.547a | 71.195a | 85.656a | 133.657a | 69.092b | 83.079a |
| (27.571) | (22.847) | (25.998) | (29.233) | (23.477) | (27.489) | |
| ECE: 1 to <2 years × female | −0.622 | 1.388 | −0.325 | |||
| (2.406) | (2.209) | (2.483) | ||||
| ECE: 2 to <3 years × female | −3.167 | −2.081 | −3.260 | |||
| (3.377) | (2.894) | (3.200) | ||||
| ECE: 3 to <4 years × female | −3.998 | −2.131 | −5.030 | |||
| (3.294) | (3.487) | (3.149) | ||||
| ECE: 4 to <5 years × female | −2.995 | 0.427 | −3.733 | |||
| (2.627) | (2.864) | (2.624) | ||||
| ECE: 5 or more years × female | −0.126 | 2.594 | −0.825 | |||
| (2.852) | (3.333) | (3.302) | ||||
| Age | 19.968a | 18.844a | 18.090a | 19.956a | 18.796a | 18.1045a |
| (1.795) | (1.626) | (1.954) | (1.808) | (1.653) | (1.982) | |
| Age × female | −6.416a | −5.440a | −5.540a | −6.403a | −5.354a | −5.580a |
| (1.888) | (1.437) | (1.706) | (1.959) | (1.513) | (1.798) | |
| First-generation migrant | −9.604a | −9.765a | −8.156c | −9.852a | −9.948a | −8.468b |
| (3.042) | (2.545) | (3.838) | (3.082) | (2.553) | (3.876) | |
| Second-generation migrant | −5.609 | −9.483a | −10.691b | −5.605 | −9.473a | −10.689b |
| (3.598) | (2.300) | (3.896) | (3.605) | (2.308) | (3.898) | |
| First-generation migrant × female | 0.590 | −1.503 | −1.731 | 1.120 | −1.128 | −1.060 |
| (2.797) | (2.120) | (2.085) | (2.702) | (1.991) | (1.944) | |
| Second-generation migrant × female | 1.934 | 2.066 | 1.616 | 1.927 | 2.049 | 1.611 |
| (2.314) | (1.446) | (2.494) | (2.313) | (1.437) | (2.492) | |
| Mother’s education: ISCED-3, 4 | 7.281a | 9.747a | 8.381a | 7.299a | 9.750a | 8.403a |
| (1.983) | (2.065) | (1.677) | (1.997) | (2.080) | (1.691) | |
| Mother’s education: ISCED-5, 6 | −0.180 | 2.900b | 1.787 | −0.171 | 2.873b | 1.802 |
| (1.277) | (1.154) | (1.433) | (1.277) | (1.155) | (1.446) | |
| Mother’s education: ISCED-3, 4 × female | 2.290 | −0.229 | 0.455 | 2.264 | −0.219 | 0.419 |
| (1.593) | (1.833) | (1.671) | (1.604) | (1.861) | (1.685) | |
| Mother’s education: ISCED-5, 6 × female | 4.019b | 2.707c | 3.194 | 4.005b | 2.754c | 3.164 |
| (1.444) | (1.489) | (2.197) | (1.454) | (1.504) | (2.204) | |
| Father’s education: ISCED-3, 4 | 4.586c | 6.865a | 5.496b | 4.581c | 6.846a | 5.489b |
| (2.201) | (1.245) | (2.055) | (2.199) | (1.244) | (2.056) | |
| Father’s education: ISCED-5, 6 | −0.598 | 1.933 | 1.583 | −0.605 | 1.918 | 1.576 |
| (1.970) | (2.102) | (1.760) | (1.966) | (2.099) | (1.757) | |
| Father’s education: ISCED-3, 4 × female | 0.682 | −1.215 | 0.458 | 0.683 | −1.199 | 0.465 |
| (2.165) | (1.684) | (2.115) | (2.160) | (1.670) | (2.114) | |
| Father’s education: ISCED-5, 6 × female | 2.614 | 1.859 | 2.034 | 2.629 | 1.882 | 2.055 |
| (2.121) | (1.537) | (1.866) | (2.108) | (1.528) | (1.854) | |
| Highest parental occupation status | 0.738a | 0.724a | 0.722a | 0.739a | 0.724a | 0.723a |
| (0.053) | (0.045) | (0.052) | (0.053) | (0.045) | (0.052) | |
| Highest parental occupation status × female | −0.077b | −0.059b | −0.078b | −0.079b | −0.060c | −0.081a |
| (0.026) | (0.027) | (0.026) | (0.026) | (0.028) | (0.026) | |
| 11–25 books at home | 28.651a | 24.274a | 26.031a | 28.695a | 24.314a | 26.084a |
| (1.487) | (1.746) | (1.468) | (1.480) | (1.738) | (1.459) | |
| 26–100 books at home | 53.231a | 49.864a | 52.423a | 53.304a | 49.922a | 52.515a |
| (2.272) | (2.757) | (2.464) | (2.272) | (2.753) | (2.473) | |
| 101–200 books at home | 70.061a | 66.317a | 71.344a | 70.157a | 66.395a | 71.471a |
| (2.860) | (1.845) | (3.039) | (2.837) | (1.835) | (3.039) | |
| 201–500 books at home | 87.023a | 80.619a | 87.457a | 87.128a | 80.709a | 87.591a |
| (3.935) | (2.930) | (4.436) | (3.916) | (2.926) | (4.431) | |
| More than 500 books at home | 82.509a | 76.257a | 82.465a | 82.582a | 76.310a | 82.566a |
| (4.155) | (3.537) | (4.299) | (4.147) | (3.531) | (4.300) | |
| 11–25 books at home × female | −2.812c | −0.458 | −1.501 | −2.917c | −0.541 | −1.634 |
| (1.487) | (1.424) | (1.590) | (1.459) | (1.406) | (1.581) | |
| 26–100 books at home × female | −0.456 | −1.158 | 0.064 | −0.605 | −1.276 | −0.123 |
| (1.996) | (1.605) | (1.877) | (1.955) | (1.575) | (1.886) | |
| 101–200 books at home × female | −0.234 | −1.366 | −0.441 | −0.414 | −1.509 | −0.675 |
| (2.709) | (1.777) | (2.256) | (2.624) | (1.693) | (2.200) | |
| 201–500 books at home × female | 0.737 | −2.527 | 0.250 | 0.537 | −2.684 | −0.011 |
| (3.323) | (2.627) | (2.742) | (3.242) | (2.550) | (2.691) | |
| More than 500 books at home × female | 10.727a | 9.663a | 11.643a | 10.568a | 9.533a | 11.431a |
| (3.150) | (2.209) | (3.211) | (3.101) | (2.134) | (3.206) | |
| Same language at home and test | 18.084a | 8.263c | 12.768b | 18.118a | 8.293c | 12.808b |
| (4.032) | (4.259) | (5.202) | (4.009) | (4.234) | (5.191) | |
| Same language at home and test × female | −4.714b | −2.296c | −3.934a | −4.765b | −2.335c | −3.992a |
| (1.878) | (1.238) | (1.090) | (1.882) | (1.204) | (1.066) | |
| School size | 0.011b | 0.011a | 0.010b | 0.011b | 0.011a | 0.010b |
| (0.004) | (0.003) | (0.004) | (0.004) | (0.003) | (0.004) | |
| School size × female | −0.002a | −0.001 | −0.001 | −0.002a | −0.001 | −0.001 |
| (0.001) | (0.001) | (0.001) | (0.001) | (0.001) | (0.001) | |
| Public school | 0.194 | −3.686 | −3.912 | 0.182 | −3.668 | −3.945 |
| (4.041) | (4.030) | (5.199) | (4.058) | (4.061) | (5.214) | |
| Public school × female | 0.170 | 1.764 | 2.971 | 0.184 | 1.725 | 3.018 |
| (3.358) | (3.034) | (3.434) | (3.364) | (3.061) | (3.441) | |
| Share of funding from government | −0.109c | −0.160b | −0.097 | −0.109c | −0.160b | −0.097 |
| (0.055) | (0.069) | (0.058) | (0.055) | (0.069) | (0.059) | |
| Share of funding from government × female | −0.041 | −0.014 | −0.030 | −0.041 | −0.014 | −0.030 |
| (0.024) | (0.028) | (0.024) | (0.024) | (0.029) | (0.024) | |
| Proportion of fully certified teachers | 11.755c | 9.267 | 11.285c | 11.773c | 9.283 | 11.302c |
| (6.595) | (5.738) | (5.516) | (6.592) | (5.739) | (5.515) | |
| Proportion of fully certified teachers × female | −3.255 | −2.177 | −3.776 | −3.283 | −2.207 | −3.806 |
| (2.861) | (2.085) | (2.456) | (2.859) | (2.090) | (2.456) | |
| School community in a small town | 7.695c | 5.484c | 4.094 | 7.713c | 5.478c | 4.121 |
| (3.724) | (2.802) | (3.223) | (3.715) | (2.782) | (3.206) | |
| School community in a town | 13.184a | 6.185 | 6.332 | 13.206a | 6.172 | 6.367 |
| (4.262) | (3.588) | (3.988) | (4.263) | (3.590) | (3.994) | |
| School community in a city | 19.920a | 10.702b | 9.990c | 19.931a | 10.674b | 9.927c |
| (5.334) | (3.954) | (4.968) | (5.324) | (3.944) | (4.957) | |
| School community in a large city | 18.710b | 11.777b | 10.306c | 18.719b | 11.746b | 10.325c |
| (6.310) | (4.609) | (5.113) | (6.290) | (4.575) | (5.092) | |
| School community in a small town × female | −3.180 | −1.279 | −1.374 | −3.211 | −1.279 | −1.426 |
| (2.245) | (1.921) | (1.922) | (2.259) | (1.898) | (1.930) | |
| School community in a town × female | −4.473 | −1.883 | −2.926 | −4.504 | −1.871 | −2.985 |
| (2.755) | (2.607) | (2.466) | (2.788) | (2.614) | (2.508) | |
| School community in a city × female | −6.917b | −3.416 | −4.007 | −6.937b | −3.374 | −4.063 |
| (3.022) | (2.481) | (2.552) | (3.022) | (2.466) | (2.562) | |
| School community in a large city × female | −5.920 | −7.182b | −7.487b | −5.936 | −7.134b | −7.527b |
| (3.683) | (2.587) | (2.678) | (3.682) | (2.566) | (2.699) | |
| Constant | 10.660 | 77.217b | 86.884b | 12.000 | 78.323b | 88.020b |
| (30.258) | (29.740) | (33.110) | (30.653) | (30.014) | (33.176) | |
| Country FE × gender | Y | Y | Y | Y | Y | Y |
| Year FE, year FE × gender | Y | Y | Y | Y | Y | Y |
| Country-by-year FE, country-by-year FE × gender | Y | Y | Y | Y | Y | Y |
| Observations | 109,012 | 109,012 | 109,012 | 109,012 | 109,012 | 109,012 |
| R-squared | 0.223 | 0.217 | 0.215 | 0.223 | 0.217 | 0.215 |
| Number of countries | 14 | 14 | 14 | 14 | 14 | 14 |
-
Note: This table reports the estimated coefficients for regressions on a model applying school fixed effects with the variables interacted with the female dummy variable. Column 1 shows the results for the reading (pv1read) score, column 2 shows the results for mathematics (pv1math), and column 3 shows the results for science (pv1scie) test score. Robust standard errors are clustered by school in parentheses. a p < 0.01, b p < 0.05, c p < 0.10.
Full regression results for a model fully-interacted with ECE institution variable.
| VARIABLES | (1) | (2) | (3) |
|---|---|---|---|
| Reading | Math | Science | |
| ECE: 1 to <2 years | 16.807a | 12.682a | 13.381a |
| (4.410) | (2.154) | (3.836) | |
| ECE: 2 to <3 years | 20.639a | 17.141a | 17.439b |
| (5.355) | (3.071) | (6.252) | |
| ECE: 3 to <4 years | 25.389a | 24.280a | 23.562a |
| (6.133) | (3.121) | (6.809) | |
| ECE: 4 to <5 years | 19.482a | 17.979a | 15.223b |
| (5.065) | (2.893) | (5.232) | |
| ECE: 5 or more years | 14.438c | 10.863b | 9.870 |
| (6.800) | (4.765) | (6.980) | |
| ECE: 1 to <2 years × separate ECE setting | 3.449 | −0.625 | 2.182 |
| (4.687) | (2.689) | (4.155) | |
| ECE: 2 to <3 years × separate ECE setting | 7.040 | 5.896 | 5.774 |
| (6.619) | (4.788) | (6.998) | |
| ECE: 3 to <4 years × separate ECE setting | 3.721 | 0.280 | 0.743 |
| (7.826) | (5.396) | (7.878) | |
| ECE: 4 to <5 years × separate ECE setting | −2.404 | −3.679 | −1.686 |
| (6.655) | (4.908) | (6.546) | |
| ECE: 5 or more years × separate ECE setting | −5.816 | −7.086 | −6.061 |
| (10.117) | (9.128) | (9.242) | |
| Age | 16.731a | 15.517a | 13.003a |
| (1.937) | (1.745) | (1.579) | |
| Age × separate ECE setting | 0.595 | 1.280 | 4.545c |
| (2.502) | (2.297) | (2.467) | |
| Female | 21.366a | −15.207a | −6.539c |
| (3.892) | (2.436) | (3.520) | |
| Female × separate ECE setting | −2.937 | 0.580 | −2.141 |
| (4.282) | (3.198) | (4.061) | |
| First-generation migrant | −5.555 | −8.435c | −2.409 |
| (4.559) | (4.694) | (3.585) | |
| Second-generation migrant | 2.720 | −4.213 | −2.205 |
| (2.174) | (3.920) | (3.611) | |
| First-generation migrant × separate ECE setting | −8.433 | −4.156 | −12.832b |
| (5.096) | (5.448) | (4.985) | |
| Second-generation migrant × separate ECE setting | −12.109a | −6.201 | −11.999b |
| (3.317) | (4.305) | (4.423) | |
| Mother’s education: ISCED-3, 4 | 5.150b | 7.839a | 7.305b |
| (2.298) | (1.941) | (2.736) | |
| Mother’s education: ISCED-5, 6 | 0.159 | 4.487a | 3.590b |
| (1.101) | (0.544) | (1.243) | |
| Mother’s education: ISCED-3, 4 × separate ECE setting | 5.748b | 3.083 | 2.427 |
| (2.527) | (2.451) | (2.976) | |
| Mother’s education: ISCED-5, 6 × separate ECE setting | 2.678 | −0.577 | −0.240 |
| (2.522) | (2.686) | (2.501) | |
| Father’s education: ISCED-3, 4 | 2.524b | 5.382a | 3.197a |
| (1.142) | (0.669) | (0.389) | |
| Father’s education: ISCED-5, 6 | 0.102 | 3.533b | 2.772b |
| (1.124) | (1.506) | (1.114) | |
| Father’s education: ISCED-3, 4 × separate ECE setting | 4.023b | 1.201 | 4.337a |
| (1.801) | (1.462) | (0.919) | |
| Father’s education: ISCED-5, 6 × separate ECE setting | 0.720 | −1.696 | −0.680 |
| (2.699) | (3.515) | (2.835) | |
| Highest parental occupation status | 0.613a | 0.625a | 0.600a |
| (0.034) | (0.015) | (0.028) | |
| Highest parental occupation status × separate ECE setting | 0.189a | 0.148b | 0.185a |
| (0.051) | (0.049) | (0.051) | |
| 11–25 books at home | 26.059a | 22.603a | 24.419a |
| (1.087) | (2.184) | (1.973) | |
| 26–100 books at home | 52.020a | 49.483a | 53.200a |
| (2.637) | (3.004) | (2.142) | |
| 101–200 books at home | 70.196a | 64.927a | 73.474a |
| (2.826) | (3.098) | (3.001) | |
| 201–500 books at home | 88.517a | 78.836a | 89.971a |
| (3.820) | (2.761) | (4.491) | |
| More than 500 books at home | 86.830a | 80.371a | 89.399a |
| (5.296) | (3.120) | (5.970) | |
| 11–25 books at home × separate ECE setting | 1.472 | 2.424 | 1.179 |
| (2.181) | (3.126) | (2.628) | |
| 26–100 books at home × separate ECE setting | 0.948 | −1.187 | −2.135 |
| (3.524) | (4.047) | (3.335) | |
| 101–200 books at home × separate ECE setting | −1.675 | 0.635 | −5.751 |
| (4.141) | (3.704) | (4.005) | |
| 201–500 books at home × separate ECE setting | −3.368 | 0.084 | −5.698 |
| (5.990) | (4.447) | (6.603) | |
| More than 500 books at home × separate ECE setting | 1.050 | 0.850 | −2.749 |
| (8.491) | (6.714) | (8.825) | |
| Same language at home and test | 17.751b | 10.780b | 17.350a |
| (6.506) | (4.408) | (5.475) | |
| Same language at home and test × separate ECE setting | −4.449 | −7.260 | −13.067 |
| (8.586) | (7.507) | (8.723) | |
| School size | 0.005 | 0.007a | 0.005 |
| (0.003) | (0.002) | (0.003) | |
| School size × separate ECE setting | 0.007 | 0.005 | 0.006 |
| (0.006) | (0.005) | (0.006) | |
| Public school | −2.631 | −2.856 | −2.618 |
| (2.507) | (3.390) | (3.888) | |
| Public school × separate ECE setting | 0.215 | −2.631 | −2.354 |
| (5.390) | (5.658) | (5.803) | |
| Share of funding from government | −0.102 | −0.209a | −0.125c |
| (0.070) | (0.039) | (0.066) | |
| Share of funding from government × separate ECE setting | −0.027 | 0.082 | 0.018 |
| (0.091) | (0.090) | (0.096) | |
| Proportion of fully certified teachers | 1.341 | 0.851 | 0.677 |
| (2.210) | (1.925) | (1.912) | |
| Proportion of fully certified teachers × separate ECE setting | 14.417 | 12.831 | 15.250c |
| (8.983) | (7.747) | (7.413) | |
| School community in a small town | 2.664 | 3.450 | −0.322 |
| (2.783) | (2.115) | (2.627) | |
| School community in a town | 7.094c | 3.097 | 0.757 |
| (3.339) | (3.272) | (3.373) | |
| School community in a city | 10.149a | 5.425b | 1.065 |
| (3.017) | (2.327) | (2.348) | |
| School community in a large city | 4.856 | −1.788 | −4.675c |
| (3.152) | (1.902) | (2.521) | |
| School community in a small town × separate ECE setting | 9.574 | 4.010 | 9.540c |
| (5.821) | (4.868) | (4.444) | |
| School community in a town × separate ECE setting | 10.305 | 5.496 | 10.580c |
| (6.905) | (5.970) | (5.644) | |
| School community in a city × separate ECE setting | 16.128c | 9.316 | 17.109b |
| (8.298) | (6.840) | (6.346) | |
| School community in a large city × separate ECE setting | 22.270b | 18.874a | 22.532a |
| (8.688) | (6.242) | (6.634) | |
| Constant | 82.660a | 133.049a | 139.299a |
| (24.120) | (22.310) | (23.621) | |
| Year FE, year FE × institutional setting | Y | Y | Y |
| Observations | 109,012 | 109,012 | 109,012 |
| R-squared | 0.222 | 0.216 | 0.215 |
| Number of countries | 14 | 14 | 14 |
-
Note: This table reports the estimated coefficients for regressions on a model applying country fixed effects with the variables interacted with the dummy variable for separate ECE setting. Column 1 shows the results for the reading (pv1read) score, column 2 shows the results for mathematics (pv1math), and column 3 shows the results for science (pv1scie) test score. Robust standard errors are clustered by country in parentheses. a p < 0.01, b p < 0.05, c p < 0.10.
Results of duration of ECE participation on assessment outcomes for unitary and separate ECE settings.
| Reading | Mathematics | Science | ||||
|---|---|---|---|---|---|---|
| Unitary | Separate | Unitary | Separate | Unitary | Separate | |
| ECE: 1 to <2 years | 16.807a | 20.256a | 12.682a | 12.057a | 13.381a | 15.562a |
| (4.410) | (1.587) | (2.154) | (1.610) | (3.836) | (1.596) | |
| ECE: 2 to <3 years | 20.639a | 27.679a | 17.141a | 23.037a | 17.439b | 23.213a |
| (5.355) | (3.891) | (3.071) | (3.674) | (6.252) | (3.144) | |
| ECE: 3 to <4 years | 25.389a | 29.110a | 24.280a | 24.560a | 23.562a | 24.305a |
| (6.133) | (4.863) | (3.122) | (4.402) | (6.809) | (3.963) | |
| ECE: 4 to <5 years | 19.482a | 17.077a | 17.979a | 14.300a | 15.223b | 13.537a |
| (5.065) | (4.317) | (2.893) | (3.965) | (5.232) | (3.934) | |
| ECE: 5 or more years | 14.438c | 8.622 | 10.863b | 3.778 | 9.870 | 3.809 |
| (6.800) | (7.491) | (4.765) | (7.786) | (6.980) | (6.058) | |
-
Note: This table reports the marginal effects of ECE duration for students in unitary and separate ECE settings, derived from linear combination results of the two variables interacted in the specification based of the school fixed effects model presented above.a p < 0.01, b p < 0.05, c p < 0.10.
References
Adams, R., and M. Wu. 2002. PISA 2000 Technical Report. OECD. http://www.oecd.org/edu/preschoolandschool/programmeforinternationalstudentassessmentpisa/33688233.pdf.10.1787/9789264199521-enSearch in Google Scholar
Bedard, K., and E. Dhuey. 2006. “The Persistence of Early Childhood Maturity: International Evidence of Long-Run Age Effects.” The Quarterly Journal of Economics 121 (4): 1437–72. https://doi.org/10.1093/qje/121.4.1437.Search in Google Scholar
Bennett, J. 2008. “Early Childhood Education and Care Systems in the OECD Countries: The Issue of Transitions and Governance.” In Encyclopaedia on Early Childhood Development. Montreal: Centre of Excellence for Early Childhood Development and Strategic Knowledge Cluster on Early Childhood Development.Search in Google Scholar
Bergbauer, A., E. Hanushek, and L. Woessmann. 2021. “Testing.” The Journal of Human Resources. https://doi.org/10.3368/jhr.0520-10886R1.Search in Google Scholar
Bertram, T., and C. Pascal. 2016. Early Childhood Policies and Systems in Eight Countries: Findings from IEA’s Early Childhood Education Study. Hamburg: IEA.10.1007/978-3-319-39847-1Search in Google Scholar
Black, S., P. Devereux, and K. Salvanes. 2011. “Too Young to Leave the Nest? The Effects of School Starting Age.” Review of Economics and Statistics 93 (2): 455–67. https://doi.org/10.1162/rest_a_00081.Search in Google Scholar
Blanden, J., E. Del Bono, K. Hansen, and B. Rabe. 2022. “Quantity and Quality of Childcare and Children’s Educational Outcomes.” Journal of Population Economics 35: 785–828. https://doi.org/10.1007/s00148-021-00835-4.Search in Google Scholar
Brilli, Y., D. Del Boca, and C. Pronzato. 2016. “Does Child Care Availability Play a Role in Maternal Employment and Children’s Development? Evidence from Italy.” Review of Economics of the Household 14 (1): 27–51. https://doi.org/10.1007/s11150-013-9227-4.Search in Google Scholar
Brunello, G., G. Weber, and C. Weiss. 2017. “Books are Forever: Early Life Conditions, Education and Lifetime Earnings.” The Economic Journal 127 (600m): 271–96. https://doi.org/10.1111/ecoj.12307.Search in Google Scholar
Carta, F., and L. Rizzica. 2018. “Early Kindergarten, Maternal Labor Supply and Children’s Outcomes: Evidence from Italy.” Journal of Public Economics 158 (C): 79–102. https://doi.org/10.1016/j.jpubeco.2017.12.012.Search in Google Scholar
Cornelissen, T., and C. Dustmann. 2019. “Early School Exposure, Test Scores, and Noncognitive Outcomes.” American Economic Journal: Economic Policy 11 (2): 35–63. https://doi.org/10.1257/pol.20170641.Search in Google Scholar
Corrazzini, L., E. Meschi, and C. Pavese. 2021. “Impact of Early Childcare on Immigrant Children’s Educational Performance.” Economics of Education Review 85: 102181. https://doi.org/10.1016/j.econedurev.2021.102181.Search in Google Scholar
Das, J., S. Dercon, J. Habyarimana, P. Krishnan, K. Muralidharan, and V. Sundararaman. 2013. “When Can School Inputs Improve Test Scores?” American Economic Journal: Applied Economics 5 (2): 29–57. https://doi.org/10.1257/app.5.2.29.Search in Google Scholar
Datar, A. 2006. “Does Delaying Kindergarten Entrance Give Children a Head Start?” Economics of Education Review 25 (1): 43–62. https://doi.org/10.1016/j.econedurev.2004.10.004.Search in Google Scholar
Datta Gupta, N., and M. Simonsen. 2016. “Academic Performance and Type of Early Childhood Care.” Economics of Education Review 53: 217–29. https://doi.org/10.1016/j.econedurev.2016.03.013.Search in Google Scholar
Dee, T. 2007. “Teachers and the Gender Gaps in Student Achievement.” Journal of Human Resources 42 (3): 528–54. https://doi.org/10.3368/jhr.xlii.3.528.Search in Google Scholar
Del Boca, D., E. Martino, and C. Pronzato. 2021. “Child Non-Cognitive Outcomes and Early Childcare Attendance.” Review of Economics of the Household 20 (4): 1059–85. https://doi.org/10.1007/s11150-021-09591-6.Search in Google Scholar
Dietrichson, J., I. Kristiansen, and B. Viinjolt. 2020. “Universal Preschool Programs and Long-Term Child Outcomes: A Systematic Review.” Journal of Economic Surveys 34 (5): 1007–43. https://doi.org/10.1111/joes.12382.Search in Google Scholar
Dustmann, C., T. Frattini, and G. Lanzara. 2012. “Educational Achievement of Second-Generation Immigrants: An International Comparison.” Economic Policy 27: 143–85. https://doi.org/10.1111/j.1468-0327.2011.00275.x.Search in Google Scholar
Elder, T., and D. Lubotsky. 2009. “Kindergarten Entrance Age and Children’s Achievement: Impacts of State Policies, Family Background, and Peers.” The Journal of Human Resources 44 (3): 641–83. https://doi.org/10.1353/jhr.2009.0015.Search in Google Scholar
European Commission, EACEA, Eurydice and Eurostat. 2014. “Key Data on Early Childhood Education and Care in Europe, 2014 Edition.” In Eurydice and Eurostat Report. Luxembourg: European Commission.Search in Google Scholar
European Commission/EACEA/Eurydice. 2019. Eurydice Brief: Key Data on Early Childhood Education and Care in Europe. Luxembourg: Publications Office of the European Union.Search in Google Scholar
Felfe, C., N. Nollenberger, and N. Rodridguez-Planas. 2015. “Can’t Buy Mommy’s Love? Universal Childcare and Children’s Long-Term Cognitive Development.” Journal of Population Economics 28 (2): 393–422. https://doi.org/10.1007/s00148-014-0532-x.Search in Google Scholar
Fort, M., A. Ichino, and G. Zanella. 2020. “Cognitive and Noncognitive Costs of Day Care at Age 0–2 for Children in Advantaged Families.” Journal of Political Economy 128 (1): 158–205. https://doi.org/10.1086/704075.Search in Google Scholar
Freeman, R., and M. Viarengo. 2014. “School and Family Effects on Educational Outcomes Across Countries.” Economic Policy 29 (79): 397–446. https://doi.org/10.1111/1468-0327.12033.Search in Google Scholar
Ganzeboom, H., P. de Graaf, and D. Treiman. 1992. “A Standard International Socio-Economic Index of Occupational Status.” Social Science Research 21 (1): 1–56. https://doi.org/10.1016/0049-089x(92)90017-b.Search in Google Scholar
Hanushek, E., S. Link, and L. Woessmann. 2013. “Does School Autonomy Make Sense Everywhere? Panel Estimates from PISA.” Journal of Development Economics 104: 212–32. https://doi.org/10.1016/j.jdeveco.2012.08.002.Search in Google Scholar
Havnes, T., and M. Mogstad. 2015. “Is universal child care leveling the playing field?” Journal of Public Economics 127: 100–114, https://doi.org/10.1016/j.jpubeco.2014.04.007.Search in Google Scholar
Jerrim, J., L. Alejandro Lopez-Agudo, O. Marcenaro-Gutierrez, and N. Shure. 2017. “What Happens When Econometrics and Psychometrics Collide? An Example Using the PISA Data.” Economics of Education Review 61: 51–8. https://doi.org/10.1016/j.econedurev.2017.09.007.Search in Google Scholar
Kaga, Y., J. Bennett, and P. Moss. 2010. Caring and Learning Together: A Cross-National Study on the Integration of Early Childhood Care and Education Within Education. Paris: UNESCO.10.1007/2288-6729-4-1-35Search in Google Scholar
Karoly, L., and J. Bigelow. 2005. The Economics of Investing in Universal Preschool Education in California. MG-349-PF. Santa Monica: Rand Corporation.10.7249/MG349Search in Google Scholar
Laaninen, M., N. Kulic, and J. Erola. 2022. “How Attendance in Early Childhood Education and Care is Associated with Literacy Scores at the Age of 15? Comparison in Five Nordic Countries.” INVEST Working Papers 62/2022.10.31235/osf.io/2nr9wSearch in Google Scholar
Lavy, V. 2015. “Do Differences in Schools’ Instruction Time Explain International Achievement Gaps? Evidence from Developed and Developing Countries.” The Economic Journal 125: F397–424. https://doi.org/10.1111/ecoj.12233.Search in Google Scholar
Lazear, E. 2001. “Educational Production.” Quarterly Journal of Economics 116 (3): 777–803. https://doi.org/10.1162/00335530152466232.Search in Google Scholar
Li, W., G. Duncan, K. Magnuson, H. Schindler, H. Yoshikawa, and J. Leak. 2020. “Timing in Early Childhood Education: How Cognitive and Achievement Program Impacts Vary by Starting Age, Program Duration, and Time Since the End of the Program.” EdWorking Paper: 20-211.Search in Google Scholar
Loeb, S., M. Bridges, D. Bassok, B. Fuller, and R. Rumberger. 2007. “How Much is Too Much? The Influence of Preschool Centers on Children’s Social and Cognitive Development.” Economics of Education Review 26: 52–66. https://doi.org/10.1016/j.econedurev.2005.11.005.Search in Google Scholar
Magnuson, K., C. Ruhm, and J. Waldfogel. 2007. “Does Prekindergarten Improve School Preparation and Performance?” Economics of Education Review 26: 33–51. https://doi.org/10.1016/j.econedurev.2005.09.008.Search in Google Scholar
Martins, L., and P. Veiga. 2010. “Do Inequalities in Parents’ Education Play an Important Role in PISA Students’ Mathematics Achievement Test Score Disparities?” Economics of Education Review 29: 1016–33. https://doi.org/10.1016/j.econedurev.2010.05.001.Search in Google Scholar
Morando, G., and L. Platt. 2022. “The Impact of Centre-Based Childcare on Non-Cognitive Skills of Young Children.” Economica 89 (356): 908–46. https://doi.org/10.1111/ecca.12440.Search in Google Scholar
OECD/Eurostat/UNESCO Institute for Statistics. 2015. ISCED 2011 Operational Manual Guidelines for Classifying National Education Programmes and Related Qualifications. Paris: OECD Publishing.Search in Google Scholar
OECD. 2016. Education at a Glance. Paris: OECD Publishing.Search in Google Scholar
OECD. 2019a. Economic Policy Reforms 2019: Going for Growth. Paris: OECD Publishing.Search in Google Scholar
OECD. 2019b. PISA 2018 Results (Volume 1): What Students Know and Can Do. Paris: PISA, OECD Publishing.Search in Google Scholar
Reynolds, A., J. Temple, S. Ou, I. Artenga, and B. White. 2011. “School-Based Early Childhood Education and Age-28 Well-Being: Effects by Timing, Dosage, and Subgroups.” Science 333 (6040): 360–4. https://doi.org/10.1126/science.1203618.Search in Google Scholar
Rivkin, S., and J. Schiman. 2015. “Instruction Time, Classroom Quality, and Academic Achievement.” The Economic Journal 125: F425–48. https://doi.org/10.1111/ecoj.12315.Search in Google Scholar
Rossin-Slater, M., and M. Wuest. 2020. “What is the Added Value of Preschool for Poor Children? Long-Term and Intergenerational Impacts and Interactions with an Infant Health Intervention.” American Economic Journal: Applied Economics 12 (3): 255–86. https://doi.org/10.1257/app.20180698.Search in Google Scholar
Schuetz, G. 2009. “Does Quality of Pre-Primary Education Pay Off in Secondary School? An International Comparison Using PISA 2003.” In Ifo Working Paper No. 68. Munich: Ifo Institute for Economic Research, University of Munch.Search in Google Scholar
Temple, J., and A. Reynolds. 2007. “Benefits and Costs of Investments in Preschool Education: Evidence from Child-Parent Centers and Related Programs.” Economics of Education Review 26 (1): 126–44. https://doi.org/10.1016/j.econedurev.2005.11.004.Search in Google Scholar
Todd, P., and K. Wolpin. 2007. “The Production of Cognitive Achievement in Children: Home, School, and Racial Test Score Gaps.” Journal of Human Capital 1 (1): 91–136. https://doi.org/10.1086/526401.Search in Google Scholar
Vandenbroeck, M., K. Lenaerts, and M. Beblavy. 2018. “Benefits of Early Childhood Education and Care and the Conditions for Obtaining Them.” European Expert Network on Economics of Education Analytical Report No. 32.Search in Google Scholar
© 2023 the author(s), published by De Gruyter, Berlin/Boston
This work is licensed under the Creative Commons Attribution 4.0 International License.
Articles in the same Issue
- Frontmatter
- Research Articles
- Strategic Analysis of Petty Corruption with an Entrepreneur and Multiple Bureaucrats
- Environmental Policy in Vertical Markets with Downstream Pollution: Taxes Versus Standards
- The Impact of the CARES Stimulus Payments on COVID-19 Transmission and Mortality
- Reverses in Gender Salary Gaps Among STEM Faculty: Evidence from Mean and Quantile Decompositions
- Downstream Profit Effects of Horizontal Mergers: Horn & Wolinsky and von Ungern-Sternberg Revisited
- The Moderating Role of Decisiveness in the Attraction Effect
- Pension Reform and Improved Employment Protection: Effects on Older Men’s Employment Outcomes
- Relational Voluntary Environmental Agreements with Unverifiable Emissions
- Letters
- Labor Demand Responses to Changing Gas Prices
- Early Childhood Education Attendance and Students’ Later Outcomes in Europe
- The Long-Term Effects of Unilateral Divorce Laws on the Noncognitive Skill of Conscientiousness
- Lab versus Online Experiments: Gender Differences
- Pre-Exposure Prophylaxis and HIV Incidence
- Variants of Gender Bias and Sexual-Orientation Discrimination in Career Development