Thickened fluids classification based on the rheological and tribological characteristics
-


Abstract
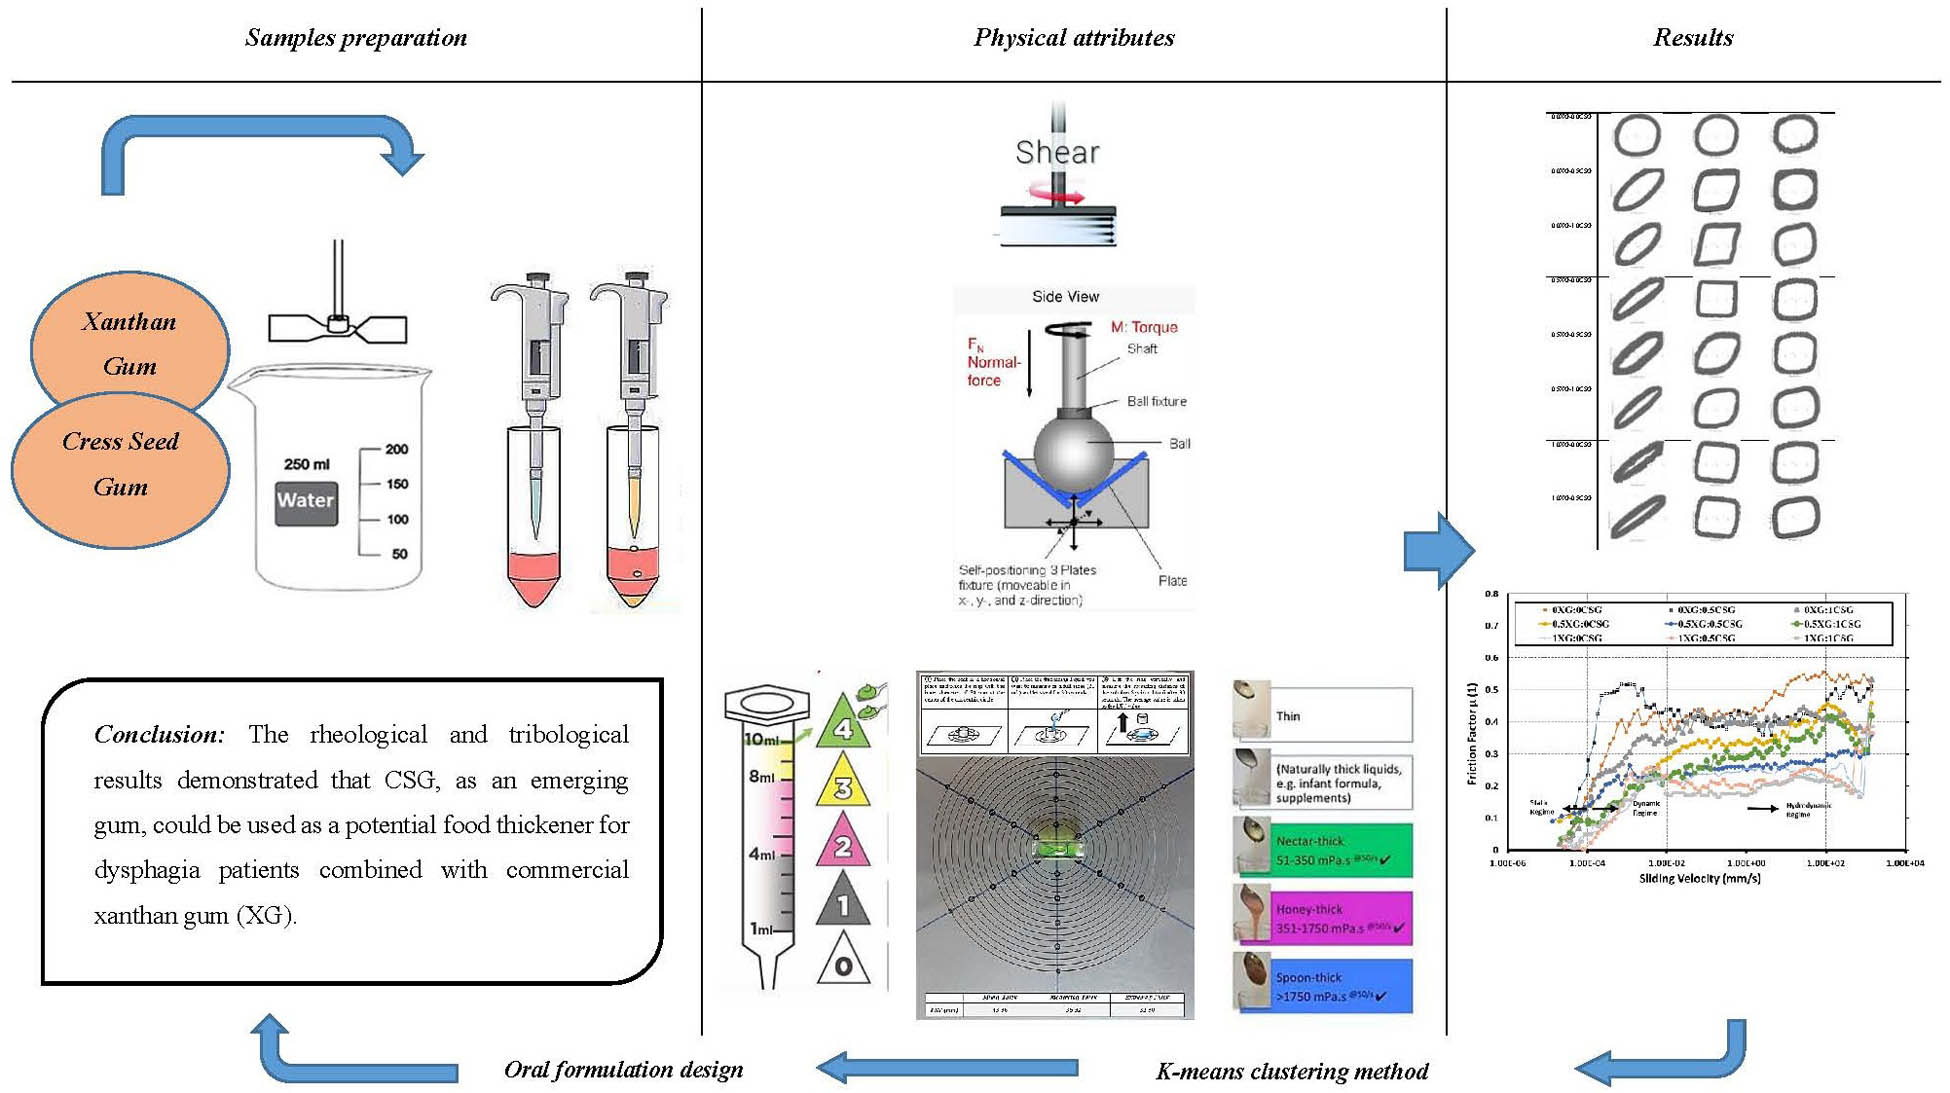
In this study, a new scheme for the classification of thickened-fluids based on xanthan gum-cress seed gum was developed. For this purpose, the mechanical characteristics, including steady shear, small amplitude oscillatory shear, large amplitude oscillatory shear, and tribological parameters, were measured and classified into four clusters using the K-means approach. The findings showed that the first cluster contained the highest coefficient of friction value (0.529 ± 0.008), and the fourth cluster comprised the highest consistency coefficient (19.42 ± 0.01 Pa s n ), strain-stiffening ratio (0.42 ± 0.01), yield stress (28.61 ± 0.10 Pa), and frequency dependency of viscous modulus (12.18 ± 0.02). The results also indicated that the classification of in vitro thickened liquid characteristics could be developed based on the interconnection between tribology and rheology. The presented methodology is capable of comparison of test results across the International dysphagia diet standardization initiative and line-spread test.
Graphical abstract
1 Introduction
The use of thickened fluids is one of the most effective ways to manage and treat dysphagia [1,2,3,4]. Thickened fluids flow slowly, thereby strengthening weak swallowing muscles and allowing people to have better oral and pharyngeal synchronization [5,6,7], reducing the transition speed of fluid flow [8], and preventing aspirations of the bolus into the lungs [9]. Selecting a suitable thickener seems to be important for managing dysphagia as a compensatory therapeutic strategy against aspiration [4,10,11]. Therefore, discovering new sources of thickeners with appropriate functional features for dysphagia diet products is very attractive.
In the present study, the authors focused on investigating the potential of using cress seed gum (CSG) and xanthan gum (XG) as thickeners for managing dysphagia in patients. CSG, an emerging natural hydrocolloid with a galactomannan macromolecular component, exhibited interesting physicochemical and functional properties that make it an appealing candidate as an alternative food ingredient [12,13]. Its unique properties, such as its viscosity-enhancing and stabilizing abilities, make it a promising functional additive [12,13]. On the other hand, XG, a well-established thickener extensively studied in the context of dysphagia diets, demonstrated notable rheological properties, such as high viscosity and pseudoplastic behavior, which are crucial for facilitating swallowing and minimizing the risk of aspiration [14,15,16,17]. Previous research has also documented synergistic interactions between XG and galactomannans like CSG within food systems [18]. These interactions result in increased viscosity or gelation, depending on the specific pattern and degree of substitution among the galactomannans. This finding provides an opportunity to develop novel thickened liquids tailored to address the nutritional requirements and swallowing challenges faced by dysphagia patients. By leveraging the distinct physicochemical properties of XG and CSG, the aim of the authors was to formulate an optimized thickened liquid product that effectively meets the needs of dysphagia management.
Existing methods including the line-spread test (LST) and International dysphagia diet standardization initiative test (IDDSI) are based on very simple flow tests that do not allow for integration of the complexity of the flow and friction properties of the food bolus. IDDSI methods were designed to meet an important clinical and scientific need by providing a common language for describing the foods and liquids prescribed for the treatment of dysphagia as well as readily accessible assessment techniques for classifying these substances. However, the studies revealed that the IDDSI tests for evaluating food texture have not been approved for use in clinical settings and have not offered any scientific or clinical support for the notion that it is possible to classify liquids in response to significant changes in swallowing performance. To demonstrate the IDDSI flow test’s scientific validity, it is desirable to investigate its metrological characteristics. Also, previous works demonstrated that further studies are needed to compare different instruments and sensory and rheological parameters, as well as a larger range of foods and beverages [19,20]. It is, therefore, quite useful to move towards more comprehensive approaches. It is believed that viscoelasticity and interacting friction play important roles in bolus swallowing [21].
On the other hand, optimization of viscoelastic parameters is essential for the design of different foods for patients with dysphagia [16]. This provides a research challenge to develop and design products with suitable characteristics to meet the nutritional requirements of patients. Notwithstanding research advances in expressing rheological properties of modified texture foods for dysphagia management, there are few published papers about the evaluation of rheological (steady shear, small amplitude oscillatory shear; SAOS, large amplitude oscillatory shear; LAOS) and tribological characteristics of thickened liquids as well as the classification of different thickness levels (TL). Moreover, tribological properties of texture-modified foods are still not well-characterized in recent works [22], and the findings reveal a need for further studies on this subject to create an interconnection between these properties and actual oral sensations. Regarding the lack of enough rheological/tribological information in describing oral sensations and swallowing properties of thickened liquids used for dysphagia, there are growing interests in these approaches to efficiently understand the mouthfeel and swallowing aspects of food texture. Based on the aforementioned aspects, it was assumed that CSG, in combination with the XG, exhibits unique physicochemical properties, which can be used as a thickened liquid in the dietary formulation of dysphagia patients. Therefore, the aim of this work is to first evaluate the bulk and surface behaviors of thickened liquids during the swallowing process using rheological (steady shear, SAOS, and LAOS) and tribological experiments, and then to propose a new scheme for their classification based on the measured characteristics in comparison with common methods like LST and IDDSI tests.
2 Materials and methods
2.1 Materials
In this research, XG and synthetic saliva were purchased from Sigma (Spain) and Laboratorios KIN (Spain), respectively. The synthetic saliva contains 1% xylitol (that acts as a lubricant, hydrating and refreshing the oral mucosa immediately) and mineral salts (potassium chloride, sodium chloride, calcium chloride, magnesium chloride, potassium dihydrogen phosphate, potassium thiocyanate, sodium saccharin, other excipients). CSG was extracted under the optimal conditions (at 35°C, pH = 7, water:seed ratio of 30:1, and soaking for 15 min) based on the method presented by Karazhiyan et al. [23]. Afterward, the crude hydrocolloid extract was dried at 35°C in an oven with forced air circulation (Kimia Pars Co., Iran). In the last stage, the dried CSG was milled, sifted, and stored in a refrigerator (4°C) for further measurements.
2.2 Thickened fluids preparation
Dispersions of CSG and XG at different concentrations (0.0, 0.5, and 1 w/w%) and their mixtures in three blending ratios (1:0, 1:1, and 0:1) were prepared [24]. The gums at the specified concentrations and blending ratios were mixed with 100 g of de-ionized water using a magnet stirrer at ambient temperature (25°C) for approximately 2 h. Subsequently, the mixture was further stirred on a roller mixer (Hematology Cell Mixer, Iran) overnight. During the experiment, 1 mL of synthetic saliva was added to each 10 mL sample and mixed for 10 s [25]. It is important to note that all the tests described below were conducted at a temperature of 37°C.
2.3 LST
The LST method was used to evaluate the viscosity of the samples by measuring the fluid flow distance (mm) on a flat surface. It should be noted that this method has been used to classify fluids to manage dysphagia into different consistencies in Japan [26]. According to the Watanabe et al. [26] approach, a cylindrical container (35 mm in diameter and 50 mm in height) was centrally positioned on a plastic surface with concentric circles (Figure 1). Each sample (20 mL) was poured into a cylindrical container and rested for 30 s. Then, the container was removed, and the traveled distances by each sample after 30 s of movement on the plastic surface from the six points were measured (Figure 1). Then, the average reading distance was taken as the fluid viscosity index. Based on the classification method proposed by Paik et al. [27], the average distance of a fluid (mm) on a flat surface and ranges of the suitable samples for each category were as follows: thin thick (more than 51 mm), slightly thick (43–51 mm), mildly thick (36–43 mm), moderately thick (32–36 mm), and extremely thick (30–32 mm). The measurements were repeated three times for each sample.

The LST applied for the 1.0XG-1.0CSG sample.
2.4 IDDSI flow test
The IDDSI test was performed to measure the flow characteristics of the XG-CSG thickened fluids [28]. For this purpose, the 10 mL Becton Dickinson syringe (BDTM syringe) outlet nozzle was closed to prevent flow [29]. Afterward, the nozzle was opened for 10 s (Figure 2). Finally, the nozzle end was cut off to stop the flow after 10 s, and the remaining amount inside the syringe (mL) was read. In these steps, a digital video camera (Canon EOS 90D, 32.5 megapixels) was utilized to record flow velocity and follow the flow through the syringe over time. The volume of residue was recorded at 1 s intervals. The classification provided by Yokote et al. [30] was utilized to classify the samples based on the volume of remaining residue (mL). According to this classification system, four levels were identified. Samples that entirely remained in the syringe were categorized as thin (level 0). For slightly thick samples (level 1), the volume of residue ranged from 1 to 4 mL. Mildly thick samples (level 2) had a residue volume between 4 and 8 mL, while moderately thick samples (level 3) had a residue volume exceeding 8 mL. Extremely thick samples (level 4) were unable to flow through a 10 mL syringe within a 10 s timeframe.
![Figure 2
The IDDSI flow test approach [29] applied for the 0.0XG-1.0CSG sample.](/document/doi/10.1515/arh-2023-0102/asset/graphic/j_arh-2023-0102_fig_002.jpg)
The IDDSI flow test approach [29] applied for the 0.0XG-1.0CSG sample.
2.5 Rheological tests
Steady and dynamic shear rheological measurements of the thickened liquid samples were conducted using a rheometer instrument from Anton Paar (MCR301, Graz, Austria) equipped with cone-plate geometry (diameter: 40 mm, cone angle: 4°, and gap: 0.206 mm), and a coaxial cylinder system (cup diameter: 22.16 mm and bob diameter: 21.00 mm) at 37°C and in the presence of saliva (under the simulated oral condition). The coaxial cylinder system was used for 0.0XG-0.0CSG and 0.0XG-0.5CSG samples (low viscosity solutions), and the cone-plate geometry was used for the other samples. A Peltier plate system kept the temperature constant with ± 0.01°C accuracy. Also, the samples were coated with a silicone oil thin film to prevent any evaporation during the experiment. Then, each sample was allowed to remain at this temperature for 30 s before each experiment to achieve temperature equilibrium. All rheological experiments were done in three replicates. The rheological parameters were determined by Rheoplus 32 software (v3.40) and MATLAB framework program (2016a). Strain and stress waveform data were analyzed using the MITlaos program (Version 2.1 beta, freeware distributed from MITlaos@mit.edu).
2.5.1 Steady shear rheological measurements
The flow behavior of the samples was evaluated in the shear rate ranging from 0.1 to 100 s−1 [31]. In accordance with the findings of Yamagata et al. [32], it has been documented that a maximum safe swallowing shear rate of 100 s−1 is applicable, particularly in cases of dysphagia among elderly individuals and during muscle-driven swallowing actions. The shear stress-shear rate data were fitted by the Herschel-Bulkley model (equation (1)) and Cross model (equation (2)) as follows:
where τ (Pa) is the shear stress,
2.5.2 SAOS measurements
Stress sweep tests were carried out in the stress amplitude ranging from 0.01 to 100 Pa at a constant frequency of 1 Hz. These tests aimed to determine three critical parameters: the limit of the linear viscoelastic region (LVE), denoted as the point at which the slope of the elastic modulus-stress curve started to decrease; the yield stress at the critical point (
where
2.5.3 LAOS test
The LAOS test was performed to evaluate the nonlinear rheological behaviors qualitatively using Lissajous-Bowditch plots and nonlinear strain waveforms analysis. For this purpose, strain sweep experiments were performed in the strain amplitude range between 0.10 and 1,000% at 37°C and 1 Hz. Also, the nonlinear viscoelastic rheological properties were described quantitatively using the shear-thickening ratio (S) and strain-hardening ratio (T) as follows:
where
2.6 Tribological measurements
Tribological measurements were conducted on a Physica MCR 301 tribometer (Anton Paar, Graz, Austria) at 37°C using a ball-on-three-pins test configuration. The tribopair in this setup consisted of a rotating glass ball (12.7 mm diameter) and three stationary cylindrical polydimethylsiloxane pins (6 mm diameter and height) that are fixed into the sample holder. Each sample was placed on the plate, and then the upper tool was reduced to a 1 N normal force for each tribological test. The in-mouth force was estimated to be about 0.01–10 N during oral processing [36]. Afterward, the friction factors were measured when the sliding speed was logarithmically raised from 0.1 to 1,000 mm/s. The speed of the human tongue has been assessed in the range of 10–200 mm/s [37]. All tribological tests were performed in at least three replicates. Sliding speed (
where
2.7 Data analysis
A full-randomized design was performed through the SPSS software (version 16, SPSS Inc., USA). The data were evaluated using analysis of variance (ANOVA) at a confidence level of 95%, and the Tukey test was used to compare the mean values. Using NCSS software (the USA, 2023), all of the rheological and tribological data were grouped using the K-means clustering method [38]. In this study, an interactive process was utilized to compare the Euclidean distances (equation (10)) between each subject and each cluster center. To determine the optimal value of k, the elbow curve method was employed as a standard approach. The data clustering was then performed using this method, dividing the samples into n groups, with the objective of minimizing the within-cluster sum-of-squares criterion (equation (11)) and achieving equal variances among the clusters. This methodological approach allowed for the identification of a suitable number of clusters and yielded meaningful insights from the clustering results.
where
3 Results and discussion
3.1 LST properties
The LST provides information about modified liquid consistency by visually representing flow distance across a flat surface [39]. The implication for use with thickened liquids is that thinner liquids (e.g., modified to a nectar-thick consistency) flow a further distance in comparison to thicker liquids (e.g., honey-like consistency). The results of the LST test are shown in Table 1. Thickened water samples were observed to spread in the circumferential direction. In the present study, the LST values of different samples were between 56.08 and 26.25 mm, which were changed significantly (p < 0.05) by increasing the concentration of CSG and XG up to 1% (Table 1). Nicosia and Robbins [40] stated that the LST values for 50 mL of powder-thickened fruit juices (1 min removed time) varied from 24.9 to 120.4 mm. A line-spread distance of less than 50 mm represents liquids like honey, and a line-spread distance of more than 50 mm indicates nectar like liquids. Kim et al. [41] studied the influence of removal time (5 and 30 min) and different concentrations of an XG-based thickener (1.0–3.5%) on the LST values. Their results showed that the magnitude of LST varied from 45.0 to 87.8 mm and 37.5 to 76.6 mm at removed times of 5 and 30 min, respectively. Also, in another study reported by Kim et al. [42], the LST values were in the range of 36.7–76.0 mm. The difference in the values of a line-spread distance may be because of the sample type and volume used, for e.g., a volume of 20 mL was used to perform the LST test in the current study, while a volume of 50 mL was applied in Kim et al. [42] studies.
LST and IDDSI flow test results of XG-CSG thickened fluids (37°C)
| Samples | LST (mm) | LST level | IDDSI (mL) | IDDSI level |
|---|---|---|---|---|
| 0.0XG-0.0CSG | 56.08a ± 0.05 | 0 | 0.0g ± 0.2 | 0 |
| 0.0XG-0.5CSG | 48.08b ± 0.02 | 1 | 0.9f ± 0.1 | 1 |
| 0.0XG-1.0CSG | 42.08c ± 0.03 | 2 | 4.0e ± 0.1 | 2 |
| 0.5XG-0.0CSG | 38.75e ± 0.01 | 2 | 7.5d ± 0.1 | 2 |
| 0.5XG-0.5CSG | 37.41e ± 0.01 | 2 | 9.0c ± 0.1 | 3 |
| 0.5XG-1.0CSG | 34.09f ± 0.02 | 3 | 9.9a ± 0.2 | 3 |
| 1.0XG-0.0CSG | 32.00g ± 0.05 | 3 | 9.8a ± 0.2 | 3 |
| 1.0XG-0.5CSG | 28.83g ± 0.01 | 4 | 9.6b ± 0.3 | 3 |
| 1.0XG-1.0CSG | 26.08h ± 0.04 | 4 | 10a ± 0.03 | 4 |
XG, xanthan gum; CSG, cress seed gum; IDDSI (mL) means the amount of the sample that remained in the syringe after the test; LST (mm) is the average distance of the sample (mm) on a flat surface after the test.
a–h: Mean of values in the same column followed by different superscript letters are significantly different (p < 0.05) from each other.
3.2 IDDSI flow properties
The IDDSI flow test is used as a system accessible for caretakers to classify viscosity levels of products based on the flow speed inside the syringe [43,44]. As demonstrated in Figure 3, the flow of the samples exiting through the syringe reduced with the increase in CSG and XG concentration. The combination of CSG and XG had a considerable impact on the IDDSI results of the samples (p < 0.05). The samples were classified as follows according to the IDDSI test, as shown in Table 1: Water sample was placed in level 0, 0.5% CSG was put in level 1, 1% CSG and 0.5% XG were located in level 2, 1% CSG and 1% XG were included in level 4, and the remaining samples were posited in level 3. The comparison of the LST and IDDSI results (Table 1) shows that the classifications of the thickened liquids were very similar, irrespective of their difference in the two cases. The 0.5XG-0.5CSG sample was placed at level 3 in the IDDSI flow test but it was posited at level 2 in the LST. Also, the 1.0XG-0.5CSG sample was located at level 3 in the IDDSI flow test but it was included at level 4 in the LST.

The flow speed of the XG-CSG thickened dispersions according to the IDDSI flow test.
3.3 Rheological properties
3.3.1 Steady shear flow behavior
The physical properties of thickened fluids affect the behavior of bolus in swallowing. In this regard, the viscosity of fluids is generally assessed to examine variations in the flow properties of products. However, the thickened fluids used for dysphagia patients exhibit non-Newtonian behavior, so the non-Newtonian rheological properties should be investigated to describe the swallowing behavior precisely (Figure 4a). The models were evaluated using the statistical parameters of R-squared (R
2), and root mean square error (RMSE). The best models were selected based on the highest R
2 and the lowest RMSE values. The rheological properties determined based on the Herschel–Bulkley model are shown in Table 2. As demonstrated, except for the 0.0CSG-0.0XG sample, all samples behaved as shear thinning non-Newtonian fluids (n < 1). The consistent superiority of the 0.5% XG concentration in terms of R
2 and RMSE values suggests that this specific concentration might have a more favorable impact on the rheological properties of the samples. It implies that 0.5% XG could potentially offer better control over viscosity and enhance the desired textural characteristics required for thickened liquids in dysphagia management. Farhoosh and Riazi [45] stated that flow behavior index (n) values are associated with a sensation of sliminess in the mouth. According to the definition of sliminess, there is a relationship between organoleptic sliminess and the degree of viscosity reduction with an increasing rate of shear. The faster the solution loses viscosity while being rotated by the tongue, the more quickly and easily it can be swallowed. It is more challenging to swallow when the viscosity changes in the mouth more slowly. The degree of particle dispersion, molecular weight, molecular shape, the strength of intermolecular interactions, and other characteristics of various gums are unquestionably responsible for their varied behaviors [46]. The results of the study by Nishinari et al. [47] showed that the risk of aspiration depended on the degree of shear thinning and viscosity of the test boluses (polysaccharide solutions). The values of consistency coefficient (

(a) Viscosity (η) and shear stress (τ) of the 1.0XG-1.0CSG sample at the shear rate range of 0.01–100 1/s. (b) Stress sweep dependency of the storage modulus (G') and loss modulus (G'') of the 1.0XG-1.0CSG sample at the range of 0.01–100 Pa at a constant frequency of 1 Hz. (c) Frequency sweep dependency of the storage modulus (G') and loss modulus (G'') of the 1.0XG-1.0CSG sample at the frequency range of 0.01–100 Hz and a constant stress amplitude of 0.1 Pa.
Herschel–Bulkley model (0.1–100 s−1) parameters, apparent viscosity (50 s−1) values, and the NDD classification levels of the XG-CSG thickened fluids (T = 37°C)
| Treatments |
|
|
|
|
R 2 | RMSE | NDD level |
|---|---|---|---|---|---|---|---|
| 0.0XG-0.0CSG | 0.006h ± 0.010 | 0.99a ± 0.01 | 0.003h ± 0.001 | 1.0h ± 0.1 | 0.95 | 0.10 | Thin |
| 0.0XG-0.5CSG | 0.030h ± 0.200 | 0.91a ± 0.01 | 0.029g ± 0.002 | 9.7h ± 0.3 | 0.99 | 0.20 | Thin |
| 0.0XG-1.0CSG | 0.154g ± 0.010 | 0.56b ± 0.01 | 0.595f ± 0.001 | 31.2g ± 1.0 | 0.97 | 0.13 | Thin |
| 0.5XG-0.0CSG | 4.508f ± 0.010 | 0.17c ± 0.01 | 0.172e ± 0.003 | 160.8f ± 4.2 | 0.99 | 0.05 | Nectar-like |
| 0.5XG-0.5CSG | 6.756e ± 0.010 | 0.17a-c ± 0.01 | 0.511d ± 0.003 | 209.2e ± 2.0 | 0.97 | 0.08 | Nectar-like |
| 0.5XG-1.0CSG | 7.399d ± 0.040 | 0.19c ± 0.01 | 0.953c ± 0.002 | 289.4d ± 3.6 | 0.98 | 0.04 | Nectar-like |
| 1.0XG-0.0CSG | 12.240c ± 0.010 | 0.15c ± 0.01 | 1.791b ± 0.011 | 422.1c ± 6.1 | 0.98 | 0.09 | Honey-like |
| 1.0XG-0.5CSG | 17.460b ± 0.060 | 0.12d ± 0.01 | 1.561b ± 0.006 | 466.5b ± 5.1 | 0.99 | 0.14 | Honey-like |
| 1.0XG-1.0CSG | 19.420a ± 0.010 | 0.10d ± 0.01 | 2.852a ± 0.010 | 663.0a ± 5.8 | 0.95 | 0.16 | Honey-like |
k is the consistency coefficient,
XG, xanthan gum; CSG, cress seed gum.
a–h: Mean of values in the same column followed by different superscript letters are significantly different (p < 0.05) from each other.
The macromolecular composition of CSG is galactomannan [12,13]. It was shown that there is a synergistic interaction between XG and galactomannan [18], which leads to an increase in yield stress (stabilizing effect) and consistency coefficient (thickening effect) of the prepared solutions. Galactomannans have a mannose backbone with single-unit galactose side chains that partially replace them. The different degrees and patterns of galactomannans affect the number of their interactions with XG. Increased viscosity, and consequently high cohesiveness in the product, because of the strong resistance to deformation, makes it difficult to swallow in people with weak tongue muscles [50]. On the other hand, the NDD, published in 2002 by the American Dietetic Association, with the aim of creating standard terms and applying texture-modified-diets in the therapy of dysphagia [51], classified thickened liquids based on steady-state rheological properties, specifically their viscosity at a shear rate of 50 (1/s) [56,57]. Suppose the viscosity is between 1 and 50 mPa s, it is placed in the category of thin, if this parameter is in the range from 51 to 350 mPa s, it is located in the nectar-like category, and if the viscosity is in the range of 351 to 1,750 mPa s, it is set in the category of honey-like, and in the cases where the viscosity is more than 1,750 mPa s, it should be in the spoon-thick category. The data shown in Table 2 were leveled based on the NDD classification. The results showed that all levels of CSG in the absence of xanthan were classified in the thin level, with 0.5% xanthan in the nectar-like level, and with the presence of 1% xanthan in the honey-like level.
The rheological parameters determined based on the Cross model are given in Table 3. In this research, the values of zero-shear viscosity (η 0) and infinite-shear viscosity (η ∞) were raised by increasing the amounts of selected thickeners. In the study by Kapoor et al. [58] on galactomannans with large mannose to galactose ratios (M/G), a rapid increase in η 0 indicated a formation of inter-chain interactions. Razmkhah et al. [59] stated that the increased values of zero-shear viscosity could be due to a rise in the sample’s molecular weight. High zero-shear viscosity (η 0) represents the high stiffness of polysaccharide conformation, while high infinite-shear viscosity (η ∞) demonstrates the high consistency of the fluid during swallowing as well as the high energy requirements for the processing [60]. In the Cross model, m corresponds to the degree of shear thinning. If a fluid becomes a Newtonian liquid, the m value is zero, and as the fluid becomes more shear thinning, the m value increases to unity [61].
Cross model parameters of the XG-CSG thickened fluids (0.1–100 s−1, 37°C)
| Treatments |
|
|
|
|
R 2 | RMSE |
|---|---|---|---|---|---|---|
| 0.0XG-0.0CSG | 0.62h ± 0.01 | 0.012h ± 0.011 | 0.16g ± 0.001 | 0.42a ± 0.01 | 0.99 | 0.05 |
| 0.0XG-0.5CSG | 0.91h ± 0.02 | 0.059g ± 0.012 | 0.22g ± 0.002 | 0.40a ± 0.03 | 0.99 | 0.06 |
| 0.0XG-1.0CSG | 35.15g ± 0.01 | 0.121f ± 0.011 | 0.59f ± 0.001 | 0. 53b ± 0.01 | 0.99 | 0.02 |
| 0.5XG-0.0CSG | 72.50f ± 0.01 | 0.268e ± 0.013 | 0.71e ± 0.003 | 0. 62c ± 0.10 | 0.99 | 0.05 |
| 0.5XG-0.5CSG | 101.75e ± 0.01 | 0.273e ± 0.013 | 1.42d ± 0.003 | 0.71d ± 0.02 | 0.99 | 0.09 |
| 0.5XG-1.0CSG | 146.39d ± 0.04 | 0.395d ± 0.012 | 2.95c ± 0.002 | 0.92e ± 0.06 | 0.99 | 0.05 |
| 1.0XG-0.0CSG | 163.44c ± 0.01 | 0.451c ± 0.013 | 3.79b ± 0.011 | 0.82f ± 0.02 | 0.99 | 0.04 |
| 1.0XG-0.5CSG | 195.45b ± 0.06 | 0.521b ± 0.005 | 3.56b ± 0.006 | 0.87g ± 0.01 | 0.99 | 0.12 |
| 1.0XG-1.0CSG | 262.32a ± 0.01 | 0.601a ± 0.010 | 4.85a ± 0.010 | 0.95h ± 0.03 | 0.99 | 0.10 |
XG, xanthan gum; CSG, cress seed gum; R 2, coefficient of determination; RSME, root square mean error.
a–h: Mean of values in the same column followed by different superscript letters are significantly different (p < 0.05) from each other.
The inverse of relaxation time (1/
3.3.2 SAOS rheology
The SAOS test may be an effective tool for understanding the relationship between microstructure and viscoelastic properties of foods and providing information that plays important roles in mechanical behavior and sensory perception [64]. Linear viscoelastic tests, such as SAOS, are performed using small strain amplitudes and are non-destructive in nature [65]. However, it should be noted that these tests have limitations in characterizing complex fluids with diverse structures due to their limited resolution. In this section, the linear viscoelastic properties of the samples are evaluated by the stress sweep and frequency sweep tests.
3.3.2.1 Stress sweep rheological properties
Stress sweep measurement is suggested to assess the change in fluid flow properties during pharyngeal swallowing. The stress sweep was performed to identify the limit of the LVE as well as the values of the elastic modulus (
Stress sweep test results of the XG-CSG thickened fluids (τ = 1–300 Pa,
| Treatments |
|
|
|
|
|
|---|---|---|---|---|---|
| 0.0XG-0.0CSG | 0.00h ± 0.0 | 0.10g ± 0.05 | — | — | — |
| 0.0XG-0.5CSG | 7.5g ± 0.02 | 7.32f ± 0.02 | 1.96g ± 0.02 | 0.42h ± 0.02 | 0.95a ± 0.02 |
| 0.0XG-1.0CSG | 12.1f ± 0.03 | 7.13d ± 0.03 | 5.75e ± 0.03 | 2.25g ± 0.03 | 0.41b ± 0.03 |
| 0.5XG-0.0CSG | 11.9f ± 0.01 | 2.88e ± 0.01 | 1.87g ± 0.01 | 6.42f ± 0.01 | 0.41b ± 0.01 |
| 0.5XG-0.5CSG | 32.4e ± 0.01 | 7.25d ± 0.01 | 4.20f ± 0.01 | 8.92e ± 0.01 | 0.29c ± 0.01 |
| 0.5XG-1.0CSG | 46.1d ± 0.02 | 15.9b ± 0.02 | 12.21c ± 0.02 | 12.72d ± 0.02 | 0.24e ± 0.02 |
| 1.0XG-0.0CSG | 58.5c ± 0.11 | 8.28c ± 0.05 | 10.70d ± 0.05 | 17.81c ± 0.05 | 0.26d ± 0.05 |
| 1.0XG-0.5CSG | 70.3b ± 0.12 | 15.4b ± 0.11 | 15.32b ± 0.11 | 18.10b ± 0.10 | 0.22f ± 0.12 |
| 1.0XG-1.0CSG | 219.0a ± 0.15 | 43.6a ± 0.13 | 28.61a ± 0.10 | 35.30a ± 0.12 | 0.19g ± 0.11 |
XG, xanthan gum; CSG, cress seed gum.
a–h: Mean of values in the same column followed by different superscript letters are significantly different (p < 0.05) from each other.
The yield stress at the critical point (
3.3.2.2 Frequency sweep rheological properties
Based on the mechanical spectra from the frequency sweep test, different types of dispersions can be divided into four classes: (1) dilute solution, (2) concentrated solution, (3) weak gel, and (4) strong gel [71]. As shown in Figure 4(c), the elastic modulus (
The rheological parameters of frequency sweep from the power-law equations are represented in Table 5. It can be seen that the
Frequency sweep test (0.01–100 Hz) results of the XG-CSG thickened fluids (
| Treatments |
|
|
|
||||||
|---|---|---|---|---|---|---|---|---|---|
|
|
|
R 2 |
|
|
R 2 |
|
|
R 2 | |
| 0.0XG-0.0CSG | 2.19h ± 0.05 | 0.85a ± 0.02 | 0.95 | 0.02h ± 0.0 | 0.87a ± 0.08 | 0.97 | 2.19h ± 0.0 | 1.19h ± 0.0 | 0.95 |
| 0.0XG-0.5CSG | 2.65h ± 0.02 | 0.76b ± 0.02 | 0.99 | 1.20g ± 0.02 | 0.71a ± 0.02 | 0.95 | 2.20h ± 0.02 | 2.19g ± 0.02 | 0.99 |
| 0.0XG-1.0CSG | 4.65g ± 1.03 | 0.19c ± 0.01 | 0.99 | 1.60g ± 0.03 | 0.33b ± 0.03 | 0.98 | 4.98g ± 0.53 | 3.89f ± 0.33 | 0.99 |
| 0.5XG-0.0CSG | 6.98f ± 0.01 | 0.21d ± 0.01 | 0.99 | 5.20f ± 0.01 | 0.29b ± 0.01 | 0.90 | 6.26f ± 0.01 | 5.22e ± 0.01 | 0.99 |
| 0.5XG-0.5CSG | 16.50e ± 0.01 | 0.14e ± 0.03 | 0.99 | 5.62e ± 0.01 | 0.21c ± 0.01 | 0.93 | 18.27e ± 0.01 | 6.20d ± 0.01 | 0.99 |
| 0.5XG-1.0CSG | 21.15d ± 0.02 | 0.15e ± 0.02 | 0.99 | 7.61d ± 0.02 | 0.21c ± 0.02 | 0.95 | 21.61d ± 0.02 | 6.52d ± 0.02 | 0.99 |
| 1.0XG-0.0CSG | 41.60c ± 0.01 | 0.12f ± 0.01 | 0.99 | 10.86c ± 0.01 | 0.16e ± 0.01 | 0.95 | 40.22c ± 0.01 | 7.87c ± 0.01 | 0.99 |
| 1.0XG-0.5CSG | 47.09b ± 0.01 | 0.10g ± 0.02 | 0.99 | 11.21b ± 0.01 | 0.18e ± 0.01 | 0.95 | 46.71b ± 0.01 | 7.98b ± 0.01 | 0.99 |
| 1.0XG-1.0CSG | 52.12a ± 0.02 | 0.08h ± 0.02 | 0.99 | 12.18a ± 0.02 | 0.16e ± 0.02 | 0.90 | 52.18a ± 0.02 | 8.36a ± 0.02 | 0.99 |
XG, xanthan gum; CSG, cress seed gum.
a–h: Mean of values in the same column followed by different superscript letters are significantly different (p < 0.05) from each other.
3.3.3 LAOS rheology
The LAOS test provides information regarding materials with a complex microstructure that cannot be obtained with conventional rheological tests [78]. The LAOS rheology gives a deeper insight into structural changes in actual processing conditions. In recent years, attention has been extensively paid to the LAOS technique to investigate the rheological behavior of complex fluids, particularly hydrocolloids. The S and T parameters to analyze the intracycle elastic and viscous nonlinearities are shown in Table 6. Intracycle strain-stiffening behavior corresponds to
Elastic and viscous parameters of the XG-CSG thickened liquids at different ratios and strains in LAOS domains (T = 37°C)
| Treatments | Strain (%) |
|
|
|---|---|---|---|
| 0.0XG-0.0CSG | 10 | −0.00gA ± 0.00 | 0.00aA ± 0.00 |
| 100 | 0.00gA ± 0.00 | 0.00aA ± 0.00 | |
| 1,000 | 0.00gA ± 0.00 | 0.00aA ± 0.00 | |
| 0.0XG-0.5CSG | 10 | −0.00gC ± 0.00 | 0.00aA ± 0.00 |
| 100 | 0.05fB ± 0.00 | −0.04bB ± 0.00 | |
| 1,000 | 0.09dA ± 0.00 | −0.10cC ± 0.00 | |
| 0.0XG-1.0CSG | 10 | −0.00gC ± 0.00 | 0.00aA ± 0.00 |
| 100 | 0.09dB ± 0.01 | −0.07cB ± 0.01 | |
| 1,000 | 0.13deA ± 0.01 | −0.16fC ± 0.01 | |
| 0.5XG-0.0CSG | 10 | −0.00cC ± 0.00 | 0.00aA ± 0.00 |
| 100 | 0.10dB ± 0.00 | −0.08cB ± 0.00 | |
| 1,000 | 0.13deA ± 0.00 | −0.15fC ± 0.00 | |
| 0.5XG-0.5CSG | 10 | −0.00gC ± 0.00 | 0.00aA ± 0.00 |
| 100 | 0.15dB ± 0.00 | −0.10eB ± 0.00 | |
| 1,000 | 0.23cA ± 0.00 | −0.20gC ± 0.00 | |
| 0.5XG-1.0CSG | 10 | −0.00gC ± 0.00 | 0.00aA ± 0.00 |
| 100 | 0.18dB ± 0.00 | −0.12eB ± 0.00 | |
| 1,000 | 0.29bA ± 0.00 | −0.30hC ± 0.00 | |
| 1.0XG-0.0CSG | 10 | −0.01gC ± 0.01 | 0.00aA ± 0.01 |
| 100 | 0.20cB ± 0.01 | −0.14fB ± 0.01 | |
| 1,000 | 0.34aA ± 0.01 | −0.35hC ± 0.01 | |
| 1.0XG-0.5CSG | 10 | −0.01gC ± 0.00 | 0.00aA ± 0.00 |
| 100 | 0.24cB ± 0.01 | −0.18gB ± 0.01 | |
| 1,000 | 0.38aA ± 0.01 | −0.39iC ± 0.01 | |
| 1.0XG-1.0CSG | 10 | −0.01gC ± 0.00 | 0.00aA ± 0.00 |
| 100 | 0.31bB ± 0.01 | −0.21gB ± 0.01 | |
| 1,000 | 0.42aA ± 0.01 | −0.42iC ± 0.01 |
XG, xanthan gum; CSG, cress seed gum.
a–i, and A–C: Mean of values in the same column followed by different superscript letters are significantly different (p < 0.05) from each other.
Lissajous-Bowditch plots at strain percentages of 10, 100, and 1,000 are shown in Figure 5. These curves represent normalized shear stress and normalized shear strain (or shear rate) at the three strain percentages. The elliptical shape of plots for all samples except 0.0XG-0.0CSG at 10% strain exhibited ideal viscoelastic behavior. The plot shape of 0.0XG-0.0CSG was close to a circle and showed that the sample has linear viscous behavior. In higher strain (100 and 1,000%) domains, the surface area in Lissajous plots (Figure 5) increased with the increase in strain, indicating a change from elastic to viscous behavior. The Lissajous plot (closed-loop) area is an indication of energy loss [80]. At 100% strain, the samples were classified into three different shapes of rectangular (0.5XG-0.0CSG and 1.0XG-0.0CSG), parallelogram (0.0XG-0.5CSG and 0.0XG-1.0CSG), and elliptical (0.5XG-0.5CSG, 0.5XG-1.0CSG). Hyun et al. [80] stated that the rectangular shape in waveform analysis is related to a close-packed (cubic) array of micelles in the polymer network. These findings indicated that XG had fewer branches than CSG, but CSG had a more close-packed array in its structure. The rheological results reported by Alghooneh et al. [35] indicated that CSG is almost linear due to the high M/G ratio (8.2) [23]. According to the study by Lochhead [81], XG is a branched polysaccharide. The results were in agreement with the reported findings of Razavi et al. [50]. At a strain of 1,000%, the rectangular shape of the Lissajous plots showed a shear thinning and gel-like behavior of the samples [82]. Figure 5 also shows that the shape of the plots changed from the ellipse to the parallelogram, and the samples tended to become square as the strain increased.


Lissajous curves of the XG-CSG thickened liquids at different ratios in 10, 100, and 1,000% strain (f = 1 Hz, T = 37°C).
3.4 Tribological properties
Tribology is one of the interesting methods in food science that has been highlighted to understand the swallowing process in patients with swallowing disorders. Oral tribology deals with the oral process during food consumption that provides knowledge of how the bolus behaves during swallowing [83]. Taste perception is anticipated to be influenced by the high shear rates experienced by the material as it is confined to very thin films and mass transfer close to the oral surfaces, whereas initial thickness/viscosity perception may be governed by relatively low shear rates in the mouth (e.g., 10–50 s−1). The coefficient of friction in tribological tests is related to some sensory properties such as fattiness, smoothness, and astringency [84,85,86,87]. In the boundary regime, friction happens under high load and low-speed conditions because there is not enough lubricant pressure to separate the surfaces or support the load. In the hydrodynamic regime, a lubricant film is entrained to completely separate the solid surfaces; the thickness of this film depends on the viscosity and entrainment speed. As a result of the high shear rate conditions present there, the friction now depends on the rheological characteristics of the lubricant coating in the contact. Boundary film and bulk lubricant both affect friction in the mixed regime, which sits between boundary and hydrodynamic regimes. When the product film between surfaces is sufficiently thick, the initial behavior of the material, in the in-use process of food goods, may be controlled by its bulk rheological properties. However, it is conceivable that the mixed regime enters because the product is sheared and reduced to a considerably thinner layer after the ingestion process. Surface residue may regulate the boundary lubrication after the product has been removed from the oral cavity. The way the product interacts with saliva should be taken into account at all stages.
The Stribeck curves results from tribology measurements for all samples as shown in Figure 6. Hydrodynamic lubrication depends on viscosity, so the start of the hydrodynamic regime should differ depending on the samples. The results for XG confirm recent work by Blok et al. [88], who concluded that friction coefficients of XG solutions decreased with the increase in the XG concentration. Comparing the results of rheological and tribological properties shows that the friction coefficient decreased with the increase in the viscosity. It seems that the selected biopolymers play the role of lubricant, so with the increase in their concentration, although the viscosity increases, the friction coefficient decreases. De Vicente et al. [89] also observed, in general, that the friction coefficient of XG falls with the increasing concentration of polymer over the whole speed range. In addition, it was shown that as the polymer concentration increases, the friction coefficient in the boundary-to-mixed regime decreases [90,91] in the absence of any strongly adsorbing species. The effect of viscosity on friction coefficient in the boundary and mixed regimes has been described in several studies [83,89,90,92]. For all samples, there is an increase in the coefficient of friction at low speeds, and then the coefficient of friction seems to reach a sort of plateau. It can be seen that for most samples, the friction coefficient did not change with the increase in the speed in the mixed regime, then it decreased at increasing values of the sliding speed in the hydrodynamic regime. The net decay is characteristic of the transition between boundary and mixed lubrication regimes, as demonstrated in Figure 6. The samples of 0.0XG-0.0CSG and 0.0XG-0.5CSG showed the least lubricating and the highest frictional resistance in the intermediate sliding velocity range (mixed regime), while 1.0XG-1.0CSG was the most lubricating. Within the intermediate sliding velocity regime, the curves showed a similar trend. There is also a diluting effect when saliva is added. Saliva is a well-known excellent lubricant, so the friction coefficient of water (0.0XG-0.0CSG) should decrease upon the addition of artificial saliva. However, there was only a minor decrease in friction factor when saliva was added to the sample for all samples (data not shown), which was probably due to the absence of mucin in the composition of artificial saliva. Particularly mucin, a significant component of saliva, has been found to be a strong boundary lubricant [91]. In contrast to the 1.0XG-0.5CSG and 1.0XG-1.0CSG samples, the Stribeck curves for the low concentrations of thickeners showed stick-slip events at intermediate sliding velocities. Based on the aforementioned aspects, a possible explanation for the change in the friction factor could be that the different components in complex biomolecules formed intermolecular interaction products. The results of Vieira et al. [93] demonstrated that the coefficient of friction was decreased with the increase in the XG concentration. In other words, it offered more lubrication capacity at higher concentrations. It was also concluded that the properties of the food matrix and the interactions between the polymers were effective in the lubrication capacity of the sample. The threshold concentration forms a complete barrier against surface contact by forming a layer of particles, and a further increase in threshold concentration and the number of particles does not affect the coefficient of friction [94,95].

The Stribeck curves of the XG-CSG thickened fluids at T = 37°C.
The coefficient of friction at a speed of 40 mm/s and the constant normal force is presented in Figure 7. Some authors stated that to evaluate the sensory properties in the final stage of swallowing, the velocity and normal force should be kept constant, and the coefficient of friction is measured over time [93]. The results of the present study indicated that the lubricating characteristics were influenced by the thickener type and concentration. Nguyen et al. [96] presented that increasing, decreasing, or maintaining the lubricating capacity depends on the concentration and nature of the solution and affects the sensory properties. As the thickeners’ concentration was increased, the coefficient of friction in the boundary-to-mixed regime decreased. The effect of viscosity on friction in the boundary and mixed regimes has been described before [83,89,90,92]. In the presence of XG, a low coefficient of friction and a better lubricating capacity than CSG was observed. The lubricating capacity effect was not pronounced with adding 0.5% CSG to water in our study. Research by Vieira et al. [93] showed that as a result of the high viscosity, flaxseed and xanthan-based thickeners at 3% (w/w) concentration introduced the lowest coefficient of friction. Also, they stated that the thickened solutions’ lubrication capacity might be connected to the properties and food matrix nature, as well as the interactions established with the polymer.

The coefficient of friction of the XG-CSG thickened fluids measured by tribological analysis at a steady-state regime (40 mm/s and T = 37°C). Different letters (a–d) indicate a significant difference (p < 0.05) among the samples.
3.5 Cluster analysis
The goal of data clustering is to create groups of data points with the highest degree of similarity between members of each class and the lowest degree of similarity between members of each class and the other classes [97]. For K-means clustering technique, the elbow curve is first generated to get the optimal value of K. As depicted in Figure 8, the elbow curve analysis was conducted based on the extracted feature groups using K-means clustering. The curve clearly indicates that the optimal K value is 4, suggesting that the given data samples can be effectively grouped into four distinct clusters. Following that, the data were stored and rearranged into four clusters (Table 7). This method is the most efficient method for grouping data points into groups (dividing

The elbow curve analysis using K-means clustering.
Results of the K-means clustering technique in TLs based on rheological (steady shear, SAOS, and LAOS) and tribological (coefficient of friction) properties for the classification of XG-CSG thickened fluids
| Treatments | Cluster | TL of 1st cluster | TL of 2nd cluster | TL of 3rd cluster | TL of 4th cluster |
|---|---|---|---|---|---|
| 0.0XG-0.0CSG | 1 | 0.1491 | 1.4407 | 2.4113 | 4.2067 |
| 0.0XG-0.5CSG | 1 | 0.1491 | 1.1933 | 2.1736 | 3.9949 |
| 0.0XG-1.0CSG | 2 | 1.1392 | 0.4895 | 1.6371 | 3.5185 |
| 0.5XG-0.0CSG | 2 | 1.6238 | 0.4895 | 0.8638 | 2.7501 |
| 0.5XG-0.5CSG | 2 | 0.9956 | 0.3184 | 1.9929 | 2.1577 |
| 0.5XG-1.0CSG | 3 | 2.5933 | 1.4692 | 0.3184 | 1.6838 |
| 1.0XG-0.0CSG | 3 | 2.8086 | 1.6000 | 0.3923 | 1.8695 |
| 1.0XG-0.5CSG | 3 | 3.4472 | 2.2441 | 0.3923 | 1.4335 |
| 1.0XG-1.0CSG | 4 | 4.3581 | 3.2305 | 1.6190 | 0.0000 |
XG, xanthan gum; CSG, cress seed gum.
4 Conclusion
In this research, a new classification based on the rheological and tribological properties of typical thickened liquids used for dysphagia diet, including CSG and XG thickeners, was presented to recommend therapeutic TLs to manage dysphagia. It was found that increasing the viscosity and strain-stiffening ratio values of the thickened liquids reduced the rate of swallowing and the increase in time spent on swallowing, lowering the risk of aspiration. Also, the high lubricating capacity of the selected thickeners can help in the management of dysphagia and prevent the feeling of stickiness. The rheological and tribological results demonstrated that CSG, as an emerging gum, could be used as a potential food thickener for dysphagia patients combined with 0.5 and 1% commercial XG. Moreover, CSG may contribute to developing a more complete formulation of a product aimed at dysphagia patients, hence assisting in the mitigation of the current treatments’ side effects. The findings of the present study can provide a new classification scheme considering the physicochemical characteristics of samples for food manufacturers and researchers to design, produce, and classify diets for people with swallowing difficulties. A desirable thickener for many dysphagia patients, in addition to having potentially great rheological properties, should reduce aspiration and allow for a safe swallow, as well as should be pleasant to drink and have a minimal perceived concentration and unpleasant taste. Therefore, additional research in the field of sensory evaluation will be needed to select the best thickening compounds that minimize undesirable properties when mixed with beverages.
-
Funding information: This work was supported by grants from the Ferdowsi University of Mashhad (Grant No. 50597) and the Iran National Science Foundation (INSF) (Grant No. 96015540). The financial supports are gratefully acknowledged.
-
Author contributions: P.P – conceptualization, methodology, investigation, data curation, formal analysis, writing – original draft, revising the manuscript; S.M.A.R – supervision, project administration, funding acquisition, conceptualization, validation, review, editing & revising the manuscript.
-
Conflict of interest: Authors state no conflict of interest.
-
Ethical approval: The conducted research is not related to either human or animal use.
-
Data availability statement: The datasets generated during and/or analyzed during the current study are available from the corresponding author on reasonable request.
References
[1] Adeleye B, Rachal C. Comparison of the rheological properties of ready-to-serve and powdered instant food – thickened beverages at different temperatures for dysphagic patients. J Am Diet Assoc. 2007;107(7):1176–82.10.1016/j.jada.2007.04.011Search in Google Scholar PubMed
[2] Dewar RJ, Joyce MJ. Time-dependent rheology of starch thickeners and the clinical implications for dysphagia therapy. Dysphagia. 2006;21(4):264–9.10.1007/s00455-006-9050-7Search in Google Scholar PubMed
[3] Cook IJ, Kahrilas PJ. AGA technical review on management of oropharyngeal dysphagia. Gastroenterology. 1999;116(2):455–78.10.1016/S0016-5085(99)70144-7Search in Google Scholar PubMed
[4] Sukkar SG, Maggi N, Travalca Cupillo B, Ruggiero C. Optimizing texture modified foods for oro-pharyngeal dysphagia: a difficult but possible target? Front Nutr. 2018;5:68.10.3389/fnut.2018.00068Search in Google Scholar PubMed PubMed Central
[5] Hadde E, Chen J. Shear and extensional rheological characterization of thickened fluid for dysphagia management. J Food Eng. 2019;245:18–23.10.1016/j.jfoodeng.2018.10.007Search in Google Scholar
[6] Sura L, Madhavan A, Carnaby G, Crary MA. Dysphagia in the elderly: management and nutritional considerations. Clin Interv Aging. 2012;7:287.10.2147/CIA.S23404Search in Google Scholar PubMed PubMed Central
[7] Cichero JA, Steele C, Duivestein J, Clavé P, Chen J, Kayashita J, et al. The need for international terminology and definitions for texture-modified foods and thickened liquids used in dysphagia management: foundations of a global initiative. Curr Phys Med Rehabil Rep. 2013;1(4):280–91.10.1007/s40141-013-0024-zSearch in Google Scholar PubMed PubMed Central
[8] Taniguchi H, Tsukada T, Ootaki S, Yamada Y, Inoue M. Correspondence between food consistency and suprahyoid muscle activity, tongue pressure, and bolus transit times during the oropharyngeal phase of swallowing. J Appl Physiol. 2008;105(3):791–9.10.1152/japplphysiol.90485.2008Search in Google Scholar PubMed
[9] Steele CM, Alsanei WA, Ayanikalath S, Barbon CE, Chen J, Cichero JA, et al. The influence of food texture and liquid consistency modification on swallowing physiology and function: a systematic review. Dysphagia. 2015;30(1):2–26.10.1007/s00455-014-9578-xSearch in Google Scholar PubMed PubMed Central
[10] Newman R, Vilardell N, Clavé P, Speyer R. Effect of bolus viscosity on the safety and efficacy of swallowing and the kinematics of the swallow response in patients with oropharyngeal dysphagia: white paper by the European Society for Swallowing Disorders (ESSD). Dysphagia. 2016;31:232–49.10.1007/s00455-016-9696-8Search in Google Scholar PubMed PubMed Central
[11] Wang X, Chen J. Food oral processing: Recent developments and challenges. Curr OpColloid Interface Sci. 2017;28:22–30.10.1016/j.cocis.2017.01.001Search in Google Scholar
[12] Behrouzian F, Razavi SMA, Phillips GO. Cress seed (Lepidium sativum) mucilage, an overview. Bioact Carbohydr Diet Fibre. 2014;3(1):17–28.10.1016/j.bcdf.2014.01.001Search in Google Scholar
[13] Alghooneh A, Razavi SMA, Kasapis S. Hydrocolloid clustering based on their rheological properties. J Texture Stud. 2018;49(6):619–38.10.1111/jtxs.12368Search in Google Scholar PubMed
[14] Sworn G. 8 - Xanthan gum. In: Phillips GO, Williams PA, editors. Handbook of Hydrocolloids. Elsevier; 2009. p. 186–203.10.1533/9781845695873.186Search in Google Scholar
[15] Nakauma M, Ishihara S, Funami T, Nishinari K. Swallowing profiles of food polysaccharide solutions with different flow behaviors. Food Hydrocoll. 2011;25(5):1165–73.10.1016/j.foodhyd.2010.11.003Search in Google Scholar
[16] Funami T. Next target for food hydrocolloid studies: Texture design of foods using hydrocolloid technology. Food Hydrocoll. 2011;25(8):1904–14.10.1016/j.foodhyd.2011.03.010Search in Google Scholar
[17] Cichero JA. Thickening agents used for dysphagia management: Effect on bioavailability of water, medication and feelings of satiety. Nutr J. 2013;12(1):54.10.1186/1475-2891-12-54Search in Google Scholar PubMed PubMed Central
[18] Bresolin TM, Milas M, Rinaudo M, Ganter JL. Xanthan–galactomannan interactions as related to xanthan conformations. Int J Biol Macromol. 1998;23(4):263–75.10.1016/S0141-8130(98)00061-0Search in Google Scholar PubMed
[19] Côté C, Giroux A, Villeneuve-Rhéaume A, Gagnon C, Germain I. Is IDDSI an evidence-based framework? A relevant question for the frail older population. Geriatrics. 2020;5(4):82.10.3390/geriatrics5040082Search in Google Scholar PubMed PubMed Central
[20] Pedrolli C. IDDSI: Worth or not? Clin Nutr. 2022;41(3):786.10.1016/j.clnu.2022.01.005Search in Google Scholar PubMed
[21] Burbidge AS, Cichero JA, Engmann J, Steele CM. “A day in the life of the fluid bolus”: An introduction to fluid mechanics of the oropharyngeal phase of swallowing with particular focus on dysphagia. Appl Rheol. 2016;26(6):8–17.Search in Google Scholar
[22] Munialo CD, Kontogiorgos V, Euston SR, Nyambayo I. Rheological, tribological and sensory attributes of texture‐modified foods for dysphagia patients and the elderly: A review. Int J Food Sci Technol. 2020;55(5):1862–71.10.1111/ijfs.14483Search in Google Scholar
[23] Karazhiyan H, Razavi SMA, Phillips GO. Extraction optimization of a hydrocolloid extract from cress seed (Lepidium sativum) using response surface methodology. Food Hydrocoll. 2011;25(5):915–20.10.1016/j.foodhyd.2010.08.022Search in Google Scholar
[24] Poursani P, Razavi SM, Norouzi A. Numerical investigation of a two-phase system on swallowing behavior in dysphagia: A case study on cress seed gum-xanthan gum thickened liquids. J Food Bioprod Process. 2021;128:186–201.10.1016/j.fbp.2021.05.004Search in Google Scholar
[25] Hanson B, O’Leary MT, Smith CH. The effect of saliva on the viscosity of thickened drinks. Dysphagia. 2012;27(1):10–9.10.1007/s00455-011-9330-8Search in Google Scholar PubMed
[26] Watanabe E, Yamagata Y, Fujitani J, Fujishima I, Takahashi K, Uyama R, et al. The criteria of thickened liquid for dysphagia management in Japan. Dysphagia. 2018;33(1):26–32.10.1007/s00455-017-9827-xSearch in Google Scholar PubMed
[27] Paik N-J, Han TR, Park JW, Lee EK, Park MS, Hwang I-K. Categorization of dysphagia diets with the line spread test. Arch Phys Med Rehabil. 2004;85(5):857–61.10.1016/j.apmr.2003.08.079Search in Google Scholar PubMed
[28] Hanson B, Steele CM, Lam P, Cichero JA. Fluid testing methods recommended by IDDSI. Dysphagia. 2019;34(5):716–7.10.1007/s00455-018-9957-9Search in Google Scholar PubMed
[29] IDDSI. IDDSI framework: testing methods 2.0. 2019. https://iddsi.org/framework/drink-testing-methods/2019.Search in Google Scholar
[30] Yokote Y, Takata N, Yamagata Y, Kayashita J. A comparison of viscosity classifications between the Japanese dysphagia diet 2013 criteria and the international dysphagia diet standardisation initiative. EC Nutr. 2017;10:185–94.Search in Google Scholar
[31] Ong JJ-X, Steele CM, Duizer LM. Sensory characteristics of liquids thickened with commercial thickeners to levels specified in the International Dysphagia Diet Standardization Initiative (IDDSI) framework. Food Hydrocoll. 2018;79:208–17.10.1016/j.foodhyd.2017.12.035Search in Google Scholar PubMed PubMed Central
[32] Yamagata Y, Izumi A, Egashira F, Miyamoto K-I, Kayashita J. Determination of a suitable shear rate for thickened liquids easy for the elderly to swallow. Food Sci Technol Res. 2012;18(3):363–9.10.3136/fstr.18.363Search in Google Scholar
[33] Steffe JF, Osorio FA. Back extrusion of non-Newtonian fluids. Nutr Rev. 1987;41:72–7.Search in Google Scholar
[34] Gabriele D, Migliori M, Di Sanzo R, Rossi CO, Ruffolo SA, De Cindio B. Characterisation of dairy emulsions by NMR and rheological techniques. Food Hydrocoll. 2009;23(3):619–28.10.1016/j.foodhyd.2008.05.002Search in Google Scholar
[35] Alghooneh A, Razavi SM, Kasapis S. Classification of hydrocolloids based on small amplitude oscillatory shear, large amplitude oscillatory shear, and textural properties. J Texture Stud. 2019;50(6):520–38.10.1111/jtxs.12459Search in Google Scholar PubMed
[36] Miller JL, Watkin KL. The influence of bolus volume and viscosity on anterior lingual force during the oral stage of swallowing. Dysphagia. 1996;11(2):117–24.10.1007/BF00417901Search in Google Scholar PubMed
[37] Laiho S, Williams RP, Poelman A, Appelqvist I, Logan A. Effect of whey protein phase volume on the tribology, rheology and sensory properties of fat-free stirred yoghurts. Food Hydrocoll. 2017;67:166–77.10.1016/j.foodhyd.2017.01.017Search in Google Scholar
[38] Thorpe MG, Milte CM, Crawford D, McNaughton SA. A comparison of the dietary patterns derived by principal component analysis and cluster analysis in older Australians. Int J Behav Nutr Phys Act. 2016;13(1):30.10.1186/s12966-016-0353-2Search in Google Scholar PubMed PubMed Central
[39] Mann LL, Wong K. Development of an objective method for assessing viscosity of formulated foods and beverages for the dysphagic diet. J Am Diet Assoc. 1996;96(6):585–8.10.1016/S0002-8223(96)00160-5Search in Google Scholar PubMed
[40] Nicosia MA, Robbins J. The usefulness of the line spread test as a measure of liquid consistency. Dysphagia. 2007;22(4):306–11.10.1007/s00455-007-9086-3Search in Google Scholar PubMed
[41] Kim SG, Yoo W, Yoo B. Relationship between apparent viscosity and line-spread test measurement of thickened fruit juices prepared with a xanthan gum-based thickener. Prev Nutr Food Sci. 2014;19(3):242.10.3746/pnf.2014.19.3.242Search in Google Scholar PubMed PubMed Central
[42] Kim YH, Jeong GY, Yoo B. Comparative study of IDDSI flow test and line‐spread test of thickened water prepared with different dysphagia thickeners. J Texture Stud. 2018;49(6):653–8.10.1111/jtxs.12360Search in Google Scholar PubMed
[43] Lam P, Stanschus S, Zaman R, Cichero JA. The international dysphagia diet standardisation initiative (IDDSI) framework: the Kempen pilot. Br J Neurosci Nurs. 2017;13(Sup 2):S18–26.10.12968/bjnn.2017.13.Sup2.S18Search in Google Scholar
[44] Su M, Zheng G, Chen Y, Xie H, Han W, Yang Q, et al. Clinical applications of IDDSI framework for texture recommendation for dysphagia patients. J Texture Stud. 2018;49(1):2–10.10.1111/jtxs.12306Search in Google Scholar PubMed
[45] Farhoosh R, Riazi A. A compositional study on two current types of salep in Iran and their rheological properties as a function of concentration and temperature. Food Hydrocoll. 2007;21(4):660–6.10.1016/j.foodhyd.2006.07.021Search in Google Scholar
[46] Szczesniak AS, Farkas E. Objective characterization of the mouthfeel of gum solutions. J Food Sci. 1962;27(4):381–5.10.1111/j.1365-2621.1962.tb00112.xSearch in Google Scholar
[47] Nishinari K, Takemasa M, Su L, Michiwaki Y, Mizunuma H, Ogoshi H. Effect of shear thinning on aspiration – Toward making solutions for judging the risk of aspiration. Food Hydrocoll. 2011;25(7):1737–43.10.1016/j.foodhyd.2011.03.016Search in Google Scholar
[48] Mezger TG. The rheology handbook: For users of rotational and oscillatory rheometers. European Coatings; 2020.10.1515/9783748603702Search in Google Scholar
[49] Aime DB, Arntfield SD, Malcolmson LJ, Ryland D. Textural analysis of fat reduced vanilla ice cream products. Food Res Int. 2001 Jan;34(2–3):237–46.10.1016/S0963-9969(00)00160-5Search in Google Scholar
[50] Razavi SMA, Alghooneh A, Behrouzian F. Thermo-rheology and thermodynamic analysis of binary biopolymer blend: A case study on sage seed gum-xanthan gum blends. Food Hydrocoll. 2018;77:307–21.10.1016/j.foodhyd.2017.10.007Search in Google Scholar
[51] National Dysphagia Diet Task Force, American Dietetic Association. National dysphagia diet: Standardization for optimal care: American Dietetic Associati; 2002.Search in Google Scholar
[52] Zargaraan A, Rastmanesh R, Fadavi G, Zayeri F, Mohammadifar MA. Rheological aspects of dysphagia-oriented food products: A mini review. Food Sci Hum Wellness. 2013 Sep;2(3–4):173–8.10.1016/j.fshw.2013.11.002Search in Google Scholar
[53] Chen J, Lolivret L. The determining role of bolus rheology in triggering a swallowing. Food Hydrocoll. 2011 May 1;25(3):325–32.10.1016/j.foodhyd.2010.06.010Search in Google Scholar
[54] Tokifuji A, Matsushima Y, Hachisuka K, Yoshioka K. Texture, sensory and swallowing characteristics of high-pressure-heat-treated pork meat gel as a dysphagia diet. Meat Sci. 2013 Apr 1;93(4):843–8.10.1016/j.meatsci.2012.11.050Search in Google Scholar PubMed
[55] Lee SI, Yoo JY, Kim M, Ryu JS. Changes of timing variables in swallowing of boluses with different viscosities in patients with dysphagia. Arch Phys Med Rehabilitation. 2013 Jan;94(1):120–6.10.1016/j.apmr.2012.07.016Search in Google Scholar PubMed
[56] Garcia JM, Chambers E, IV. Managing dysphagia through diet modifications. AJN Am J Nurs. 2010;110(11):26–33.10.1097/01.NAJ.0000390519.83887.02Search in Google Scholar PubMed
[57] McCallum SL. The national dysphagia diet: implementation at a regional rehabilitation center and hospital system. J Am Diet Assoc. 2003;103(3):381–4.10.1053/jada.2003.50074Search in Google Scholar PubMed
[58] Kapoor VP, Milas M, Taravel FR, Rinaudo M. Rheological properties of seed galactomannan from Cassia nodosa Buch.-hem. Carbohydr Polym. 1994;25(2):79–84.10.1016/0144-8617(94)90142-2Search in Google Scholar
[59] Razmkhah S, Razavi SMA, Mohammadifar MA. Purification of cress seed (Lepidium sativum) gum: A comprehensive rheological study. Food Hydrocoll. Vol. 61. 2016. p. 358–68.10.1016/j.foodhyd.2016.05.035Search in Google Scholar
[60] Razavi SMA, Cui SW, Guo Q, Ding H. Some physicochemical properties of sage (Salvia macrosiphon) seed gum. Food Hydrocoll. 2014;35:453–62.10.1016/j.foodhyd.2013.06.022Search in Google Scholar
[61] Barnes HA, Hutton JF, Walters K. An introduction to rheology. Elsevier; 1989.Search in Google Scholar
[62] Yousefi A, Ako K. Controlling the rheological properties of wheat starch gels using Lepidium perfoliatum seed gum in steady and dynamic shear. Int J Biol Macromol. 2020;143:928–36.10.1016/j.ijbiomac.2019.09.153Search in Google Scholar PubMed
[63] Abbastabar B, Azizi MH, Adnani A, Abbasi S. Determining and modeling rheological characteristics of quince seed gum. Food Hydrocoll. 2015;43:259–64.10.1016/j.foodhyd.2014.05.026Search in Google Scholar
[64] Fischer P, Windhab EJ. Rheology of food materials. Curr Opin Colloid Interface Sci. 2011;16(1):36–40.10.1016/j.cocis.2010.07.003Search in Google Scholar
[65] Weitz D, Wyss H, Larsen R. Oscillatory rheology: Measuring the viscoelastic behaviour of soft materials. GIT Lab J Europe. 2007;11(3–4):68–70.Search in Google Scholar
[66] Gharibzahedi SMT, Mousavi SM, Hamedi M, Khodaiyan F. Application of response surface modeling to optimize critical structural components of walnut–beverage emulsion with respect to analysis of the physicochemical aspects. Food Bioprocess Technol. 2013;6(2):456–69.10.1007/s11947-011-0763-8Search in Google Scholar
[67] Hemar Y, Tamehana M, Munro P, Singh H. Influence of xanthan gum on the formation and stability of sodium caseinate oil-in-water emulsions. Food Hydrocoll. 2001;15(4–6):513–9.10.1016/S0268-005X(01)00075-3Search in Google Scholar
[68] Alghooneh A, Razavi SM. Transient and dynamic rheological properties of emerging hydrocolloids. Emerg Nat Hydrocoll: Rheol Funct. 2019;101–34.10.1002/9781119418511.ch4Search in Google Scholar
[69] Ishihara S, Nakauma M, Funami T, Odake S, Nishinari K. Swallowing profiles of food polysaccharide gels in relation to bolus rheology. Food Hydrocoll. 2011;25(5):1016–24.10.1016/j.foodhyd.2010.09.022Search in Google Scholar
[70] Razavi SMA, Alghooneh A. Understanding the physics of hydrocolloids interaction using rheological, thermodynamic and functional properties: A case study on xanthan gum-cress seed gum blend. Int J Biol Macromol. 2020;151:1139–53.10.1016/j.ijbiomac.2019.10.158Search in Google Scholar PubMed
[71] Mohammad Amini A, Razavi SMA. Ultrasound‐assisted acid‐thinning of corn starch: Morphological, physicochemical, and rheological properties. Starch‐Stärke. 2015;67(7–8):640–53.10.1002/star.201400228Search in Google Scholar
[72] Medina-Torres L, Brito-De La Fuente E, Torrestiana-Sanchez B, Alonso S. Mechanical properties of gels formed by mixtures of mucilage gum (Opuntia ficus indica) and carrageenans. Carbohydr Polym. 2003;52(2):143–50.10.1016/S0144-8617(02)00269-2Search in Google Scholar
[73] Michon C, Chapuis C, Langendorff V, Boulenguer P, Cuvelier G. Strain-hardening properties of physical weak gels of biopolymers. Food Hydrocoll. 2004;18(6):999–1005.10.1016/j.foodhyd.2004.04.005Search in Google Scholar
[74] Talukdar MM, Michoel A, Rombaut P, Kinget R. Comparative study on xanthan gum and hydroxypropylmethyl cellulose as matrices for controlled-release drug delivery I. Compaction and in vitro drug release behaviour. Int J Pharm. 1996;129(1–2):233–41.10.1016/0378-5173(95)04355-1Search in Google Scholar
[75] Song K-W, Kuk H-Y, Chang G-S. Rheology of concentrated xanthan gum solutions: Oscillatory shear flow behavior. Korea-Aust Rheol J. 2006;18(2):67–81.10.1007/BF02908257Search in Google Scholar
[76] Carmona J, Ramírez P, Calero N, Muñoz J. Large amplitude oscillatory shear of xanthan gum solutions. Effect of sodium chloride (NaCl) concentration. J Food Eng. 2014;126:165–72.10.1016/j.jfoodeng.2013.11.009Search in Google Scholar
[77] Labropoulos A, HSu SH. Viscoelastic behavior of whey protein isolates at the sol‐gel transition point. J Food Sci. 1996;61(1):65–8.10.1111/j.1365-2621.1996.tb14726.xSearch in Google Scholar
[78] Hyun K, Kim SH, Ahn KH, Lee SJ. Large amplitude oscillatory shear as a way to classify the complex fluids. J Non-Newtonian Fluid Mech. 2002;107(1–3):51–65.10.1016/S0377-0257(02)00141-6Search in Google Scholar
[79] Carmona JA, Lucas A, Ramírez P, Calero N, Muñoz J. Nonlinear and linear viscoelastic properties of a novel type of xanthan gum with industrial applications. Rheol Acta. 2015;54(11):993–1001.10.1007/s00397-015-0888-1Search in Google Scholar
[80] Hyun K, Wilhelm M, Klein CO, Cho KS, Nam JG, Ahn KH, et al. A review of nonlinear oscillatory shear tests: Analysis and application of large amplitude oscillatory shear (LAOS). Prog Polym Sci. 2011;36(12):1697–753.10.1016/j.progpolymsci.2011.02.002Search in Google Scholar
[81] Lochhead R. The use of polymers in cosmetic products. Cosmet Sci Technol. 2017;171–221.10.1016/B978-0-12-802005-0.00013-6Search in Google Scholar
[82] Coblas D, Broboana D, Balan C. Correlation between large amplitude oscillatory shear (LAOS) and steady shear of soft solids at the onset of the fluid rheological behavior. Polymer. 2016;104:215–26.10.1016/j.polymer.2016.06.003Search in Google Scholar
[83] Stokes JR, Boehm MW, Baier SK. Oral processing, texture and mouthfeel: From rheology to tribology and beyond. Curr Opin Colloid Interface Sci. 2013;18(4):349–59.10.1016/j.cocis.2013.04.010Search in Google Scholar
[84] Hayashi M, Takei R, Umene S, Narita K, Kato K, Kobayashi Y, et al. Tribological analysis of the surface of food gels. Food Hydrocoll. 2016;58:343–6.10.1016/j.foodhyd.2016.03.010Search in Google Scholar
[85] Torres O, Yamada A, Rigby NM, Hanawa T, Kawano Y, Sarkar A. Gellan gum: A new member in the dysphagia thickener family. Biotribology. 2019;17:8–18.10.1016/j.biotri.2019.02.002Search in Google Scholar
[86] Marconati M, Engmann J, Burbidge A, Mathieu V, Souchon I, Ramaioli M. A review of the approaches to predict the ease of swallowing and post-swallow residues. Trends Food Sci Technol. 2019;86:281–97.10.1016/j.tifs.2019.02.045Search in Google Scholar
[87] Malone M, Appelqvist I, Norton I. Oral behaviour of food hydrocolloids and emulsions. Part 1. Lubrication and deposition considerations. Food Hydrocoll. 2003;17(6):763–73.10.1016/S0268-005X(03)00097-3Search in Google Scholar
[88] Blok AE, Bolhuis DP, Kibbelaar HV, Bonn D, Velikov KP, Stieger M. Comparing rheological, tribological and sensory properties of microfibrillated cellulose dispersions and xanthan gum solutions. Food Hydrocoll. 2021;121:107052.10.1016/j.foodhyd.2021.107052Search in Google Scholar
[89] De Vicente J, Stokes J, Spikes H. Soft lubrication of model hydrocolloids. Food Hydrocoll. 2006;20(4):483–91.10.1016/j.foodhyd.2005.04.005Search in Google Scholar
[90] De Vicente J, Stokes J, Spikes H. The frictional properties of Newtonian fluids in rolling–sliding soft-EHL contact. Tribol Lett. 2005;20(3–4):273–86.10.1007/s11249-005-9067-3Search in Google Scholar
[91] Cassin G, Heinrich E, Spikes H. The influence of surface roughness on the lubrication properties of adsorbing and non-adsorbing biopolymers. Tribol Lett. 2001;11(2):95–102.10.1023/A:1016702906095Search in Google Scholar
[92] Selway N, Chan V, Stokes JR. Influence of fluid viscosity and wetting on multiscale viscoelastic lubrication in soft tribological contacts. Soft Matter. 2017;13(8):1702–15.10.1039/C6SM02417CSearch in Google Scholar
[93] Vieira J, Oliveira F Jr, Salvaro D, Maffezzolli G, de Mello J, Vicente A, et al. Rheology and soft tribology of thickened dispersions aiming the development of oropharyngeal dysphagia-oriented products. Curr Res Food Sci. 2020;3:19–29.10.1016/j.crfs.2020.02.001Search in Google Scholar PubMed PubMed Central
[94] Zhang B, Selway N, Shelat KJ, Dhital S, Stokes JR, Gidley MJ. Tribology of swollen starch granule suspensions from maize and potato. Carbohydr Polym. 2017;155:128–35.10.1016/j.carbpol.2016.08.064Search in Google Scholar PubMed
[95] Yakubov G, Branfield T, Bongaerts J, Stokes J. Tribology of particle suspensions in rolling-sliding soft contacts. Biotribology. 2015;3:1–10.10.1016/j.biotri.2015.09.003Search in Google Scholar
[96] Nguyen PT, Kravchuk O, Bhandari B, Prakash S. Effect of different hydrocolloids on texture, rheology, tribology and sensory perception of texture and mouthfeel of low-fat pot-set yoghurt. Food Hydrocoll. 2017;72:90–104.10.1016/j.foodhyd.2017.05.035Search in Google Scholar
[97] Casanovas A, Hernández M, Martí-Bonmatí E, Dolz M. Cluster classification of dysphagia-oriented products considering flow, thixotropy and oscillatory testing. Food Hydrocoll. 2011;25(5):851–9.10.1016/j.foodhyd.2010.07.029Search in Google Scholar
© 2023 the author(s), published by De Gruyter
This work is licensed under the Creative Commons Attribution 4.0 International License.
Articles in the same Issue
- Research Articles
- Vibrational wave scattering in disordered ultra-thin film with integrated nanostructures
- Optimization of lead-free CsSnI3-based perovskite solar cell structure
- Determination of the velocity of seismic waves for the location of seismic station of Zatriq, Kosovo
- Seismic hazard analysis by neo-deterministic seismic hazard analysis approach (NDSHA) for Kosovo
- Ultimate strength of hyper-ellipse flanged-perforated plates under uniaxial compression loading
- Development of an adaptive coaxial concrete rheometer and rheological characterisation of fresh concrete
- Synthesis and characterization of a new complex based on antibiotic: Zirconium complex
- Exergy–energy analysis for a feasibility trigeneration system at Kocaeli University Umuttepe Campus
- Transient particle tracking microrheology of plasma coagulation via the intrinsic pathway
- Analysis of complex fluid discharge from consumer dispensing bottles using rheology and flow visualization
- A method of safety monitoring and measurement of overall frost heaving pressure of tunnel in seasonal frozen area
- Application of isolation technology in shallow super-large comprehensive pipe galleries in seismically vulnerable areas with weak soils
- Application of the ramp test from a closed cavity rheometer to obtain the steady-state shear viscosity η(γ̇)
- Research on large deformation control technology of highly weathered carbonaceous slate tunnel
- Tailoring a symmetry for material properties of tellurite glasses through tungsten(vi) oxide addition: Mechanical properties and gamma-ray transmissions properties
- An experimental investigation into the radiation-shielding performance of newly developed polyester containing recycled waste marble and bismuth oxide
- A study on the fractal and permeability characteristics of coal-based porous graphite for filtration and impregnation
- Creep behavior of layered salt rock under triaxial loading and unloading cycles
- Research and optimization of tunnel construction scheme for super-large span high-speed railway tunnel in poor tuff strata
- Elongational flow mixing: A novel innovative approach to elaborate high-performance SBR-based elastomer compounds
- The ductility performance of concrete using glass fiber mesh in beam specimens
- Thickened fluids classification based on the rheological and tribological characteristics
- Strength characteristics and damage constitutive model of sandstone under hydro-mechanical coupling
- Experimental study of uniaxial compressive mechanical properties of rough jointed rock masses based on 3D printing
- Study on stress distribution and extrusion load threshold of compressed filled rock joints
- Special Issue on Rheological Behavior and Engineering Stability of Rock Mass - Part II
- Seismic response and damage mechanism of tunnel lining in sensitive environment of soft rock stratum
- Correlation analysis of physical and mechanical parameters of inland fluvial-lacustrine soft soil based on different survey techniques
- An effective method for real-time estimation of slope stability with numerical back analysis based on particle swarm optimization
- An efficient method for computing slope reliability calculation based on rigorous limit equilibrium
- Mechanical behavior of a new similar material for weathered limestone in karst area: An experimental investigation
- Semi-analytical method for solving stresses in slope under general loading conditions
- Study on the risk of seepage field of Qiantang River underground space excavated in water-rich rheological rock area
- Numerical analysis of the impact of excavation for undercrossing Yellow River tunnel on adjacent bridge foundations
- Deformation rules of deep foundation pit of a subway station in Lanzhou collapsible loess stratum
- Development of fiber compound foaming agent and experimental study on application performance of foamed lightweight soil
- Monitoring and numerical simulation analysis of a pit-in-pit excavation of the first branch line of Lanzhou Metro
- CT measurement of damage characteristics of meso-structure of freeze-thawed granite in cold regions and preliminary exploration of its mechanical behavior during a single freeze-thaw process