Transient particle tracking microrheology of plasma coagulation via the intrinsic pathway
-
Yating Mao


Abstract
The maintenance of hemostasis to ensure vascular integrity is dependent upon the rapid conversion of zymogen species of the coagulation cascade to their enzymatically active forms. This process culminates in the generation of the serine protease thrombin and polymerization of fibrin to prevent vascular leak at sites of endothelial cell injury or loss of cellular junctions. Thrombin generation can be initiated by the extrinsic pathway of coagulation through exposure of blood to tissue factor at sites of vascular damage, or alternatively by the coagulation factor (F) XII activated by foreign surfaces with negative charges, such as glass, through the contact activation pathway. Here, we used transient particle tracking microrheology to investigate the mechanical properties of fibrin in response to thrombin generation downstream of both coagulation pathways. We found that the structural heterogeneity of fibrin formation was dependent on the reaction kinetics of thrombin generation. Pharmacological inhibition of FXII activity prolonged the time to form fibrin and increased the degree of heterogeneity of fibrin, resulting in fibrin clots with reduced mechanical properties. Taken together, this study demonstrates a dependency of the physical biology of fibrin formation on activation of the contact pathway of coagulation.
1 Introduction
The activation of the blood coagulation system is triggered by the exposure of blood to tissue factor (TF) at sites of vascular injury or the activation by foreign surfaces of the contact activation pathway [1] (Figure 1). TF initiates the activation of the extrinsic pathway of blood coagulation by converting the zymogen factor (F) VII to the active enzyme species FVIIa [2]. Charged surfaces including components of biomaterials or bacterial-derived long-chain polyphosphates (LCPPs) that initiate blood coagulation by activating coagulation FXII to FXIIa, which in turn activates FXI to lead to activation of FIX [3]. Both the extrinsic and contact activation pathways converge on the common pathway of coagulation by activating FX, which results in the generation of thrombin. Beyond activating blood cells including platelets, thrombin cleaves fibrinogen to fibrin, which polymerizes to form a fibrin mesh as part of a hemostatic plug, or a cloak to isolate bacteria or biomaterials from the blood microenvironment [1,3]. In diseases such as thrombosis, the rate of thrombin generation outpaces the rate of inactivation of the serine proteases of the coagulation cascade, resulting in occult intravascular thrombosis formation underlying pathologies including myocardial infarction, pulmonary embolism, and disseminated intravascular coagulopathy [4,5].

Schematic of the blood coagulation cascade. Activation of the coagulation cascade triggers the conversion of the inactive coagulation factors (represented by an F followed by a Roman number, e.g., FXII) to their active form (FXIIa) by a series of enzymatic reactions. The intrinsic pathway (purple) is also termed the “contact activation pathway,” which is activated by negatively charged surfaces, such as polyphosphates. The extrinsic pathway (orange) is initiated by TF that is released during vascular injury. The activation of platelets upon injury is not depicted here. The activation of coagulation factor ten (FX) marks the start of the common pathway (green) that leads to the formation of cross-linked fibrin clots.
The conversion of fibrinogen from a soluble form to a meshwork of polymerized fibrin has been shown to be dependent upon both the pathway of initiation and the rate of thrombin generation. These variables have been shown to regulate the physical biology of fibrin, including individual fiber length and diameter as well as bulk crosslinking and tertiary structures, all of which affect clot strength and resistance to breakdown [6,7]. However, the majority of these mechanistic studies have been performed under static conditions; as such, it has remained unclear how these pathways regulate fibrin formation in the context of the rheological environment of the circulation.
Particle tracking microrheology (PTM) is a passive microrheological technique that characterizes the microenvironment of a medium by tracking the Brownian motion of embedded probes. Since the driving force of Brownian motion is thermal energy, these particles perturb the fibrin filaments by minimal deformations, ensuring that the internal structure of the fibrin clots remains intact throughout the transient process of coagulation [8,9]. Thus, this platform represents a useful and sensitive method to evaluate the effect of initiation of the coagulation cascade downstream the TF pathway as compared to the contact pathway of coagulation on the mechanics and dynamics of fibrin formation. In this investigation, platelet poor plasma (PPP) excluding platelet activities was used to form fibrin clots. Calcium participates in a series of enzymatic reactions and fibrin polymerization, thus calcium chloride was added to all clotting samples. Vehicle control group includes samples treated with the same solvent as for the test groups. After the fibrin clots equilibrated, we used scanning confocal microscopy to visualize the network of the clots. A statistical heterogeneity analysis proposed by Valentine et al. [10] was adopted in the microrheological measurements. The results suggested different levels of heterogeneity in the fibrin clots, where the wide distribution of the diffusive exponents in the LCPP/corn trypsin inhibitor (CTI) group indicated the most heterogeneous structure. Quantitative analysis of the confocal images showed that LCPP and LCPP/CTI samples had the shortest fibrin filaments,
2 Materials and methods
Poly(ethylene glycol) (PEG)-ylated particles were prepared by coupling the carboxylate-modified fluorescent probing particles (Molecular Probes, FluoSpheres,
2.1 Fibrin formation
Plasma coagulation was measured in flat 18-well slides (ibidi,
2.2 Theory of microrheology
In a passive microrheology experiment, the mean-squared displacement (MSD) of submicron- to micron-scale probing particles that are embedded in the material of interest are measured [15]. The measurements are achieved by tracking the probes’ Brownian motions, which are driven by the thermal energy that induces minimal local deformations to the medium. For particles with comparable size to the intrinsic mesh size of the material, the thermal fluctuations of these particles reflect the microscopic environment of the material. Particles that are much smaller than the mesh size will diffuse through the interstitial fluid as if they reside in a Newtonian fluid. Particles that are much larger than the mesh size will probe the material over a large averaged area, providing essentially a bulk description of the material.
In a Newtonian fluid, the MSD of the probing particles increases with time, such that
where
where
where
2.3 Video microscopy
The Brownian motion of the probing particles was recorded at a frame rate of 31 fps by a video microscopy system, which includes an inverted fluorescent microscope (Nikon, Ti-S), a charged-couple device camera (Allied Vision, Guppy Pro 125B), a light-emitting diode (LED) light source (X-cite, 120LED), and a computer that was used for image acquisition and data analysis. A 40
2.4 Image analysis
The MSD was obtained by locating the positions of the probing particles in consecutive images that were acquired by the microscopy setup, utilizing a MATLAB tracking algorithm that was adapted from the five-step routines originally developed by Crocker and Grier in IDL [20]. Static and dynamic errors have been identified in previous work by the authors for the same system [21]. These errors were corrected during the data analysis by following the method in the study by Savin and Doyle [22].
We applied the PTM to measure the transient microrheology of the evolving fibrin clots. We characterized coagulation by the gelation time and the quality of the clot at the gel point, which can be characterized by the shear moduli of the clot at this characteristic time. The transition of a material from liquid state to solid state can be described by the gradual decrease in the slope of the MSD of the embedded probing particles. To study the properties of the plasma at different stages through the process of coagulation, we divided each of the videos into 30 segments and computed the MSD of the first 1/10 of the frames of the duration of each segment to ensure that the sample was at a quasi-equilibrium state during the measurement. However, noticeable convection, which causes the diffusive exponent to be greater than unity, was observed in the first few minutes of the gelation, which was attributed to the sealing step of the sample preparation. Therefore, in all of the plots of transitioning MSD and in plots of the value of
2.5 Confocal microscopy
Confocal images were taken by a laser scanning confocal microscope (Leica, DMI 4000B) with a 40
Quantitative analysis of the fibrin filaments corresponding to each confocal image in Figure 6
| Vehicle | TF | LCPP | CTI | TF/CTI | LCPP/CTI | |
|---|---|---|---|---|---|---|
| Average length (
|
12.868 | 32.811 | 7.746 | 17.089 | 13.199 | 8.582 |
| Minimum length (
|
3.574 | 7.522 | 1.349 | 6.711 | 2.645 | 1.833 |
| Maximum length (
|
54.051 | 77.03 | 40.09 | 35.529 | 51.948 | 57.705 |
| Standard deviation (
|
7.011 | 16.313 | 5.028 | 5.946 | 7.449 | 6.074 |
| Number of measurements | 222 | 49 | 246 | 93 | 142 | 195 |
| Filament coverage (%) | 16.569 | 12.841 | 11.861 | 14.266 | 11.499 | 7.526 |
3 Results and discussion
3.1 Interpreting MSDs
Examples of transient MSDs of evolving fibrin clots are shown in Figure 2. The experiment in Figure 2(a) was initiated with vehicle control with no inhibitor, while the experiment in Figure 2(c) was initiated by LCPP to incite FXII activation and coagulation by the contact pathway; in selected experiments, activated FXIIa was inhibited by CTI. These samples were chosen specifically to visualize the differences in the spatial evolution of the fibrin clots when thrombin generation is initiated by the contact pathway. The slope values of the MSDs are plotted as a function of time for these two samples in Figure 2(b) and (d), respectively. For both samples, the initial MSD has a slope of approximately one, which indicates that the PPP solution was initially a Newtonian fluid. The MSD gradually decreased over time as the fibrin polymerized, showing increasing elasticity of the clot.
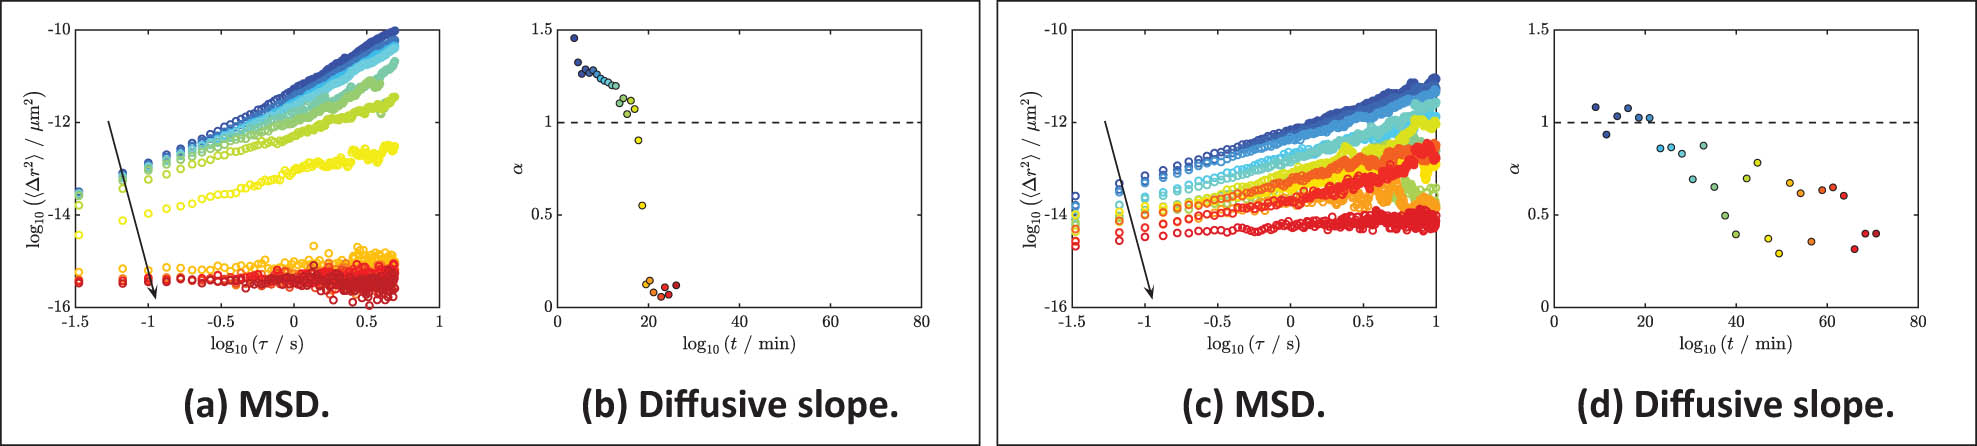
Ensemble-averaged MSDs of fibrin clots throughout the polymerization versus time. (a)–(b) Vehicle. (a) The MSD of an evolving fibrin clot that was initiated with vehicle control. The slope of MSD decreased as fibrin cross-linked, as indicated by the downward arrow. This decrease is also color-coded by the transition from blue (early stage) to red (late stage). (b) The logarithmic slopes of each MSD as in (a). The same color codes are used here as in (a). A dashed line with the value of one is given here in reference to the diffusion of a Newtonian fluid. (c) and (d) LCPP and CTI. (c) The MSD of an evolving fibrin clot that was initiated by LCPP and inhibited by CTI. The downward arrow suggests the decrease in MSD over time. This decrease is also marked by the color gradient from blue to red. (d) The logarithmic slopes of each MSD as in (c). The same color codes are used here as in (c). Some time segments of MSD in (a) and (c) were removed for a clearer view of the transition of the MSD over time, but all values of
Detailed information about the mechanical properties during the evolution of the clot can be further extracted from these transient plots. For instance, the last MSD of Figure 2(a) is smaller in area and closer to zero than the final MSD of Figure 2(c) over the same time. We predict that if the experiment was allowed to progress, the samples containing both LCPP and CTI may eventually show a constant MSD; regardless, these results indicate that relative to the vehicle control baseline, a reduction in rigidity reflected by an increase in the mobility of probe particles was observed when fibrin formation incited by LCPP in the presence of the FXIIa inhibitor CTI. Moreover, compared to the sample with the addition of LCPP and CTI, the slopes of the sample under vehicle control show a cleaner transition. This observation indicates that a more heterogeneous structure is being formed when LCPP and CTI are added, as fibrin clots are not formed throughout the entire medium, but they are instead more localized. Thus, particles experience different local structures, which are revealed by a fluctuation of diffusive exponents
3.2 Heterogeneity of fibrin clots
Experiments were run until the particles were considered motionless. We found that the last overall MSD of the gelation, which is an ensemble average of all available particles, did not always decrease to a constant value as expected based on these observations. Therefore, we investigated the displacement of single particles in different segments. For example, Figure 3(a) shows the displacement of particles in both

Displacement in
Regardless of the time (e.g., the 36th minute in the previous example) that a sample is analyzed, inconsistencies in the displacements of different particles were found in all samples in this study to various extents. This variant motion of single particles signifies a heterogeneous structure of the fibrin clots. Thus, we replotted the values of the diffusive exponents that were based on the groupings, as shown in Figure 4. Here,

Representative examples for all reaction conditions. The values of the diffusive exponent,
3.3 Gel point
A developing clot is a dynamic system that results in a weak hydrogel. During the gelation the sample progresses through states of being a viscoelastic liquid before the gel point and a viscoelastic solid after the gel point. Eventually, the sample is so rigid that it could be considered a purely elastic Hookean solid. One method to find the gel point is by observing how the moduli develop over time for a wide range of frequencies using the theory of time-cure superposition [25–27]. However, the rapid polymerization of fibrin only allows for short times of analysis, and the relaxation time is not accessible in this small range of frequencies.
Alternatively, the Rouse prediction of
The gel points of all samples that were measured are shown in Figure 5(a). The reaction kinetics of the samples that were initiated by TF (extrinsic pathway) do not appear to be significantly affected by the inhibition by CTI. This result is reasonable, as TF is an initiator of the extrinsic pathway, which should be indirectly affected by inhibition of FXIIa. The kinetics of thrombin generation leading to fibrin formation under vehicle control was slightly prolonged by CTI. However, CTI significantly prolonged the coagulation when LCPP was present. CTI is an inhibitor in the intrinsic pathway, and as such the effect of CTI on fibrin generated by the FXII-activating agent LCPP was directly impacted as expected.
![Figure 5
Rheological characteristics. (a) Gel time of all samples. The error bars indicate the standard deviation of
n
∈
[
1
,
4
]
n\in {[}1,4]
runs of each type of clot. The gel time of the clot that was initiated by LCPP was noticeably prolonged by the inhibition of CTI. (b) Example moduli (31 Hz) at the gel time of a fibrin clot that was formed with LCPP and CTI as a function of the diffusive exponent of each group of probing particles. Heterogeneous structure caused distinctive motions of probing particles, resulting in multiple moduli that reflect the local environment of each group (
α
max
{\alpha }_{{\rm{\max }}}
,
α
mode
{\alpha }_{{\rm{mode}}}
, and
α
min
{\alpha }_{{\rm{\min }}}
). Less diffusive particles (with low
α
\alpha
value) are positioned in denser networks (with high
∣
G
∗
∣
| {G}^{\ast }|
), and vice versa.
⟨
∣
G
∗
∣
⟩
\langle | {G}^{\ast }| \rangle
is determined using the ensemble-averaged MSD of all probes in the field of view.](/document/doi/10.1515/arh-2022-0129/asset/graphic/j_arh-2022-0129_fig_005.jpg)
Rheological characteristics. (a) Gel time of all samples. The error bars indicate the standard deviation of
3.4 Shear moduli at the gel point
To assess the effect of CTI introduced on the microscopic structure of clotting systems, we measured the moduli of these clots at their gel point by applying equation (3). At a chosen time, the value of the moduli is determined by the value of
3.5 Confocal microscopy
The heterogeneous microstructure of the fibrin clots (linear structures in Figure 6) was visually confirmed by their confocal images. These confocal images were taken from the equilibrated clots at 24 h after the microrheological measurements. The particles in the confocal images include fluorescent particles and proteins or other substances (dark spots in the images) that naturally exist in plasma. The lengths and area of fibrin filaments in each figure were analyzed using ImageJ and reported in Table 1, where the “filament coverage” is the total percentage of area covered by fibrin filaments. All the blobs in the images were excluded during this area analysis. It was challenging to quantify fiber thickness. The filament coverage results suggest that all samples without the addition of CTI (Figure 6(a)–(c)) formed denser fibrin networks, when correspondingly compared with the clots formed with the presence of CTI (Figure 6(d)–(f)). As shown in Table 1, the samples wherein thrombin generation and fibrin formation were initiated by TF had the longest average filament length, while the LCPP and LCPP/CTI samples had the shortest average length and standard deviations close to their average lengths. In addition, Figure 6(f) exhibits a very distinct scattered structure, which supports the observation that the development of the fibrin networks is sensitive to inhibition of FXIIa with CTI. These heterogeneous structures also explain the variant behavior of the probing particles – particles that were trapped in the structure exhibited sub-diffusive behavior, but other particles were able to travel in the voids of this network and thus show more diffusive motions.
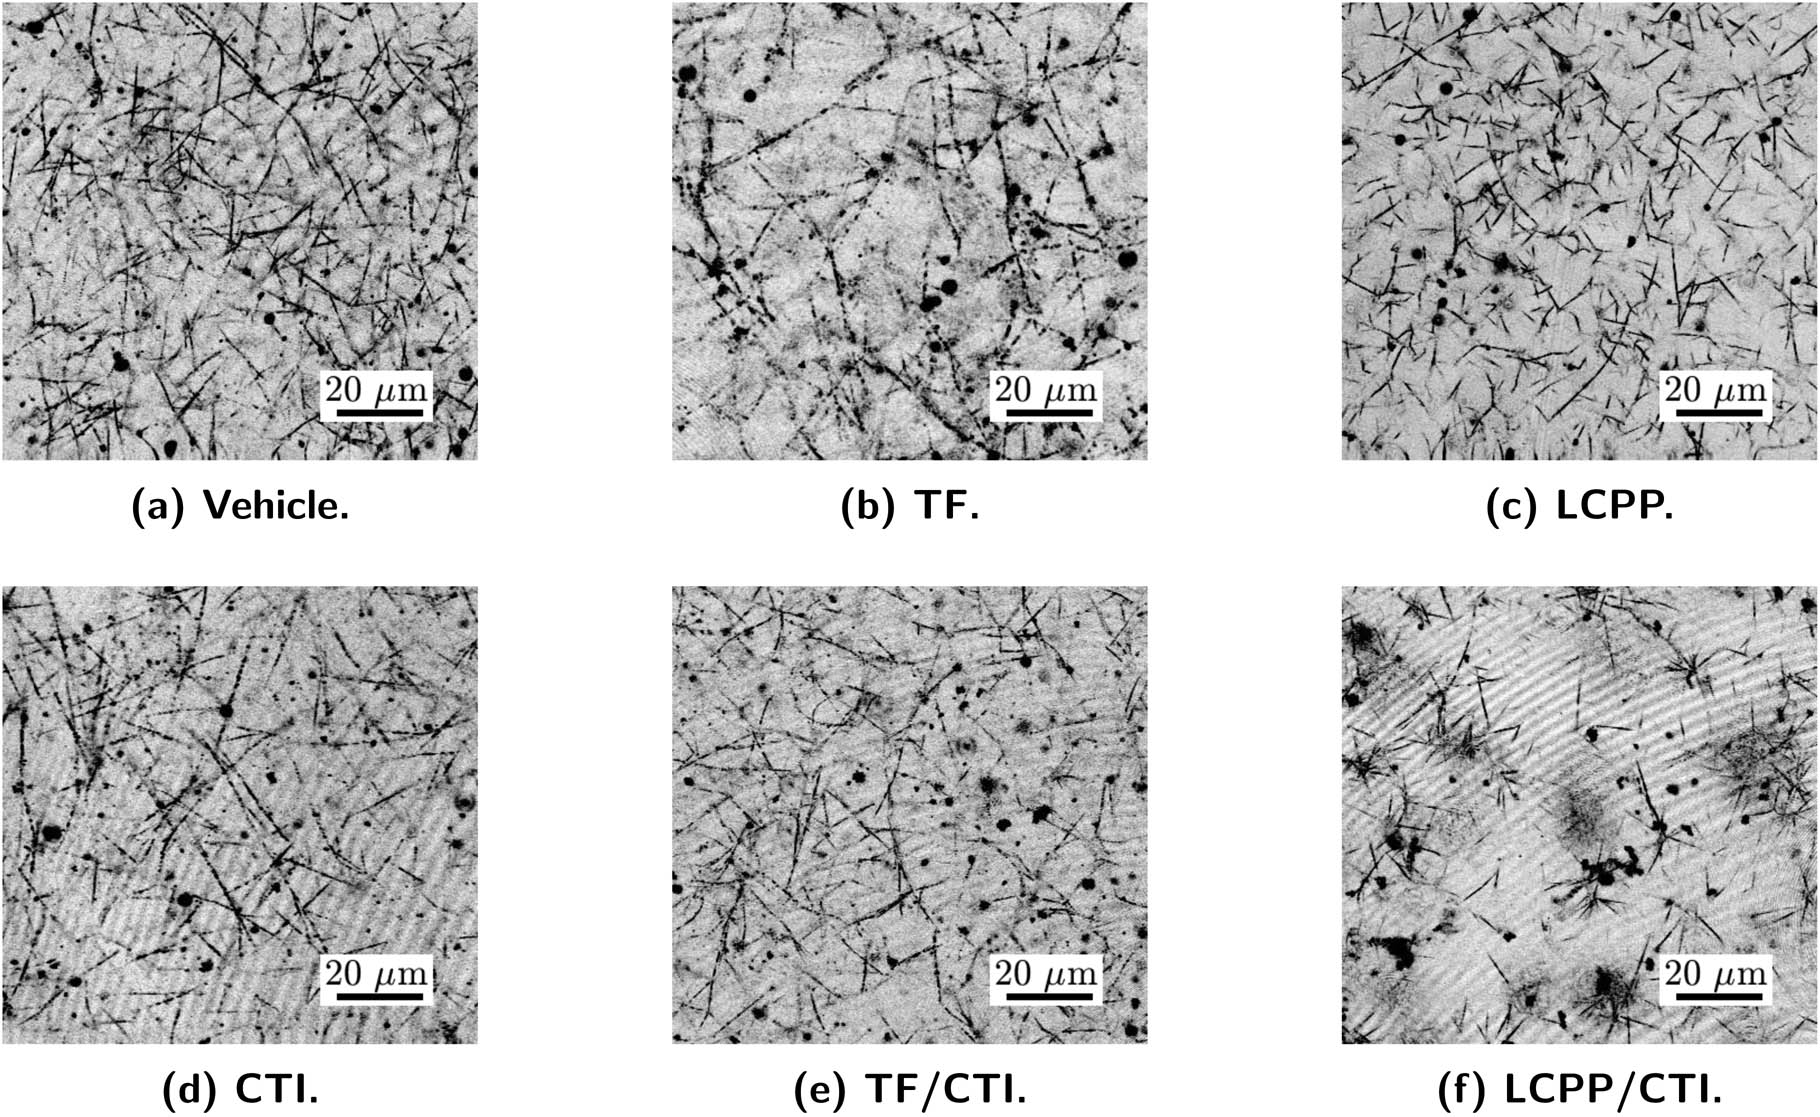
Confocal microscopy images of fibrin networks after 24 h of coagulation. The particles that are presented in the images include the probing particles as well as other substances that naturally exist in plasma. (a) A fibrin clot that was formed with vehicle control. (b) A fibrin clot that was formed with the initiation of TF, resulting in a denser network with longer fibers, compared with other samples. (c) A fibrin network that was initiated by LCPP, which also shows a dense structure. (d) A fibrin clot that was formed with the inhibition by CTI. The image shows thinner polymer fibers when compared with the vehicle-controlled sample in (a). (e) A fibrin clot that was initiated by TF with the inhibition by CTI. This clot developed thinner fibers, even though CTI and TF directly function in different pathways. (f) A fibrin clot that was initiated by LCPP and inhibited by CTI. The clotting was inhibited by CTI, resulting in a poorly developed gel with a heterogeneous structure and large voids.
4 Conclusion
The transition of all samples of PPP solution from a purely viscous liquid to a viscoelastic or elastic solid has been observed from the MSD as a function of time. The MSD of the original PPP solution had a diffusive exponent of one, while the diffusive exponent gradually decreased over time as the microscopic structure developed. Different levels of heterogeneity of the fibrin clots have been observed, exhibited in the deviation of diffusive exponents,
Our preliminary tests showed that CTI caused the fibrin clots to form with low rigidities. However, computing the bulk moduli was challenging during gelling at the micron level, since heterogeneity was seen throughout the coagulation for all trials (Figures 3 and 5(b)). To assess how the shear moduli of the fibrin clots are affected by the initiators and inhibitors, a study of the equilibrated fibrin clots should be conducted, which requires a system that prevents evaporation of any kind. Moreover, to thoroughly study the roles of FXII and FXI, a more comprehensive study of the reaction kinetics of the intrinsic pathway with a larger number of trials is necessary. Also, longer durations of experiments or multiple times of monitoring of the clotting are also necessary to identify the point that the fibrin clots start to equilibrate. Furthermore, conventional rheology of the coagulation of fibrin can provide references for the microrheological study.
Acknowledgements
The authors gratefully thank Bo Sun and Jihan Kim for the support of the confocal microscopy in this research. We thank Stephanie Smith and Jim Morrissey for the kind gift of long-chain polyphosphates.
-
Funding Information: This material is based upon work that was supported by the National Science Foundation under Grant Nos. 1652958 and 1842580 and the National Institute of Health Grant HL101972.
-
Author contributions: Yating Mao: methodology, investigation, formal analysis, visualization, writing – original draft. Mingyang Tan: methodology, formal analysis, visualization, writing – review and editing. Tia C.L. Kohs: resources, writing – review and editing. Joanna L. Sylman: resources, writing – review and editing. Anh T.P. Ngo: resources, writing – review and editing. Cristina Puy: resources, writing – review and editing. Owen T.J. McCarty: conceptualization, resources, writing – review and editing. Travis W. Walker: conceptualization, methodology, funding acquisition, supervision, writing – review and editing.
-
Conflict of interest: The authors hereby certify that no involvement exists of any commercial relationships or financial interests on the subject matter or materials that are discussed in the manuscript.
-
Ethical approval: The conducted research is not related to either human or animals use.
-
Data availability statement: The datasets that were generated and/or analyzed during the current study are available from the corresponding author on reasonable request.
References
[1] Smith SA, Travers RJ, Morrissey JH. How it all starts: Initiation of the clotting cascade. Critical Rev Biochem Molecular Biol. 2015;50(4):326–36. Search in Google Scholar
[2] Mackman N. The role of tissue factor and factor VIIa in hemostasis. Anesthesia Analgesia. 2009;108(5):1447. Search in Google Scholar
[3] Stavrou E, Schmaier AH. Factor XII: what does it contribute to our understanding of the physiology and pathophysiology of hemostasis & thrombosis. Thrombosis Res. 2010;125(3):210–5. Search in Google Scholar
[4] Papageorgiou C, Jourdi G, Adjambri E, Walborn A, Patel P, Fareed J, et al. Disseminated intravascular coagulation: an update on pathogenesis, diagnosis, and therapeutic strategies. Clin Appl Thrombosis/Hemostasis. 2018;24(suppl 9):8S–28S. Search in Google Scholar
[5] Mann KG, Butenas S, Brummel K. The dynamics of thrombin formation. Arteriosclerosis Thrombosis Vascular Biol. 2003;23(1):17–25. Search in Google Scholar
[6] Kattula S, Byrnes JR, Wolberg AS. Fibrinogen and fibrin in hemostasis and thrombosis. Arteriosclerosis Thrombosis Vascular Biol. 2017;37(3):e13–21. Search in Google Scholar
[7] Weisel JW, Litvinov RI. Fibrin formation, structure and properties. Fibrous Proteins Struct Mech. 2017;82:405–56. Search in Google Scholar
[8] Mao Y, Nielsen P, Ali J. Passive and active microrheology for biomedical systems. Front Bioeng Biotechnol. 2022;10:916354. Search in Google Scholar
[9] Wirtz D. Particle-tracking microrheology of living cells: principles and applications. Ann Rev Biophys. 2009;38(1):301–26. Search in Google Scholar
[10] Valentine MT, Kaplan PD, Thota D, Crocker JC, Gisler T, Prud’homme RK, et al. Investigating the microenvironments of inhomogeneous soft materials with multiple particle tracking. Phys Rev E. 2001;64(6):061506. Search in Google Scholar
[11] Hermanson GT. Bioconjugate techniques. London, UK: Academic Press; 2013. Search in Google Scholar
[12] Valentine M, Perlman Z, Gardel M, Shin J, Matsudaira P, Mitchison T, et al. Colloid surface chemistry critically affects multiple particle tracking measurements of biomaterials. Biophys J. 2004;86(6):4004–14. Search in Google Scholar
[13] Choi SH, Collins JN, Smith SA, Davis-Harrison RL, Rienstra CM, Morrissey JH. Phosphoramidate end labeling of inorganic polyphosphates: facile manipulation of polyphosphate for investigating and modulating its biological activities. Biochemistry. 2010;49(45):9935–41. Search in Google Scholar
[14] Smith SA, Choi SH, Davis-Harrison R, Huyck J, Boettcher J, Rienstra CM, et al. Polyphosphate exerts differential effects on blood clotting, depending on polymer size. Blood. 2010;116(20):4353–9. Search in Google Scholar
[15] Einstein A. On the motion of small particles suspended in liquids at rest required by the molecular-kinetic theory of heat. Annalen der Physik. 1905;17:549–60. Search in Google Scholar
[16] Mason TG. Estimating the viscoelastic moduli of complex fluids using the generalized Stokes-Einstein equation. Rheologica Acta. 2000;39(4):371–8. Search in Google Scholar
[17] Furst EM, Squries TM. Microrheology. New York, USA: Oxford University Press; 2017. Search in Google Scholar
[18] Mason TG, Weitz D. Optical measurements of frequency-dependent linear viscoelastic moduli of complex fluids. Phys Rev Lett. 1995;74(7):1250. Search in Google Scholar
[19] Squires TM, Mason TG. Fluid mechanics of microrheology. Ann Rev Fluid Mechanics. 2010;42:413–38. Search in Google Scholar
[20] Crocker JC, Grier DG. Methods of digital video microscopy for colloidal studies. J Colloid Interface Sci. 1996;179:298–310. Search in Google Scholar
[21] Tan M, Mao Y, Walker TW. Rheological enhancement of artificial sputum medium. Appl Rheol. 2020;30(1):27–38. Search in Google Scholar
[22] Savin T, Doyle PS. Static and dynamic errors in particle tracking microrheology. Biophys J. 2005;88:623–38. Search in Google Scholar
[23] Puy C, Tucker EI, Wong ZC, Gailani D, Smith SA, Choi SH, et al. Factor XII promotes blood coagulation independent of factor XI in the presence of long-chain polyphosphates. J Thrombosis Haemostasis. 2013;11(7):1341–52. Search in Google Scholar
[24] Martin BRC. Statistics for physicists. London, UK: Academic Press; 1971. Search in Google Scholar
[25] Winter HH, Chambon F. Analysis of linear viscoelasticity of a crosslinking polymer at the gel point. J Rheol. 1986;30(2):367–82. Search in Google Scholar
[26] Winter HH, Mours M. Rheology of polymers near liquid-solid transitions. In: Neutron spin echo spectroscopy viscoelasticity rheology. Berlin, Heidelberg: Springer; 1997. p. 165–234. Search in Google Scholar
[27] Schultz KM, Baldwin AD, Kiick KL, Furst EM. Gelation of covalently cross-linked PEG-heparin hydrogels. Macromolecules. 2009;42(14):5310–6. Search in Google Scholar
[28] Lusignan CP, Mourey TH, Wilson JC, Colby RH. Viscoelasticity of randomly branched polymers in the critical percolation class. Phys Rev E. 1995;52(6):6271. Search in Google Scholar
[29] Martin JE, Adolf D, Wilcoxon JP. Viscoelasticity of near-critical gels. Phys Rev Lett. 1988;61(22):2620. Search in Google Scholar
[30] Savin T, Doyle PS. Electrostatically tuned rate of peptide self-assembly resolved by multiple particle tracking. Soft Matter. 2007;3(9):1194–202. Search in Google Scholar
[31] Tillman BF, Gruber A, McCarty OJ, Gailani D. Plasma contact factors as therapeutic targets. Blood Rev. 2018;32(6):433–48. Search in Google Scholar
[32] Sylman JL, Daalkhaijav U, Zhang Y, Gray EM, Farhang PA, Chu TT, et al. Differential roles for the coagulation factors XI and XII in regulating the physical biology of fibrin. Ann Biomed Eng. 2017;45(5):1328–40. Search in Google Scholar
© 2023 the author(s), published by De Gruyter
This work is licensed under the Creative Commons Attribution 4.0 International License.
Articles in the same Issue
- Research Articles
- Vibrational wave scattering in disordered ultra-thin film with integrated nanostructures
- Optimization of lead-free CsSnI3-based perovskite solar cell structure
- Determination of the velocity of seismic waves for the location of seismic station of Zatriq, Kosovo
- Seismic hazard analysis by neo-deterministic seismic hazard analysis approach (NDSHA) for Kosovo
- Ultimate strength of hyper-ellipse flanged-perforated plates under uniaxial compression loading
- Development of an adaptive coaxial concrete rheometer and rheological characterisation of fresh concrete
- Synthesis and characterization of a new complex based on antibiotic: Zirconium complex
- Exergy–energy analysis for a feasibility trigeneration system at Kocaeli University Umuttepe Campus
- Transient particle tracking microrheology of plasma coagulation via the intrinsic pathway
- Analysis of complex fluid discharge from consumer dispensing bottles using rheology and flow visualization
- A method of safety monitoring and measurement of overall frost heaving pressure of tunnel in seasonal frozen area
- Application of isolation technology in shallow super-large comprehensive pipe galleries in seismically vulnerable areas with weak soils
- Application of the ramp test from a closed cavity rheometer to obtain the steady-state shear viscosity η(γ̇)
- Research on large deformation control technology of highly weathered carbonaceous slate tunnel
- Tailoring a symmetry for material properties of tellurite glasses through tungsten(vi) oxide addition: Mechanical properties and gamma-ray transmissions properties
- An experimental investigation into the radiation-shielding performance of newly developed polyester containing recycled waste marble and bismuth oxide
- A study on the fractal and permeability characteristics of coal-based porous graphite for filtration and impregnation
- Creep behavior of layered salt rock under triaxial loading and unloading cycles
- Research and optimization of tunnel construction scheme for super-large span high-speed railway tunnel in poor tuff strata
- Elongational flow mixing: A novel innovative approach to elaborate high-performance SBR-based elastomer compounds
- The ductility performance of concrete using glass fiber mesh in beam specimens
- Thickened fluids classification based on the rheological and tribological characteristics
- Strength characteristics and damage constitutive model of sandstone under hydro-mechanical coupling
- Experimental study of uniaxial compressive mechanical properties of rough jointed rock masses based on 3D printing
- Study on stress distribution and extrusion load threshold of compressed filled rock joints
- Special Issue on Rheological Behavior and Engineering Stability of Rock Mass - Part II
- Seismic response and damage mechanism of tunnel lining in sensitive environment of soft rock stratum
- Correlation analysis of physical and mechanical parameters of inland fluvial-lacustrine soft soil based on different survey techniques
- An effective method for real-time estimation of slope stability with numerical back analysis based on particle swarm optimization
- An efficient method for computing slope reliability calculation based on rigorous limit equilibrium
- Mechanical behavior of a new similar material for weathered limestone in karst area: An experimental investigation
- Semi-analytical method for solving stresses in slope under general loading conditions
- Study on the risk of seepage field of Qiantang River underground space excavated in water-rich rheological rock area
- Numerical analysis of the impact of excavation for undercrossing Yellow River tunnel on adjacent bridge foundations
- Deformation rules of deep foundation pit of a subway station in Lanzhou collapsible loess stratum
- Development of fiber compound foaming agent and experimental study on application performance of foamed lightweight soil
- Monitoring and numerical simulation analysis of a pit-in-pit excavation of the first branch line of Lanzhou Metro
- CT measurement of damage characteristics of meso-structure of freeze-thawed granite in cold regions and preliminary exploration of its mechanical behavior during a single freeze-thaw process