Performance of 100-W HVM LPP-EUV source
-
Hakaru Mizoguchi
 ,
Hiroaki Nakarai
,
Hiroaki Nakarai

Abstract
At Gigaphoton Inc., we have developed unique and original technologies for a carbon dioxide laser-produced tin plasma extreme ultraviolet (CO2-Sn-LPP EUV) light source, which is the most promising solution for high-power high-volume manufacturing (HVM) EUV lithography at 13.5 nm. Our unique technologies include the combination of a pulsed CO2 laser with Sn droplets, the application of dual-wavelength laser pulses for Sn droplet conditioning, and subsequent EUV generation and magnetic field mitigation. Theoretical and experimental data have clearly shown the advantage of our proposed strategy. Currently, we are developing the first HVM light source, ‘GL200E’. This HVM light source will provide 250-W EUV power based on a 20-kW level pulsed CO2 laser. The preparation of a high average-power CO2 laser (more than 20 kW output power) has been completed in cooperation with Mitsubishi Electric Corporation. Recently, we achieved 140 W at 50 kHz and 50% duty cycle operation as well as 2 h of operation at 100 W of power level. Further improvements are ongoing. We will report the latest status and the challenge to reach stable system operation of more than 100 W at about 4% conversion efficiency with 20-μm droplets and magnetic mitigation.
1 Introduction
The extreme ultraviolet (EUV) light source has been developed together with the scanning exposure tool. ASML shipped the ‘alpha demo tool’, which has a 10-W EUV light source, in 2007 [1], and Nikon shipped EUV-1 in 2008 [2]. The alpha demo tool of ASML developed into NXE-3100 at the beginning of 2011 with a 100-W EUV light source [3, 4]. Currently, EUV exposure tool development is in the beta tool phase (NXE-3300) with requirements for high-volume manufacturing (HVM) [5, 6]. Several machines have already been shipped in 2013. The required EUV power is 250 W at intermediate focus (IF) [7]. This is a clean EUV power, i.e. after the purification of infrared (IR) and deep UV spectral contributions. Unfortunately, the demonstrated power level is still around 50 W. Since 2002, we have been developing carbon dioxide (CO2) laser-produced tin (Sn) plasma (CO2-Sn-LPP) EUV light source, which is the most promising solution for 13.5-nm high-power (>200-W) HVM EUV lithography (EUVL) [8–10]. We have chosen the LPP-EUV method because of its high efficiency, power scalability, and spatial freedom around the plasma. Our group has proposed several unique and original technologies, which include the combination of a pulsed CO2 laser with Sn droplets, application of dual-wavelength laser pulses for Sn droplet conditioning and subsequent EUV generation, and magnetic field mitigation. Theoretical [11] and experimental [12] data have clearly demonstrated that the combination of a CO2 laser with a Sn target generates plasma with high (>4%) conversion efficiency (CE), i.e. energy conversion from driver laser pulse energy to 13.5-nm EUV 2% in-band energy at plasma [1] (2% full-width 2π sr). In 2012, we demonstrated a high CE of >4.7% in a small-size (2-Hz) experimental device. We have transferred this high-CE condition to 100-kHz repetition rate operation. Technical challenges are the generation of very stable droplets, the very stable performance of the laser beam, and the high accuracy shooting control, i.e. the synchronization between the laser and the droplet, to obtain very-high-dose stability. Simultaneously, other challenges include the requirements for the high average CO2 power and the superior beam quality of the CO2 laser [13], which is based on commercial high-average-power continuous wave (cw)-CO2 amplifiers. We completed the preparation of a high-average-power CO2 laser with more than 20-kW output power in cooperation with Mitsubishi Electric Corporation.
Figure 1 summarizes our recent progress. Last year, we reported data on 43-W operation in February at SPIE [14] and on 92-W operation in June at the EUVL workshop [15]. In October 2014, we achieved 118 W at 60 kHz and 70% duty cycle operation during 10 min of operation time [16]. We reported the latest improvements in December with more than 100-W stable operation at 4% CE with 20-μm droplets and magnetic mitigation during 2 h of operation time. In this paper, we present the technological progress of each key component and update system operation data. For a discussion of the scientific background of the presented technologies, we refer the interested reader to the literature [17]. Substantial parts of this work are based on results presented at the SPIE Conference Extreme Ultraviolet (EUV) Lithography VI, 2015 [18].

Progress of EUV power (Gigaphoton development).
2 LPP EUV light source concept and component technologies
The concept of our EUV source system is shown in Figure 2. At first, the Sn droplet is irradiated with the pre-pulse laser, which crushes it to a sub-micron mist. The mist then expands in time. Next, after a certain delay time, the expanded mist cloud is heated by the pulsed CO2 laser beam. The Sn mist cloud is thus converted into a high-temperature plasma with Sn ions of high charge states, which emit the 13.5-nm EUV light during recombination processes. After the initial plasma expansion, most of the Sn ions are confined by the magnetic field due to their Larmor gyration. Since the residues of the plasma are eventually scattered inside the vessel after the EUV light emission, the Sn plasma needs to be trapped to prevent the collector mirror from being contaminated. Thus, to enhance the EUV energy and optimize the Sn debris mitigation, the number of Sn ions should be maximized during the laser heating process.

The concept of Gigaphoton HVM EUV light source.
2.1 Pre-pulse technology
The sub-micron mist generated after pre-pulse irradiation consists of Sn fragments that have a maximum diameter of only a few micrometers. The Sn fragments were measured via the shadowgraph method with a few-nanosecond-pulsed back illuminator and a CCD camera equipped with a high-resolution telescope. Figure 3 shows the shadowgraphs of the fragments after pre-pulse laser irradiation of a 20-μm diameter Sn droplet. The droplet is irradiated with the pre-pulse laser from left-hand side of the image.

Shadowgraph of fragments after pre-pulse irradiation with 10-ps and 10-ns pulse for 1- and 2-μs delay time and two viewing angles (bottom) (picosecond pre-pulse, generates a dome structure; nanosecond pre-pulse, generates a disc/ring structure) and modeling (top: left, nanosecond pulse; right, picoseconds pulse).
In the case of the 10-ns pre-pulse laser irradiation, the cloud of fragments moves to the right while expanding in diameter. Meanwhile, in the case of the 10-ps pre-pulse irradiation, the fragment cloud expands in all directions without translational movement. This phenomenon can be explained by the difference of the pre-pulse expansion mechanism between the nanosecond pulse and the picosecond pulse. The mechanisms are outlined in Figure 3 (top): the expansion of the plasma (Figure 3, top left), which is generated by the ablation of Sn in the case of a nanosecond-order pre-pulse, causes the liquid droplet to deform and move into the opposite direction due to the exerted plasma pressure. A picosecond-order pre-pulse, meanwhile, is faster than the ablation process and generates a shockwave inside the droplet, which subsequently shatters it. The corresponding difference in the fragment distribution could be a key factor to obtain a CE >5%.
The pre-pulse laser condition is a key parameter for obtaining higher CE. The CE reached 3.3% with the 20-μm Sn droplet by optimizing the 10-ns pre-pulse laser conditions. Meanwhile, the CE reached 4.7% with the 20-μm droplet by optimizing the 10-ps pre-pulse laser conditions (Figure 4). This high CE technology enables a 250-W EUV source with a 20-kW CO2 laser. As outlined, EUV light is emitted from the Sn plasma by high-charge-state Sn ions. Therefore, the ionization rate is an essential parameter to obtain a higher CE.

Conversion efficiency (10-ns and 10-ps pre-pulse).
The distribution of the neutral Sn atom density after pre-pulse laser irradiation in a certain magnetic field was measured by laser-induced fluorescence. The ground-state Sn atoms are excited via the transition of 5p23P0-6s 3Po1 (286.3 nm), and the recombination/fluorescence via the transition of 5p23P2-6s 3Po1 (317.5 nm) is observed with an image-intensified CCD camera through a band-pass filter. The calculated ionization ratio vs. CO2 laser energy is shown in Figure 5. In addition, the CE vs. CO2 laser energy is shown in Figure 4. In both figures, the experimental parameter is the pulse duration of the pre-pulse laser. In case of the 10-ns pre-pulse, the ionization ratio increases with increasing CO2 laser pulse energy, as shown in Figure 5. These data indicate that if the CO2 laser pulse energy is above a certain energy level, almost all the Sn atoms in the Sn droplet will be ionized. Meanwhile, in the case of the 10-ps pre-pulse, the ionization rate is very high even in the case of low-CO2 pulse energy. This is a very good indication because this means that the Sn ionization rate reaches a high level even at low CO2 irradiation energy. The debris mitigation system therefore also works under low-power operation.
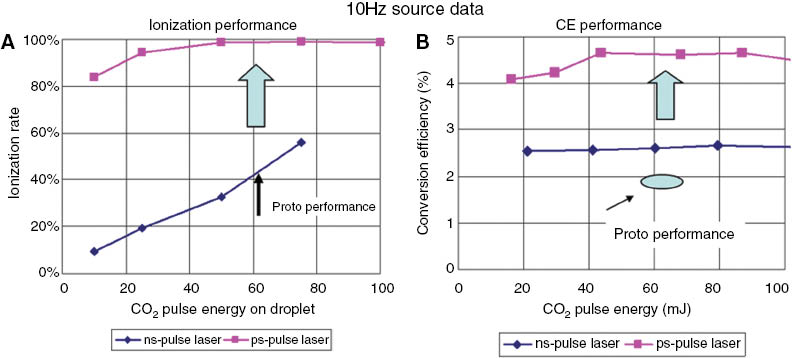
Experimental data of 10 Hz light source. (A) Ionization ratio. (B) CE vs. CO2 laser energy.
2.2 Droplet generation and magnetic mitigation
Our Sn debris mitigation concept with the magnetic field is shown in Figure 6. Because EUV light is emitted from the Sn plasma, which mainly consists of Sn ions and electrons, almost all the Sn ions can be trapped in the strong magnetic field. Therefore, the maximization of the Sn ion ratio is essentially important not only from the point of view of CE but also of Sn mitigation. If all the Sn atoms are ionized, all the Sn ions can possibly be guided along the magnetic flux lines. Also, a part of the neutral atoms can be guided and trapped by charge exchange with ions [19]. The mitigation system is also equipped with a chemical etching mechanism that removes the remaining Sn atoms from the surface of the collector mirror and of some view ports [20].
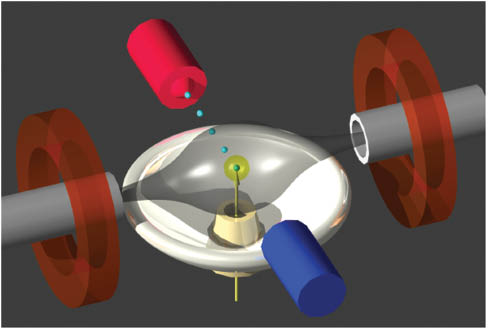
Schematic of collector mirror and mitigation system.
The main function of the EUV vessel is to maintain a high-level vacuum environment at the EUV plasma and to mechanically position the components, such as the collector mirror, droplet generator, and so on. A schematic of the EUV vessel is shown in Figure 6. The vessel contains seven key components: one droplet generator, one droplet catcher, one collector mirror, a pair of superconducting magnet coils, and two ion collectors. To mitigate the Sn debris, the pair of superconducting magnetic coils is coaxially aligned at both sides of the vessel. One of the most important requirements is to fully capture the Sn atoms after the EUV radiation to extend the lifetime of the collector mirror. Sn deposition of only 1-nm thickness on the EUV collector mirror, i.e. a few atomic layers, degrades the mirror reflectivity by 10%. This needs to be taken into consideration in the mirror lifetime specification [20]. Hence, the Sn supplied inside the vessel has to be almost fully removed from the active region in order to prevent deposition (of evaporated material, molten droplets, slow ions), erosion (fast ions), and implantation (ultra fast ions) on the collector mirror.
2.3 Droplet generator
The generation of small Sn droplets is particularly important with respect to Sn debris mitigation. The Sn droplet mass should be minimized to the necessary limit for sufficient EUV photon generation and minimum Sn debris. The Sn supply tank is heated above the melting temperature of Sn (>231.93°C). Liquid Sn droplets are generated from the droplet generator. The droplet generator (red rod) and the droplet catcher (blue rod) are shown in Figure 6.
The EUV light source system is equipped with droplet position sensors and controllers; it also has pre-pulse and CO2 laser position controllers to stabilize the plasma position and EUV energy. Long-term positional droplet stability is indispensable to maintain long-term EUV power stability at the IF. The droplet position is therefore measured by a position sensor, and the result is feedback to the droplet generator stage. This is very important because the droplet position at the plasma determines the EUV light source position for the collector. In addition, the pre-pulse and CO2 laser irradiation positions are monitored, which, combined with the monitoring of the droplet position, enables the stabilization of CE and EUV position and the improvement of Sn debris mitigation, which is extremely important for commercial usage. Recently, we succeeded with the generation of stable 20-μm droplets.
2.4 CO2 driver laser system
The pulsed master oscillator power amplifier CO2 laser system has 20-ns pulse duration [full width at half maximum (FWHM)] and 20-kW average output power at 100-kHz repetition rate, which are optimized for Sn plasma generation. The hybrid CO2 laser system consists of a short-pulse high-repetition-rate master oscillator (master OSC) and multistage cascade amplifiers. The master OSC laser is a Q-switched, 20-ns, single P(20) line, radio frequency (RF)-pumped waveguide CO2 laser. RF excitation is a commonly employed scheme in axial flow or diffusion-cooled slab or waveguide configurations, allowing a high repetition rate in pulsed operation by a thoroughly designed amplification system, for high-repetition-rate plasma generation. Modified commercial cw-CO2 amplifiers are used as the amplifiers. The laser system can be operated from low-duty mode (2%) to full-duty mode (100%). The target specifications of this laser system are the following: the master OSC generates pulses at the repetition rate of 100 kHz, with 20-ns pulse duration and with 150 W (1.5 mJ, 100 kHz) power [21]. The OSC consists of two major parts: the master OSC that generates/oscillates a pulse and the OSC-AMP that amplifies the pulse energy. The pre-amplifier (pre-AMP) amplifies the pulse power from 150-W to ∼3.0-kW (30 mJ, 100 kHz) output power with a slab-type discharge chamber. The main amplifiers (main AMP) further amplify the pulse power from 3.0- to 20-kW (200 mJ, 100 kHz) output power with three sets of CW discharge CO2 laser systems. Since 2011, we developed a new CO2 laser amplifier in cooperation with Mitsubishi Electric and supported by NEDO [22, 23]. In 2013, we then succeeded to demonstrate 21-kW output power at an engineering test stand [21, 23, 24]. A photograph of the experiment is shown in Figure 7.

Driver CO2 laser system test at Mitsubishi Electric.
2.5 IR reduction on collector mirror
The plasma-generated EUV light is collected by a multilayer mirror. However, the plasma emits not only at 13.5 nm, but also at a wide spectrum including UV, visible, and IR. These spectral components are called ‘out-of-band-light’ (Figure 8). In the past, different filters were used to suppress these out-of-band components [25]. However, the (thin) filters are strongly heated by absorption. We have introduced a new filter type; it has a grating-like structure on the surface of the multilayer mirror. The IR light incident on the multilayer mirror is diffracted and forms an interference pattern at the focal IF plane (patent pending) where the IR light is absorbed by an aperture stop. Figure 9 shows a schematic of this new out-of-band filter, and Figure 10 shows the measurement results. A high IR suppression (>99%) and a quite high EUV transmittance (∼45%) at all radial distances from the central mirror axis [26] are obtained.

Out-of-band spectrum.

Schematic of new filter.
![Figure 10: Measurement result of reflectivity (bottom left) at radial position and interference pattern on focal plane (bottom right) for two collectors (shown in top). Obtained values are average reflectivity >44% (unpolarized) and IR diffraction into zero order <1% [26].](/document/doi/10.1515/aot-2015-0025/asset/graphic/j_aot-2015-0025_fig_010.jpg)
Measurement result of reflectivity (bottom left) at radial position and interference pattern on focal plane (bottom right) for two collectors (shown in top). Obtained values are average reflectivity >44% (unpolarized) and IR diffraction into zero order <1% [26].
3 System test and result
To realize our EUV light source (Pilot), we constructed two prototype units: Proto 1 and Proto 2. The configuration and target specifications for Proto 1, Proto 2, and Pilot are shown in Table 1. The major differences among the three systems are the CO2 laser power and the output angle (optical axis of collector); the other specifications are essentially identical. The Pilot system is currently in the planning phase.
Specifications of three Gigaphoton devices.
| Operational specification | Proto 1 | Proto 2 | Pilot |
|---|---|---|---|
| Target performance | |||
| EUV power (W) | 25 | 100 | 250 |
| CE (%) | 3 | 4 | 4 |
| Pulse rate (kHz) | 100 | 100 | 100 |
| Output angle | Horizontal | 62° upper (matched to NXE) | 62° upper (matched to NXE) |
| Availability | 1-week operation | 1-week operation | >75% |
| Technology | |||
| Droplet generator (μm) | 20–25 | 20 | <20 |
| CO2 laser (kW) | >8 | >12 | 25 |
| Pre-pulse laser | Picosecond | Picosecond | Picosecond |
| Debris mitigation | Validation of magnetic mitigation in system | 10 days | >30 days |
3.1 Proto 1 system
We have been developing system technology and done component testing at Proto 1 since 2011 [27]. In 2012, we concentrated to solve two issues: first, a dramatic improvement of the long-term stability of the droplet generator; second, the increase of the CO2 laser power from 5 to 9 kW. We obtained 34-W EUV emission with the Proto 1 device via a step-by-step approach. Figure 11 shows the EUV chamber.

EUV chamber of Proto 1 system.
Figure 12 shows Sn deposition on the collector mirror (C1) after 3 days of operation in Proto 1. The Sn transport by the magnetic field is clearly visible. (The magnetic flux direction is along the horizontal axis; it is slightly tilted in the photograph.) A simulation result of Sn deposition is also shown. The simulation reveals that the root cause of the deposition is Sn back-diffusion from the ion catchers (see Figure 6). Therefore, we are now first re-designing the ion catcher in three steps. Figure 13 shows the simulated improvement. Additional steps will include further optimization of the Sn debris transport by the magnetic field. Due to our expertise from experiment and simulation, we conclude that the magnetic mitigation is a promising technology.

Sn deposition on C1 mirror. (A) Simulation (linear scale). (B) Actual picture.

Improvement of back-diffusion (simulation, linear scale).
3.2 Proto 2 system
We started the construction of the Proto 2 system in the second half of 2013. The operation has started at the beginning of 2014. A photograph of the EUV chamber is shown in Figure 14. This EUV chamber is compatible with an EUV tool. The chamber is placed between a pair of superconducting magnets. Tubes and wires are flexibly connected to the EUV chamber for ease of maintenance.

EUV chamber of Proto 2 system.
A further power scale-up requires not only the development of higher CE but also the development of a CO2 driver laser with higher average power. We already improved the pre-AMP of the CO2 driver laser; the slab-type pre-AMP has been replaced by a new pre-AMP made by Mitsubishi Electric. The CO2 driver laser power of the Proto 2 system increased from 8 to 20 kW. This 20-kW output power corresponds to 14 kW at the plasma point due to transmission losses of the CO2 laser optics. Figure 15 shows a photograph of this new pre-AMP laser installed in our laboratory.

New CO2 laser pre-AMP for the 20-kW CO2 laser system.
Typical output data of the new CO2 driver laser are shown in Figure 16. The blue line shows the data of the old laser system. Its maximum power was limited to about 10 kW due to self-oscillation. However, after the replacement of the pre-AMP, the ouput power increased to 20 kW. The typical pulse waveform with 11.7 ns (FWHM) and the beam profile are also shown.

Input/output power (top) and temporal/spatial profile (bottom) of CO2 driver laser system of Proto 2.
3.3 Latest experimental results of Proto 2 system
The data on EUV emission, shown in Figure 17, demonstrate a power of 140 W in burst mode at 70-kHz repetition rate and 50% duty cycle. An average output power of 70 W (140 W×50%) during 10 min was achieved during this operation. Figure 18 presents a long-term 100-W-level operation during 2 h. The data show that the initial 125-W burst power decreased to 95 W during this period. The average power during the 2 h is 55 W. The next target of Proto 2 is an operation period of 1 week with more than 100-W EUV power and 14-kW CO2 laser power.

EUV 140 W in burst (70 W average) power data.

EUV 130–100 W in burst power data (55 W average during 2 h).
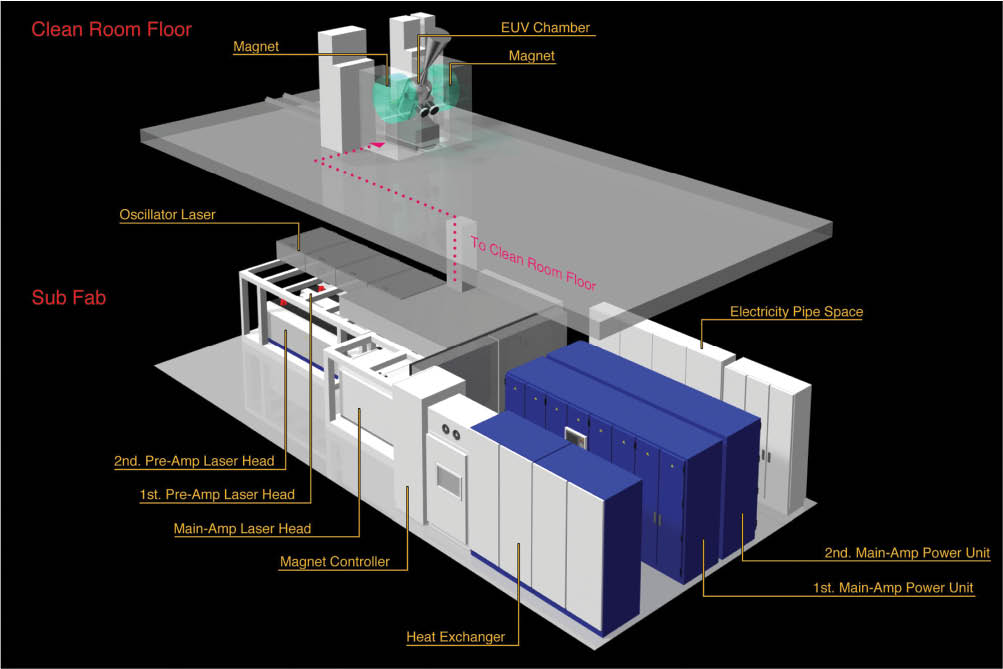
3.4 Pilot 1 system
To minimize the optical loss of EUV light, the vacuum vessel is tightly connected to the scanner at the clean room floor. To minimize the overall footprint in the clean room area, the CO2 laser system is located on a different floor (usually downstairs) (Figure 19). The CO2 driver laser configurations for the prototype and Pilot systems are shown in Figure 20. The Pilot 1 system comprises a full Mitsubishi CO2 laser amplifier system. The estimated maximum power at the laser exit is 27 kW and the power at the plasma point is 20 kW (Figure 21). The system target for the end of Q2 of 2015 is a week-level operation with 250-W EUV power at CE=4% and more than 27 kW of CO2 laser power.
The 250-W LPP EUV light source system (Pilot 1).

Structure of CO2 driver laser system in the Pilot 1 system.
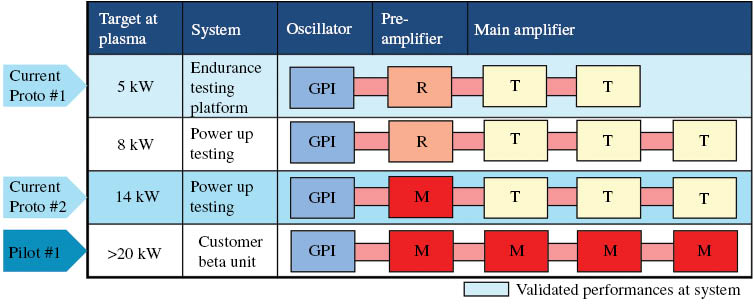
CO2 driver laser system configuration of Proto 1, Proto 2, and Pilot 1.
4 Conclusion
We have reported the progress of component technology of our EUV light source systems.
We reported promising experimental data and simulation results of the magnetic mitigation of the Proto 1 system.
We demonstrated the following data with the Proto 2 system:
Emission data of 140 W in burst mode at 70-kHz repetition rate and 50% duty cycle during 10 min.
Emission data of 118 W in burst mode at 60-kHz repetition rate and 70% duty cycle during 10 min.
Emission data of 42 W in burst mode at 20-kHz repetition rate and 50% duty cycle (10,000 pls/0.5 ms OFF) during 3 h.
The next target for Proto 2 is week-level operation with over 100-W EUV power at 14-kW CO2 laser power.
We reported the construction of our Pilot 1 system. The final target is a week-level operation with 250-W EUV power at CE=4% and more than 27-kW CO2 laser power by the end of Q2 of 2015.
As final summary, our development milestones are given in Table 2.
Milestone of EUV light source development.
| This work | Pilot 1 | ||||
|---|---|---|---|---|---|
| EUV clean power (W) | 25 | 43 | 92 | 140 | 250 |
| Target | 2013, Q4 | 2014, Q1 | 2014, Q2 | 2014, Q4 | 2015, Q2 |
| CO2 power at plasma (kW) | 5 | 8 | 14 | >14 | >20 |
| CE (%) | 2.5 | 3 | 4.2 | >4.2 | >4.5 |
| Plasma to IF clean (%) | 21.7 | 21.7 | 21.7 | 26.7 | 26.7 |
| CO2 laser | Two main amplification system: Proto 1 | Three main amplification system: Proto 2 | Mitsubishi pre-AMP: Proto 2 | Mitsubishi pre-AMP: Proto 2 | Mitsubishi main amplification system |
| Collector mirror | Normal type | Normal type | Normal type | Grating type | Grating type |
Acknowledgments
This work was partly supported by the New Energy and Industrial Technology Development Organization (NEDO) of Japan, and we acknowledge their continuous support. We acknowledge the following researchers and organizations: Dr. Atsushi Sunahara, Prof. Katsunori Nishihara, Prof. Hiroaki Nishimura, and others at Osaka University (plasma simulation); Dr. Kentaro Tomita, Prof. Kiichiro Uchino, and others at Kyushu University (plasma diagnostics); Dr. Akira Endo, HiLase Project (Prague), and Prof. Masakazu Washio and others at Waseda University (laser engineering). We also acknowledge the Mitsubishi Electric CO2 laser amplifier development team: Dr. Yoichi Tanino, Dr. Junichi Nishimae, Dr. Shuichi Fujikawa, and others. The authors feel great sorrow for the loss of Dr. Yoichi Tanino (Mitsubishi Electric Corporation) due to his untimely death on February 1, 2014. We appreciate his extremely great work in CO2 amplifier development, which he accomplished in a very short period. We pray for his soul.
References
[1] N. Harned, M. Goethals, R. Groeneveld, P. Kuerz, M. Lowisch, et al., in ‘Proc. SPIE’ 6517 (2007).10.1117/12.712065Search in Google Scholar
[2] T. Miura, K. Murakami, K. Suzuki, Y. Kohama, K. Morita, et al., in ‘Proc. SPIE’ 6921 (2008).10.1117/12.772444Search in Google Scholar
[3] C. Wagner, N. Harned, P. Kuerz, M. Lowisch, H. Meiling, et al., in ‘Proc. SPIE’ 7636 (2010).10.1117/12.845700Search in Google Scholar
[4] C. Wagner, J. Bacelar, N. Harned, E. Loopstra, S. Hendriks, et al., in ‘Proc. SPIE’ 7969 (2011).10.1117/12.878603Search in Google Scholar
[5] A. Pirati, R. Peeters, D. Smith, S. Lok, A. Minnaert, et al., in ‘Proc. SPIE’ 9422 (2015).10.1117/12.2085912Search in Google Scholar
[6] A. A. Schafgans, D. J. Brown, I. V. Fomenkov, R. Sandstrom, A. Ershov, et al., in ‘Proc. SPIE’ 9422 (2015).10.1117/12.2087421Search in Google Scholar
[7] ASML, EUV Technology Roadmap, <http://www.asml.com/doclib/misc/asml_20140306_EUV_lithography_-_NXE_platform_performance_overview.pdf>. Accessed on May 22, 2015.Search in Google Scholar
[8] H. Mizoguchi, T. Abe, Y. Watanabe, T. Ishihara, T. Ohta, et al., in ‘Proc. SPIE’ 7636 (2010).10.1117/12.846271Search in Google Scholar
[9] A. Endo, H. Hoshino, T. Suganuma, M. Moriya, T. Ariga, et al., in ‘Proc. SPIE’ 6517 (2007).10.1117/12.711097Search in Google Scholar
[10] H. Mizoguchi, T. Abe, Y. Watanabe, T. Ishihara, T. Ohta, et al., in ‘Proc. SPIE’ 7969 (2011).Search in Google Scholar
[11] K. Nishihara, A. Sasaki, A. Sunahara, and T. Nishikawa, in ‘EUV Sources for Lithography’, Ed. By V. Bakshi (SPIE, Bellingham, WA, 2005) chap. 11.Search in Google Scholar
[12] H. Tanaka, A. Matsumoto, K. Akinaga, A. Takahashi, and T. Okada, Appl. Phys. Lett. 87, 041503 (2005).10.1063/1.1989441Search in Google Scholar
[13] H. Hoshino, T. Suganuma, T. Asayam, K. Nowak, M. Moriya, et al., in ‘Proc. SPIE’ 6921 (2008).10.1117/12.771847Search in Google Scholar
[14] H. Mizoguchi, H. Nakarai, T. Abe, T. Ohta, K. M. Nowak, et al., in ‘Proc. SPIE’ 9048, (2014).10.1117/12.2046776Search in Google Scholar
[15] H. Mizoguchi, H. Nakarai, T. Abe, T. Ohta, K. M. Nowak, et al., in ‘2014 EUVL Workshop’ (June 23–27, 2014, Maui, Hawaii).Search in Google Scholar
[16] H. Mizoguchi, H. Nakarai, T. Abe, T. Ohta, K. M. Nowak, et al., in ‘2014 EUVL Symposium’ (October 27–29, 2014, Washington, DC).Search in Google Scholar
[17] K. Nishihara, A. Sunahara, A. Sasaki, M. Nunami, H. Tanuma, et al., Phys. Plasmas 15, 056708 (2008).10.1063/1.2907154Search in Google Scholar
[18] H. Mizoguchi, H. Nakarai, T. Abe, K. M. Nowak, Y. Kawasuji, et al., in ‘Proc. SPIE’ 9422 (2015).10.1117/12.2086347Search in Google Scholar
[19] T. Yanagida, H. Nagano, Y. Wada, T. Yabu, S. Nagai, et al., in ‘Proc. SPIE’ 7969 (2011).10.1117/12.879189Search in Google Scholar
[20] J. Fujimoto, T. Ohta, K. M. Nowak, T. Suganuma, H. Kameda, et al., in ‘Proc. SPIE’ 7969 (2011).10.1117/12.879181Search in Google Scholar
[21] K. M. Nowak, Y. Kawasuji, T. Ohta, T. Suganuma, T. Yokoduka, et al., in ‘EUV Symposium 2013’ (October 6–10, 2013, Toyama).Search in Google Scholar
[22] Y. Tanino, in ‘EUV Symposium 2012’ (October 1–4, 2012, Brussel).Search in Google Scholar
[23] Y. Tanino, J. Nishimae, T. Yamamoto, K. Funaoka, T. Tamida, et al., in ‘EUV Symposium 2013’ (October 6–10, 2013, Toyama).Search in Google Scholar
[24] H. Mizoguchi, H. Nakarai, T. Abe, T. Ohta, K. M. Nowak, et al., in ‘EUV Symposium 2013’ (October 6–10, 2013, Toyama).Search in Google Scholar
[25] ASML, Spectral Purity Filter Development for EUV HVM, <http://sematech.org/meetings/archives/litho/8285/pres/SO2-03-Banine.pdf>. Accessed on May 22, 2015.Search in Google Scholar
[26] RIGAKU technical display, in ‘EUV Symposium 2013’ (October 6–10, 2013,Toyama).Search in Google Scholar
[27] H. Mizoguchi, in ‘EUV Symposium 2012’ (October 1–4, 2012, Brussel).10.1155/2012/249495Search in Google Scholar
©2015 THOSS Media & De Gruyter
Articles in the same Issue
- Cover and Frontmatter
- Views
- ITRS lithography roadmap: 2015 challenges
- Community
- EOS NEWS: Report from the World of Photonics Congress 2015
- Conference Notes
- Conference Calendar
- Topical Issue: Optical Lithography
- Editorial
- Introduction to the special issue on optical lithography
- Review Articles
- How to make lithography patterns print: the role of OPC and pattern layout
- Exposure tool control for advanced semiconductor lithography
- Performance of 100-W HVM LPP-EUV source
- Resist material options for extreme ultraviolet lithography
- Development of element technologies for EUVL
- Research Articles
- Focus tolerance influenced by source size in Talbot lithography
- Flat-field anastigmatic mirror objective for high-magnification extreme ultraviolet microscopy