
Leaves of Cordia boissieri A. DC. as a potential source of bioactive secondary metabolites for protection against metabolic syndrome-induced in rats
-
Asmaa I. Owis
 ,
Amira M. Abo-youssef
,
Amira M. Abo-youssef

Abstract
Cordia boissieri A. DC. (Boraginaceae) is traditionally used as an herbal remedy for diabetes by Hispanic women in Southwestern USA. A recent investigation showed the significant protective effect of ethyl acetate extract against metabolic syndrome (MS). However, the corresponding active principles responsible for this effect and relations between their structure and biological actions remain unclear. Thus, ethyl acetate extract was subjected to column chromatography, which yielded seven compounds identified on the basis of spectroscopic data as rutin, hesperidin, kaempferol-3-O-β-d-glucopyranoside, rosmarinic acid, β-sitosterol-3-O-β-d-glucopyranoside, quercetin, and kaempferol. The isolated compounds (5 mg/kg/day) were tested in a fructose enriched-diet rat model using metformin as a standard drug. Blood samples were withdrawn for estimation of MS-associated biomarkers and liver samples were subjected to histopathological and immunohistochemical examination. The isolated compounds impaired most of the changes associated with MS as evidenced by improved insulin sensitivity, glucose tolerance, kidney function, lipid profiles and reduced oxidative stress and inflammation by different degrees. It is worth noting that quercetin and kaempferol showed the most potent effect. Structure-activity relationship study revealed that the presence of 2,3-double bond in ring C and ortho-hydroxylation in ring B increases the flavonoids activity while glycosylation or methylation decreased this activity.
1 Introduction
Cordia boissieri A. DC. (Boraginaceae), commonly named as Texas olive or anacahuita, is a beautiful, slow-growing plant whose root extracts are used as emollients in the Antilles and Mexico [1], [2]. Jellies made from the fruits are reportedly safe to eat, whereas syrup made from the fruits is used to dye cloth and treat coughs. The leaves are used to alleviate rheumatism and pulmonary illness [3]. Few phytochemical and biological studies had been reported. Dimethyl-3, 4′-kaempferol and p-hydroxybenzaldehyde were isolated from the fruits [4], [5]. Forty-two volatile compounds (97.7%) were identified in the essential oil of the flowers, mainly (−)-spathulenol (19.1%) and (E)-caryophyllene (16.2%) [6]. Methanol-based extract from the leaves of C. boissieri showed significant antimicrobial activity against drug-resistant strain of Staphylococcus aureus [7].
Natural plants as a valuable source of secondary metabolites may lower the risk of serious health disorders. Metabolic syndrome (MS) is a constellation of disorders that includes dyslipidemia, hyper-lipoproteinemia, hepatic steatosis, hypertension, obesity, and insulin resistance, which ultimately results in the onset of type 2 diabetes [8]. Many factors are implicated in the pathogenesis of MS including reactive oxygen species, increased oxidative stress [9], renin-angiotensin-aldosterone system [10], and inflammation and endothelial dysfunction [11]. Tumor necrosis factor α (TNF-α) and interleukin 6 (IL-6) have been highlighted as key mediators of MS [12], [13].
C. boissieri is used as a herbal remedy for diabetes by Hispanic women in Southwestern USA [14]. However, because of the large and growing use of naturally derived substances all over the world, it is not prudent to depend on the traditional beliefs alone; explanatory and scientific studies are necessary and should be considered complementary in the acquisition of reliable data for health caregiver. In a recent study, we reported a protective effect of ethyl acetate extract of leaves against MS [15]. However, the corresponding active principles responsible for this effect, their mechanisms, and relations between their structure and biological actions remain unclear. Thus, the main objectives of the present study were to isolate and identify the major constituents of C. boissieri ethyl acetate extract of leaves and evaluate their abilities to reverse the signs of MS in order to determine which compound(s) and functional group(s) are responsible for this activity through the analysis of their structure-activity relationship (SAR).
2 Materials and methods
2.1 General experimental procedures
Mass spectra were measured using Beckman DU7 and Shimadzu (Jeol mass spectrophotometer, 70 eV). NMR spectra were recorded on Bruker Avance III 400 MHz, 300 MHz for 1H and 100 MHz for 13C, DEPT-Q NMR (Bruker AG, Switzerland) with BBFO Smart Probe and Bruker 400 AEON Nitrogen-Free Magnet. Data were analyzed using Topspin 3.1 software. Stationary phases used for column chromatography were normal phase polyamide (Sigma-Aldrich Chemicals, St. Louis, MO, USA) and Sephadex LH-20 (E-Merck, Darmstadt, Germany). Thin-layer chromatography (TLC) was carried out using precoated silica gel F254 TLC plates (E-Merck). Metformin, fructose, mineral, and vitamin mixtures were purchased from Sigma-Aldrich USA. Glucose diagnostic kits were purchased from Biolabo SA, Maizy, France. ELISA insulin kit was obtained from Biovendor, Brno, Czech Republic. Murine TNF-α ELISA kit was obtained from Ray- Biotec Co., Norcross, GA, USA. Cholesterol and triglyceride (TG) kits were purchased from Spinreact, Girona, Spain. Uric acid, urea, and creatinine diagnostic kits were obtained from Biodiagnostics, Cairo, Egypt.
2.2 Plant material
C. boissieri leaves were collected from the region of the Alexandrian Road, Egypt, on March 2013 and were kindly authenticated by Prof. Dr. Abd Al Haleem A. Mohamed (Plant Taxonomy and Flora Research Department, Ministry of Agriculture, Giza, Egypt), to whom the authors are thankful. Voucher specimen was deposited at the Department of Pharmacognosy, Faculty of Pharmacy, Beni-Suef University, Beni-Suef, Egypt, under code BupD-24. The plant material was air-dried, ground into powder, and stored in an air-tight container until use.
2.3 Extraction and isolation
The air-dried powdered leaves of C. boissieri (2.5 kg) were extracted by cold maceration with 70% aqueous ethanol (26 l/4 times) until exhaustion. The hydroalcoholic extract was evaporated under reduced pressure to give 110.2 g of blackish semi-solid residue. The residue was suspended in distilled water (500 ml) and successively partitioned among n-hexane, chloroform, and ethyl acetate (5×500 ml; each). Ethyl acetate was evaporated under reduced pressure to afford 6.7 g residue. The ethyl acetate fraction was chromatographed on a polyamide column (120×3 cm), starting with water as an eluent then decreasing polarity by 20% methanol until 100% methanol. Subfractions (100 ml) were collected and monitored by TLC. Similar subfractions were pooled together, evaporated to dryness, and grouped into four (E1–E4). Subfraction E1 (184 mg) was subjected to polyamide column chromatography starting with 30% water/methanol then decreasing polarity by 10% to yield two subfractions: E1A and E1B. Each was separately purified on Sephadex LH-20 column chromatography using methanol to afford compound rutin (RU, 4 mg) and compound hesperidin (HE, 19 mg). Subfraction E2 (200 mg) was chromatographed on Sephadex LH-20 column using water/methanol 50% as an eluent with decreasing polarity 10% to yield compound kaempferol-3-O-β-d-glucopyranoside (KAG, 21 mg). Subfraction E3 (1.1 g) was subjected to silica gel column chromatography using ethyl acetate/methanol mixture to yield two subfractions: E3A and E3B. Subfraction E3A was further purified using Sephadex LH-20 and methanol as eluent to afford compound rosmarinic acid (RA, 9 mg), whereas subfraction E3B was purified by recrystallization from methanol to afford compound β-sitosterol-3-O-β-d-glucopyranoside (BS, 40 mg). Subfraction E4 (170 mg) was further purified with Sephadex LH-20 column chromatography to afford compound quercetin (QT, 18 mg) and compound kaempferol (KA, 14 mg).
2.4 Animals
All the experimental procedures were conducted using male Wistar Albino rats (215–217 g) purchased from National Cancer Institute, Cairo, Egypt, and left to acclimate in the animal facility of Faculty of Pharmacy, Beni Suef University, for 1 week before being subjected to experimentation. All animals were maintained under 12-h light/dark cycle, with controlled humidity (60%–80%) and constant temperature (22 °C±1 °C). Throughout the study, food and water were supplied ad libitum. The study was carried out according to the guidelines of the Ethics Committee, Faculty of Pharmacy, Beni-Suef University, which followed the recommendations of the National Institutes of Health Guide for Care and Use of Laboratory Animals [16].
2.5 Experimental protocol
Rats were randomly divided into 10 experimental groups (n=10 rats per group). Group I was fed with regular diet and water ad libitum and did not receive any treatments (negative control group, NC). Group II received fructose-enriched diet (FED) for 14 weeks and served as the FED control group. Group III received FED for 14 weeks and metformin (MET, 10 mg/kg/day) for 4 weeks. Groups IV-X received FED for 14 weeks and one of the isolated compounds, RU, HE, KAG, RA, BS, QT, and KA, with a dosage of 5 mg/kg/day for 4 weeks. Treatments started 10 weeks after the beginning of fructose feeding and continued for another 4 weeks. Blood samples were randomly collected after 4, 6, 8, and 10 weeks from the beginning of the FED. Serum levels of fasting blood glucose (FBG), TG, and total cholesterol were estimated to confirm the induction of MS. At the end of the experimental period, rats were fasted for 12 h and blood samples were collected from the retro-orbital plexus under light anesthesia and were used for the determination of FBG, insulin, total cholesterol, TG, uric acid, urea, creatinine, glutathione (GSH), malondialdehyde (MDA), nitric oxide (NOx), and TNF-α. Shortly after sera collection, rats were sacrificed, and livers were rapidly dissected and kept in 10% neutral buffered formalin. Each liver was divided into two parts. One part was used for histopathological examination and the remaining part was used for immunohistochemical examination.
2.6 Induction of MS
MS was induced by feeding rats with FED according to the method described by [17]. FED was composed of fructose (660 g/kg), soya protein (200 g/kg), sheep fat (60 g/kg), cellulose (30 g/kg), l-lysine (10 g/kg), choline chloride (10 g/kg), dl-methionine (10 g/kg), mineral mixture (10 g/kg), and vitamin mixture (10 g/kg). Diet was freshly prepared every 3–4 days and stored at 2 °C–8 °C.
2.7 Assessment of metabolic and biochemical parameters
Fasting serum glucose, total cholesterol, TG, uric acid, urea, and creatinine levels (each as mg/dl), and TNF-α level (pg/ml) were determined using test reagent diagnostic kits as described by manufacturer’s instructions. Determination of serum insulin (μIU/ml) was performed using rat insulin ELISA kit. Serum MDA, serum NOx, and blood GSH were determined according to the methods described previously [18], [19], [20].
2.8 Inducible nitric oxide synthase (iNOS) immunohistochemical analysis
Liver tissue was removed, cleaned, fixed in 10% neutral buffered formalin overnight, and transferred to 70% ethanol. Tissues were then embedded in paraffin. Paraffin-embedded tissue blocks were sectioned at 4 μm thick and were mounted on poly-l-lysine slides. Sections were air-dried, deparaffinized, and rehydrated. Mounted specimens were washed in 0.01 mol/l phosphate-buffered saline (PBS). After three washes with PBS, an antigen retrieval solution (0.01 M citrate buffer, pH 6.0) was given for 10 min at 100 °C in a microwave oven and endogenous peroxidase was eliminated by incubation in 3% H2O2 in pH 7.4 in PBS (0.01 M) for 10 min. After washing, the specimens were treated with a blocking serum (Labvision, TR-060-UB) at room temperature for 10 min. The sections were incubated with primary rabbit polyclonal anti-iNOS (dilution 1:100; Santa Cruz Biotechnology, Santa Cruz, CA, USA) at room temperature for 1 h. The sections were washed three times with PBS and incubated with the biotinylated secondary antibody (Dako, Ely, UK), and streptavidin peroxidase (Dako) was added at room temperature for 30 min. Diaminobenzidine (Sigma Chemical) was used as a chromogen. The sections were counterstained with hematoxylin and prepared for microscopic examination. Brown cytoplasmic and/or nucleolus staining in cells were considered positive [21].
2.9 Histopathological examinations
Liver tissue specimens were fixed in 10% neutral buffered formalin. The fixed specimens were trimmed, washed, and dehydrated in ascending grades of alcohol, cleared in xylene, embedded in paraffin, sectioned at 4–6 μm thick, and stained by hematoxylin and eosin according to [22]. Sections were evaluated for the degree of steatosis (scale of 0–3), lobular inflammation (scale of 0–3), and hepatocellular ballooning (scale of 0–2), as described by [23].
2.10 Statistical analysis
Data were expressed as mean values±SEM. Comparison between the mean values of different groups was carried out by one-way analysis of variance (ANOVA), followed by Tukey-Kramer post hoc test for multiple comparisons. P-values<0.05 were selected to indicate statistical significance between groups.
3 Results
3.1 Isolation and identification of major constituents from the leaves of C. boissieri
Phytochemical investigation of ethyl acetate-soluble fraction of the hydroalcoholic extract of C. boissieri leaves led to the isolation of seven compounds (Figure 1): three flavonoid glycosides (RU, HE, and KAG), two flavonoid aglycones (QT and KA), one phenolic acid (RA), and one sterol glucoside (BS) for the first time from this species. Their structures, which were identified by MS, NMR spectroscopy, and comparison with literature data, are given in the following.
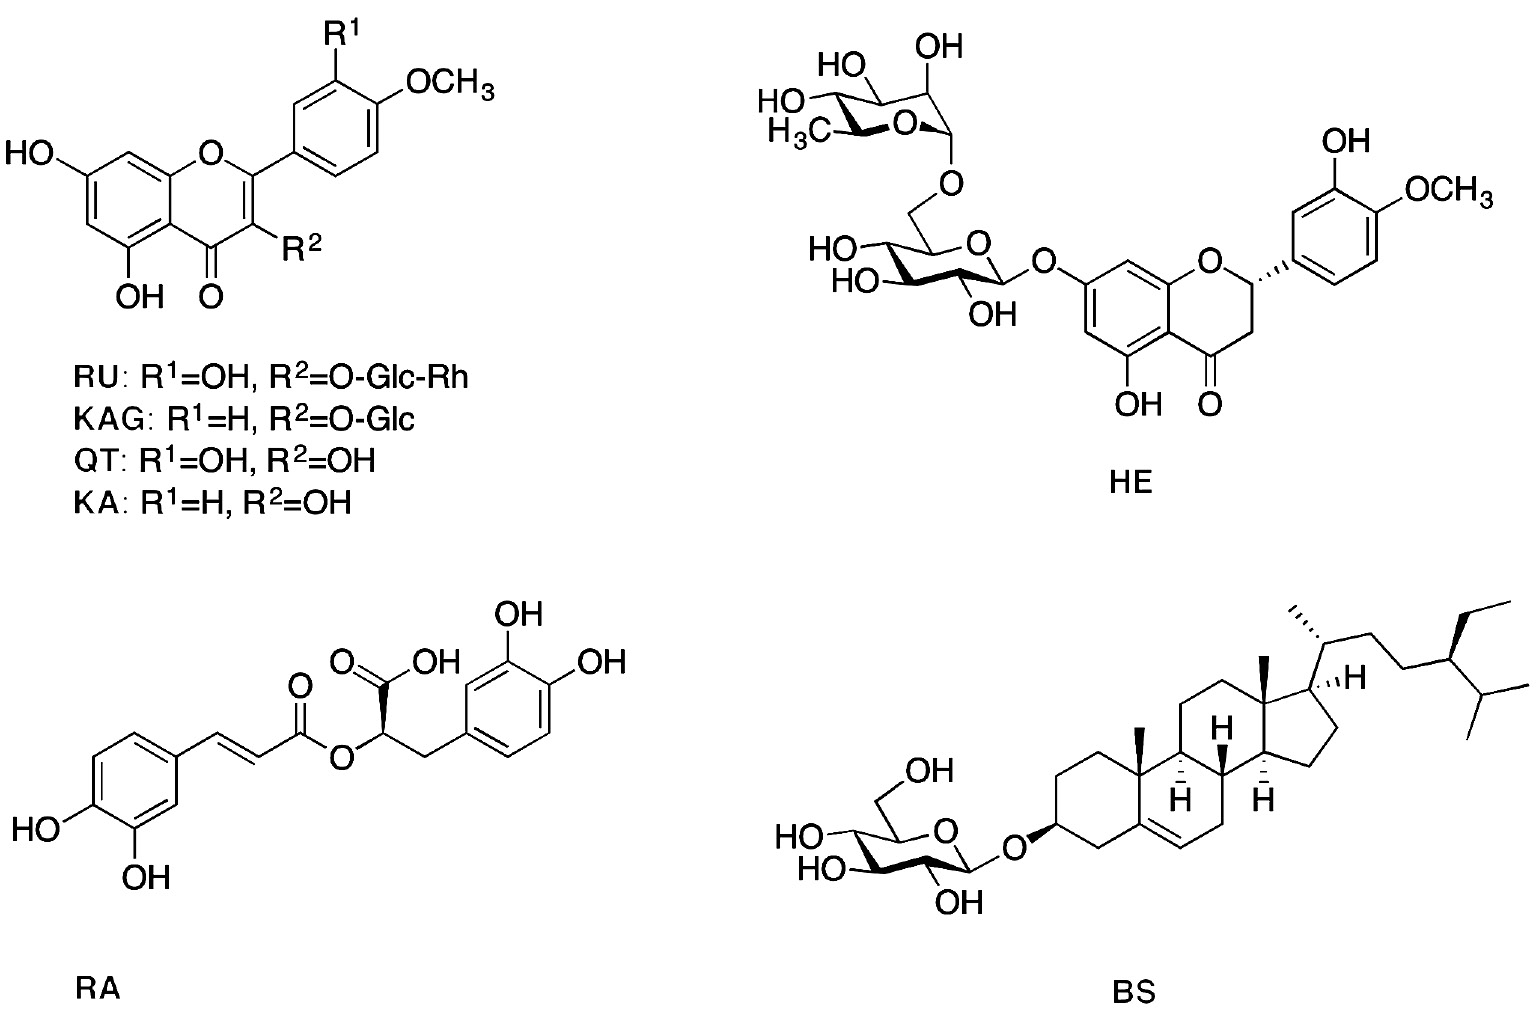
Structure of compounds isolated from the ethyl acetate fraction of C. boissieri.
3.1.1 Rutin (RU)
Yellow amorphous powder; ESIMS (m/z)=610 [M]+, 463 [M-rhamnose]+, 302 [M-rhamnose-glucose]+; 1H-NMR (300 MHz, DMSO-d6): δ 12.54 (s, OH), 7.55 (2H, m, H-2′, 6′), 6.86 (1H, d, J=9.0 Hz, H-5′), 6.39 (1H, d, J=1.9 Hz, H-8), 6.20 (1H, d, J=1.9 Hz, H-6), 5.34 (1H, d, J=7.5 Hz, H-1″), 4.38 (1H, s, H-1″′), 3.68–3.07 (sugar H), 1.00 (3H, d, J=6.3 Hz, OCH3) [24].
3.1.2 Hesperidin (HE)
Whitish powder; 1H-NMR (400 MHz, MeOD): δ 7.02 (2H, m, H-5′, 6′), 6.96 (1H, s, H-2′), 6.25 (2H, s, H-8), 6.20 (2H, s, H-6), 5.43 (1H, dd, J=13.3, 3.7 Hz, H-2), 4.96 (1H, d, J=6.5 Hz, H-1″), 4.71 (1H, s, H-1″′), 3.90 (3H, s, 4′-OCH3), 5.4–3.20 (sugar H), 3.15 (1H, dd, J=2.7, 1.5 Hz, H-3b), 2.82 (1H, dd, J=16.7, 4.0 Hz, H-3a), 1.2 (3H, d, J=6.2 Hz, H-6″′); DEPTQ-NMR (100 MHz, MeOD): δ 197.5 (C-4), 165.6 (C-5), 163.5 (C-7), 162.9 (C-9), 149.4 (C-3′), 145.9 (C-4′), 131.3 (C-1′), 118.4 (CH-6′), 114.6 (CH-5′), 112.4 (CH-2′), 103.8 (C-10), 101.1 (CH-1″′), 99.9 (CH-1″), 96.8 (CH-8), 96.0 (CH-6), 78.8 (CH-2), 76.7 (CH-5″), 75.9 (CH-3″), 73.4 (CH-4″′), 72.5 (CH-2″), 71.1 (CH-2″′), 70.7 (CH-3″′), 70.0 (CH-4″), 68.8 (CH-5″′), 66.4 (CH2-6″), 56.1 (4′-OCH3), 42.5 (CH2-3), 18.3 (CH3-6″′) [24].
3.1.3 Kaempferol-3-O-β-d-glucopyranoside (KAG)
Yellow amorphous powder; 1H-NMR (400 MHz, DMSO-d6): δ 12.5 (br. s, OH), 7.98 (2H, d, J=7.8 Hz, H-2′, 6′), 6.86 (2H, d, J=7.5 Hz, H-3′, 5′), 6.37 (1H, s, H-8), 6.14 (1H, s, H-6), 5.31 (1H, d, J=6.1 Hz, H-1″), 4.1–3.1 (sugar H); DEPTQ-NMR (100 MHz, DMSO-d6): δ 177.6 (C-4), 165.7 (C-7), 161.4 (C-5), 160.1 (C-4′), 156.9 (C-2), 156.8 (C-9), 133.5 (C-3), 131.3 (CH-2′, CH-6′), 121.3 (C-1′), 115.6 (CH-3′, CH-5′), 103.9 (C-10), 101.5 (CH-1″), 99.6 (CH-6), 94.4 (CH-8), 77.3 (CH-3″), 76.5 (CH-5″), 74.4 (CH-2″), 70.0 (CH-4″), 61.1 (CH2-6″) [25].
3.1.4 Rosmarinic acid (RA)
Yellow amorphous powder; 1H-NMR (300 MHz, DMSO-d6): δ 8.9 (br. s, OH), 7.42 (1H, d, J=15.9 Hz, H-7), 7.03 (1H, d, J=1.8 Hz, H-2), 6.97 (1H, dd, J=8.1, 1.8 Hz, H-6), 6.76 (1H, d, J=8.1 Hz, H-5), 6.66 (1H, d, J=1.8 Hz, H-2′), 6.68 (1H, d, J=8.1 Hz, H-5′), 6.51 (1H, dd, J=8.1, 1.8 Hz, H-6′), 6.24 (1H, d, J=15.9 Hz, H-8), 4.94 (1H, dd, J=9, 3.6 Hz, H-8′), 3.14 (1H, dd, J=14.1, 3.3 Hz, H-7′a), 2.99 (1H, dd, J=14.4, 9 Hz, H-7′b); 13C-NMR (100 MHz, MeOD): δ 176.6 (C-9′), 168.9 (C-9), 149.4 (C-4), 146.8 (C-3), 146.7 (C-7), 145.9 (C-3′), 144.8 (C-4′), 130.8 (C-1′), 127.9 (C-1), 122.9 (C-6), 121.8 (C-6′), 117.5 (C-2′), 116.5 (C-5), 116.2 (C-5′), 115.4 (C-8), 115.2 (C-2), 77.0 (C-8′), 38.6 (C-7′) [25].
3.1.5 β-Sitosterol-3-O-β-d-glucopyranoside (BS)
White crystals; 1H-NMR (400 MHz, pyridine): δ 5.36 (1H, m, H-5), 5.06 (1H, d, J=7.6 Hz, H-1′), 4.60–3.99 (sugar H), 3.92 (1H, m, H-3), 0.99 (3H, d, J=6.2 Hz, H-19), 0.93 (3H, s, H-29), 0.88 (3H, d, J=7.3 Hz, H-26), 0.87 (3H, m, H-24), 0.86 (3H, d, J=7.3 Hz, H-27), 0.66 (3H, s, H-28); DEPTQ-NMR (100 MHz, pyridine): δ 11.86 (CH3-29), 12.16 (CH-18), 18.80 (CH3-26), 19.00 (CH3-19), 19.22 (CH3-27), 21.02 (CH2-21), 23.16 (CH2-11), 24.30 (CH2-15), 26.04 (CH2-23), 28.34 (CH2-16), 29.22 (CH3-28), 30.01 (CH2-2), 31.83 (CH-25), 31. 96 (CH2-7), 33.97 (C-10), 36.17 (CH-8), 36.70 (CH2-20), 37.26 (CH2-1), 39.09 (CH2-12), 39.73 (C-13), 42.26 (CH2-4), 45.80 (CH-22), 50.11 (CH-9), 56.01 (CH3-24), 56.61 (CH-17), 62.53 (CH2-6′), 71.43 (CH-14), 75.07 (CH-4′), 78.00 (CH-2′), 78.20 (CH-5′), 78.31 (CH-3′), 78.45 (CH-3), 102.37 (CH-1′), 121.65 (CH-6), 140.62 (C-5) [26].
3.1.6 Quercetin (QT)
Yellow powder; Rf: 0.55 in chloroform-methanol 9:1 (v/v); 1H-NMR (300 MHz, DMSO-d6): δ 12.48 (s, OH), 10.77 (s, OH), 9.57 (s, OH), 9.31 (s, OH), 7.67 (1H, d, J=2.1 Hz, H-2′), 7.54 (1H, dd, J=8.5, 2.1 Hz, H-6′), 6.89 (1H, d, J=8.5 Hz, H-5′), 6.41 (1H, d, J=2.0 Hz, H-8), 6.19 (1H, d, J=2.0 Hz, H-6) [24].
3.1.7 Kaempferol (KA)
Yellow powder; Rf: 0.6 in chloroform-methanol 9:1; 1H-NMR (400 MHz, MeOD): δ 8.11 (2H, d, J=8.2 Hz, H-2′, 6′), 6.93 (2H, d, J=8.2 Hz, H-3′, 5′), 6.42 (1H, s, H-8), 6.20 (1H, s, H-6) [24].
3.2 Effect of isolated compounds on MS
3.2.1 Effects of isolated compounds on body weight, serum glucose, and insulin levels
The data presented in Table 1 show that the FED group exhibited clustering features of MS as manifested by a significant increase in final body weight, FBG, and serum insulin levels as compared to the normal control group. QT and MET supplementation was able to reduce final body weight significantly (P<0.05) after 4 weeks of treatment. The impaired glucose tolerance could be improved by MET, QT, KA, and RU administration, which attenuates the rise in both insulin and glucose levels as compared to the FED control group.
Effects of isolated compounds on body weight gain, serum glucose, and insulin levels.
| Parameters | Normal control (n=10) | Fructose-fed (n=10) | ||||||||
|---|---|---|---|---|---|---|---|---|---|---|
| Control | MET | KA | BS | RA | KAG | HE | RU | QT | ||
| Initial body weight (g) | 216.13±1.12 | 215.32±1.03 | 215.90±0.92 | 217.21±0.82 | 215.84±0.95 | 215.57±0.92 | 217.22±0.88 | 216.36±1.00 | 215.51±0.83 | 216.60±1.01 |
| Final body weight (g) | 334.24±2.14 | 374.32±2.11a | 337.24±3.42b | 354.83±6.70a | 360.26±5.56a | 362.90±4.40a | 357.84±3.92a | 363.13±3.93a | 361.47±3.50a | 334.50±3.47b |
| Glucose (mg/dl) | 65.32±2.07 | 185.80±3.08a | 69.39±2.32b | 67.25±3.35b | 86.52±2.42a,b | 106.90±3.60a,b,c | 91.34±2.41a,b | 86.70±3.90a,b | 78.61±2.81b | 65.18±2.47b |
| Insulin (μIU/ml) | 10.33±058 | 31.94±0.40a | 11.50±0.21b | 15.40±0.64a,b,c | 17.72±0.64a,b,c | 21.15±0.73a,b,c | 16.40±0.62a,b,c | 16.23±0.72a,b,c | 14.93±0.60a,b | 14.63±0.51a,b |
Data are expressed as mean±SEM. Statistical analysis was carried out using ANOVA followed by Tukey-Kramer multiple comparisons test. aSignificantly different from the normal control group at P<0.05. bSignificantly different from the FED control group at P<0.05. cSignificantly different from metformin-treated group at P<0.05.
3.2.2 Effects of isolated compounds on lipid profile and kidney function
As shown in Table 2, MS affected both lipid profile (as indicated by elevated serum levels of total cholesterol and TG) and kidney function (as indicated by elevated serum levels of uric acid, urea, and creatinine) in FED rats when compared to normal control group (P<0.05). Administration of MET, QT, KA, and RU significantly alleviated dyslipidemia by decreasing total serum cholesterol and TG levels. Treatment with MET reversed the elevated serum levels of uric acid, urea, and creatinine, whereas other treatments reduced their levels except BS and RA; they did not significantly alter the serum urea level.
Effects of isolated compounds on kidney function, lipid profile, and oxidative stress biomarkers TNF-α and NOx.
| Parameters | Normal control (n=10) | Fructose-fed (n=10) | ||||||||
|---|---|---|---|---|---|---|---|---|---|---|
| Control | MET | KA | BS | RA | KAG | HE | RU | QT | ||
| Uric acid (mg/dl) | 2.51±0.32 | 7.48±0.44a | 2.91±0.14b | 3.91±0.29b | 4.40±0.34a,b | 5.14±0.27a,b,c | 4.94±0.40a,b,c | 3.73±0.34b | 3.34±0.22b | 3.33±0.30b |
| Urea (mg/dl) | 29.14±1.32 | 56.72±1.52a | 31.52±1.28b | 44.24±2.21a,b | 48.03±3.60a,c | 54.53±2.70a,c | 45.80±3.00a,b | 43.64±2.30a,b | 43.17±2.20a,b | 36.47±3.50b |
| Creatinine (mg/dl) | 0.43±0.03 | 0.89±0.04a | 0.48±0.04b | 0.54±0.03b | 0.62±0.03a,b,c | 0.74±0.05a,c | 0.65±0.03a,b,c | 0.57±0.04a,b | 0.56±0.03b | 0.44±0.03b |
| TG (mg/dl) | 45.91±2.92 | 95.60±2.53a | 49.73±1.76b | 52.70±1.84b | 57.93±1.30a,b | 57.34±2.90a,b | 57.18±2.12a,b | 57.61±1.50a,b | 53.20±2.06b | 47.90±1.80b |
| Total cholesterol (mg/dl) | 49.92±2.93 | 90.33±1.16a | 50.00±1.54b | 60.15±1.90b | 61.88±2.80b | 67.90±2.83a,b,c | 62.94±2.40b | 63.20±3.24b | 60.23±2.70b | 59.51±2.13b |
| MDA (nmol/ml) | 2.38±0.21 | 7.95±0.32a | 3.15±0.11b | 3.54±0.40b | 4.95±0.38a,b,c | 5.14±0.30a,b,c | 3.73±0.34b | 3.91±0.30b | 3.54±0.40b | 3.33±0.30b |
| GSH (mg%) | 75.33±1.70 | 32.54±3.24a | 71.32±1.62b | 69.60±2.16b | 59.22±2.55a,b,c | 52.73±3.40a,b,c | 55.90±2.82a,b,c | 56.83±1.34a,b,c | 66.31±2.54a,b | 71.54±2.54b |
| TNF-α (pg/ml) | 40.47±2.31 | 156.32±5.15a | 43.31±2.44 b | 49.24±1.36a,b | 54.23±2.50a,b | 58.71±3.70a,b,c | 54.37±1.80a,b | 58.19±1.92a,b,c | 51.93±1.60a,b | 48.84±1.73a,b |
| NOx (UM) | 40.17±2.12 | 85.43±2.54a | 44.31±3.14b | 53.33±1.83b | 59.92±2.90a,b,c | 61.92±2.50a,b,c | 57.22±2.62a,b | 56.93±2.80a,b | 55.12±2.90b | 51.07±1.80b |
Data are expressed as mean±SEM. Statistical analysis was carried out using ANOVA followed by Tukey-Kramer multiple comparisons test. aSignificantly different from the normal control group at P<0.05. bSignificantly different from the FED control group at P<0.05. cSignificantly different from metformin-treated group at P<0.05.
3.2.3 Effects of isolated compounds on oxidative stress biomarkers, TNF-α, and NOx levels
The data presented in Table 2 show that MS affected oxidative stress biomarkers (as indicated by increase in serum MDA level and reduction in blood GSH level) in addition to TNF-α and NOx (as indicated by rise in their serum levels) with respect to the normal control group (P<0.05). Oral administration of MET, QT, KA, RU, KAG, and HE totally reduced serum MDA level, whereas only MET, QT, and KA completely attenuated the decrease in blood GSH level. Regarding TNF-α and NOx, all tested compounds significantly decreased serum TNF-α level, but only MET, QT, KA, and RU totally attenuated the increase in NOx serum levels, whereas the remaining treatments caused mild reduction in its level.
3.3 Immunohistochemical (iNOS) findings
As illustrated in Figure 2, the NC group showed no detectable stain granules in the cytoplasm and nuclei. The brown granules were noticed in the endothelial lining of hepatic sinusoids and portal blood vessels only. The FED group revealed a uniform distribution of stain in the hepatocytes in both the cytoplasm and nuclei of degenerated cells. Treatment of rats with MET showed relatively no detectable stain in cytoplasm and nuclei. The KA-treated group showed steatosis of the hepatocytes and staining of the cytoplasm without nuclei. The BS-treated group showed steatosis of the hepatocytes and moderate detectable stain. RA showed strong staining of the hepatocytes’ cytoplasm and nuclei of necrobiotic cells. The KAG group revealed patchy areas with detectable stain of both the cytoplasm and nuclei. Treatment of rats with HE displayed moderate staining of the hepatocytes’ cytoplasm, which was occupied by fat globule. The RU group displayed moderate staining of both the cytoplasm and nuclei of hepatocytes. Hepatocytes showed staining of cytoplasm without nuclei in group treated with QT.
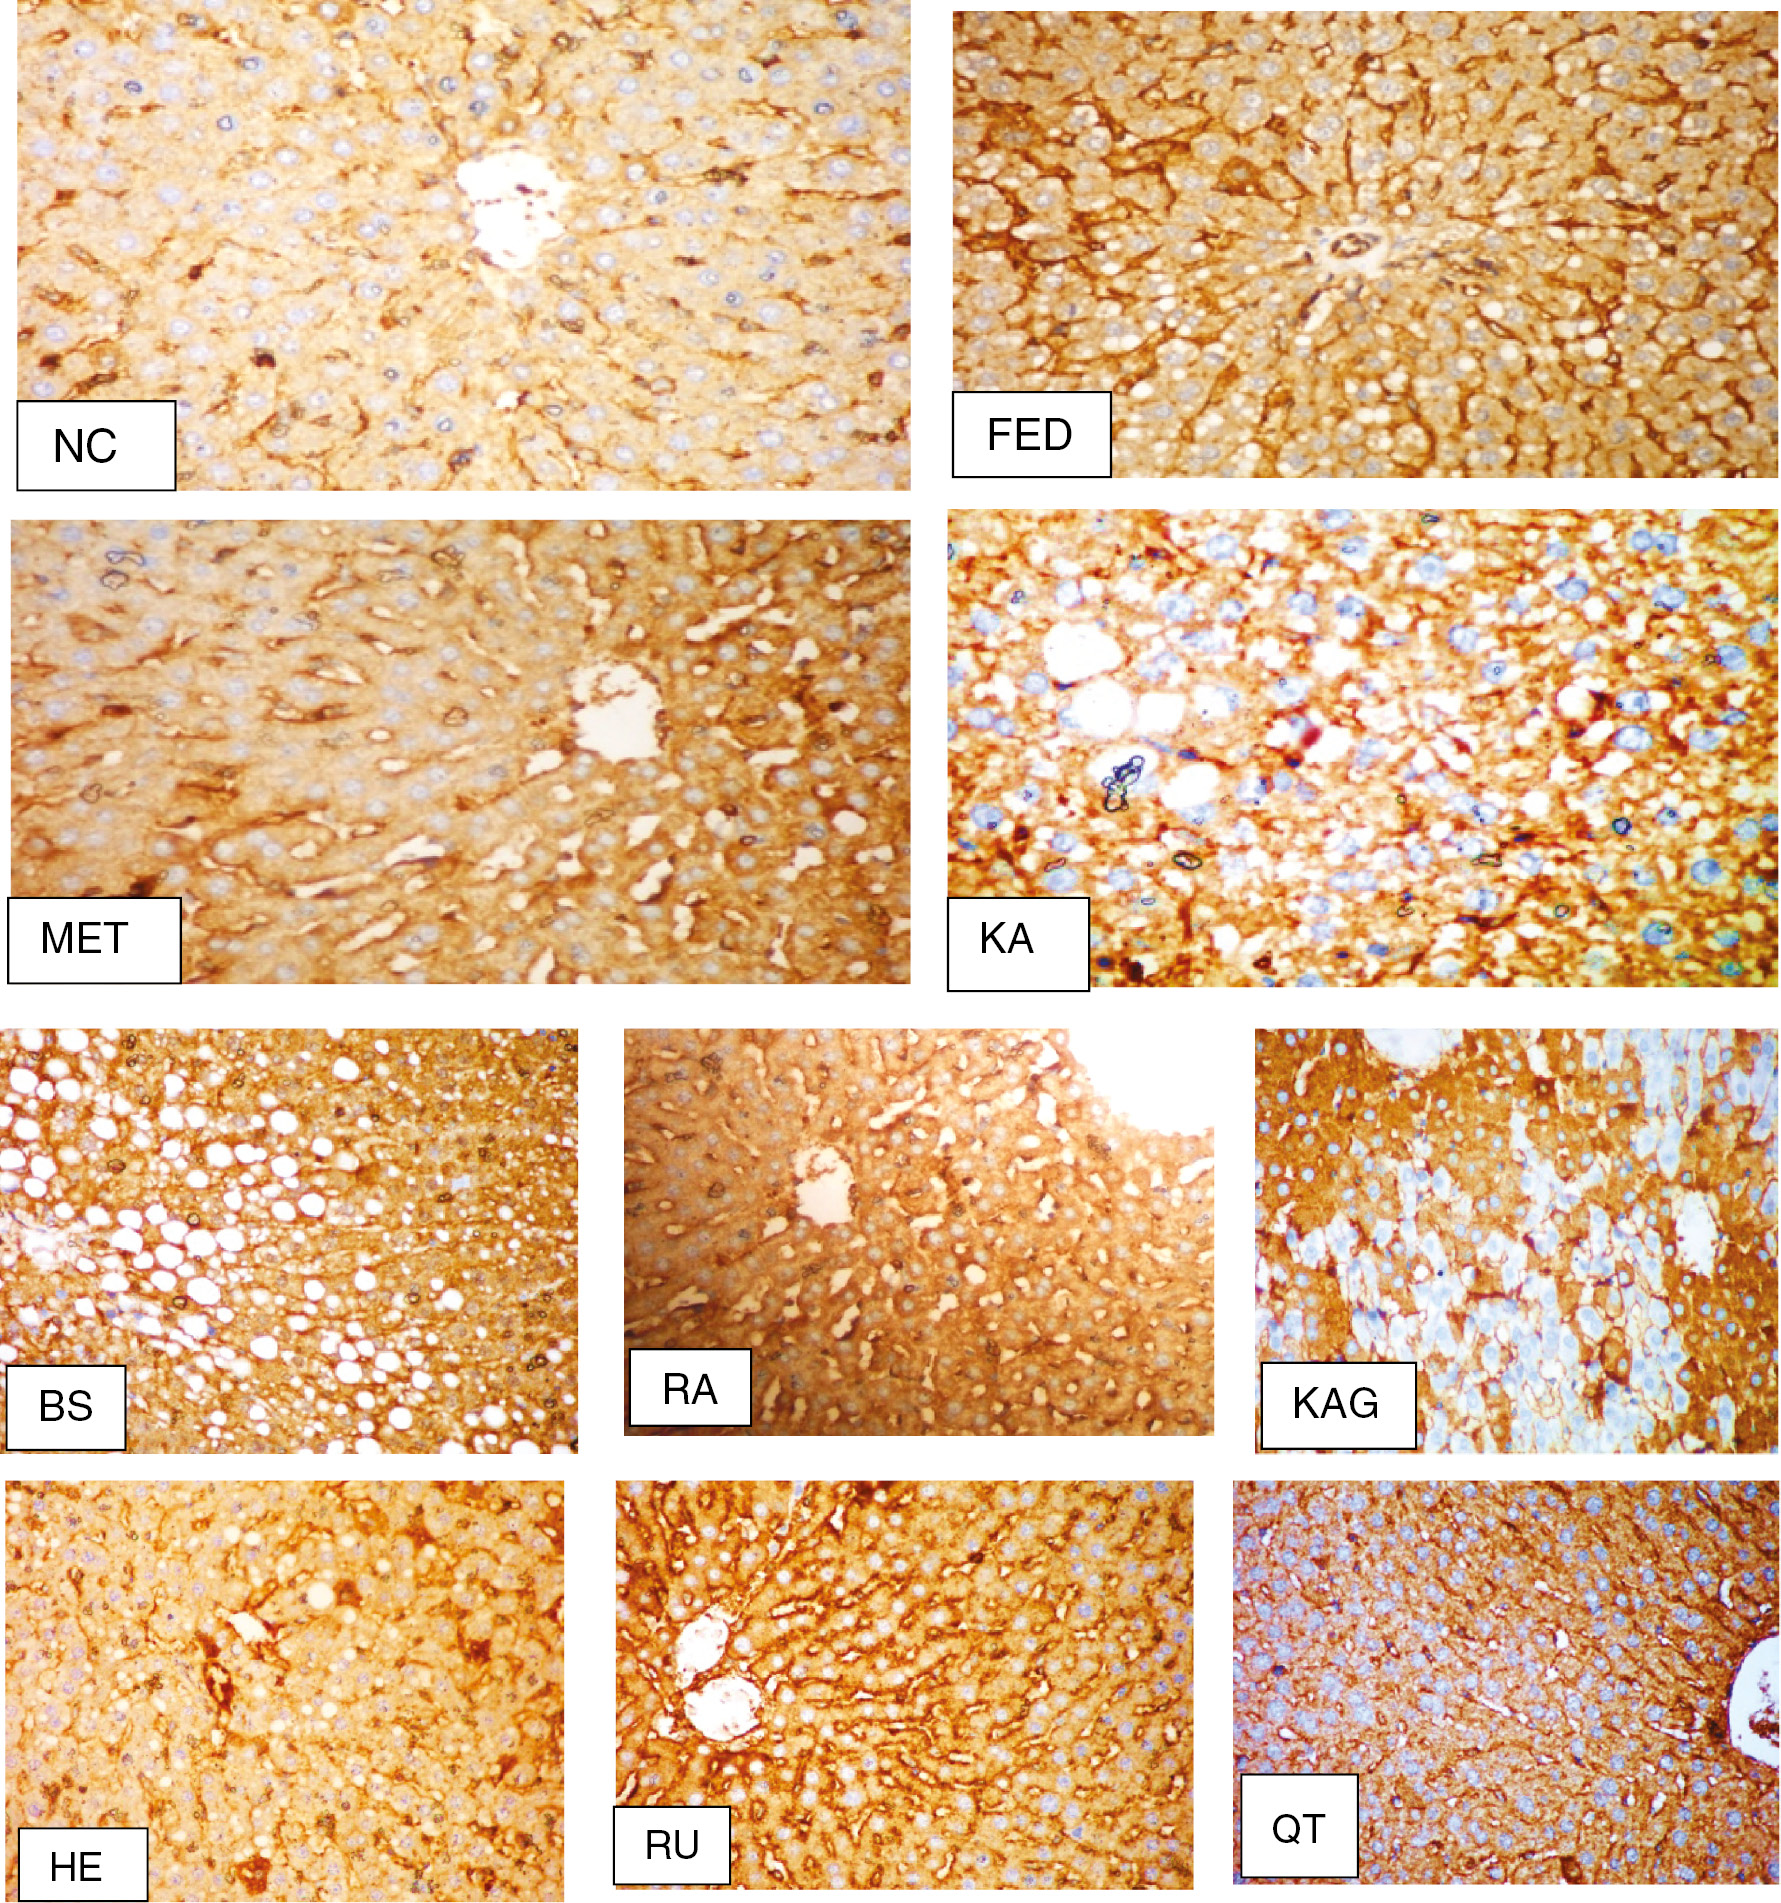
Immunohistochemical (iNOS) findings (original magnification×200). NC group, no detectable stain in the cytoplasm or nuclei; FED group, with uniform distribution of stain in the hepatocytes; MET group, no detectable stain in the cytoplasm or nuclei; KA group, with staining of cytoplasm without nuclei; BS group, with moderate detectable stain; RA group, with strong staining of hepatocytes cytoplasm and nuclei; KAG group, with patchy areas with detectable staining of both cytoplasm and nuclei; HE group, with relative staining of iNOS in the cytoplasm of the hepatocytes; RU group, hepatocytes showing moderate staining of both cytoplasm and nuclei; QT group, hepatocytes showing staining of cytoplasm without nuclei.
3.4 Histopathological examination
As illustrated in Table 3 and Figure 3, the NC group showed normal histological structure of the hepatic lobules and organization of the hepatic cords. Steatosis, lobular inflammation, and ballooning of hepatocytes were noted (score 0). The FED group revealed disorganization of the hepatic cord, massive steatosis of the hepatocytes (score 3), and lobular inflammation and ballooning (score 2). The MET-treated group appeared to resemble the control group in steatosis and lobular inflammation grade (score 0), but with hepatocytes ballooning (score 1). The KA-treated group showed steatosis of some hepatocytes, lobular inflammation, and ballooning (grade 1). The BS group displayed steatosis, lobular inflammation (score 2), and ballooning (score 1). Meanwhile, the RA group resembled the FED group, with massive steatosis of hepatocytes (score 3) and lobular inflammation and ballooning (score 2). Treatment with KAG induced ballooning and steatosis (score 2), with lobular inflammation (score 1). Group treated with HE showed cell ballooning (score 1), lobular inflammation (score 2), and apoptosis. The RU group showed cell ballooning (score 2) and lobular inflammation (score 1). The QT-treated group showed restored normal histological structure of the hepatic lobules, steatosis and lobular inflammation of hepatocytes (score 0), but with cell ballooning (score 1).
Histological scoring and grading system.
| Group | Scoring | ||
|---|---|---|---|
| Steatosis (0–3) | Lobular inflammation (0–3) | Hepatocyte ballooning (0–2) | |
| NC | 0 | 0 | 0 |
| FED | 3 | 2 | 2 |
| MET | 0 | 0 | 1 |
| KA | 1 | 1 | 1 |
| BS | 2 | 2 | 1 |
| RA | 3 | 2 | 2 |
| KAG | 2 | 1 | 2 |
| HE | 0 | 2 | 1 |
| RU | 0 | 1 | 2 |
| QT | 0 | 0 | 1 |
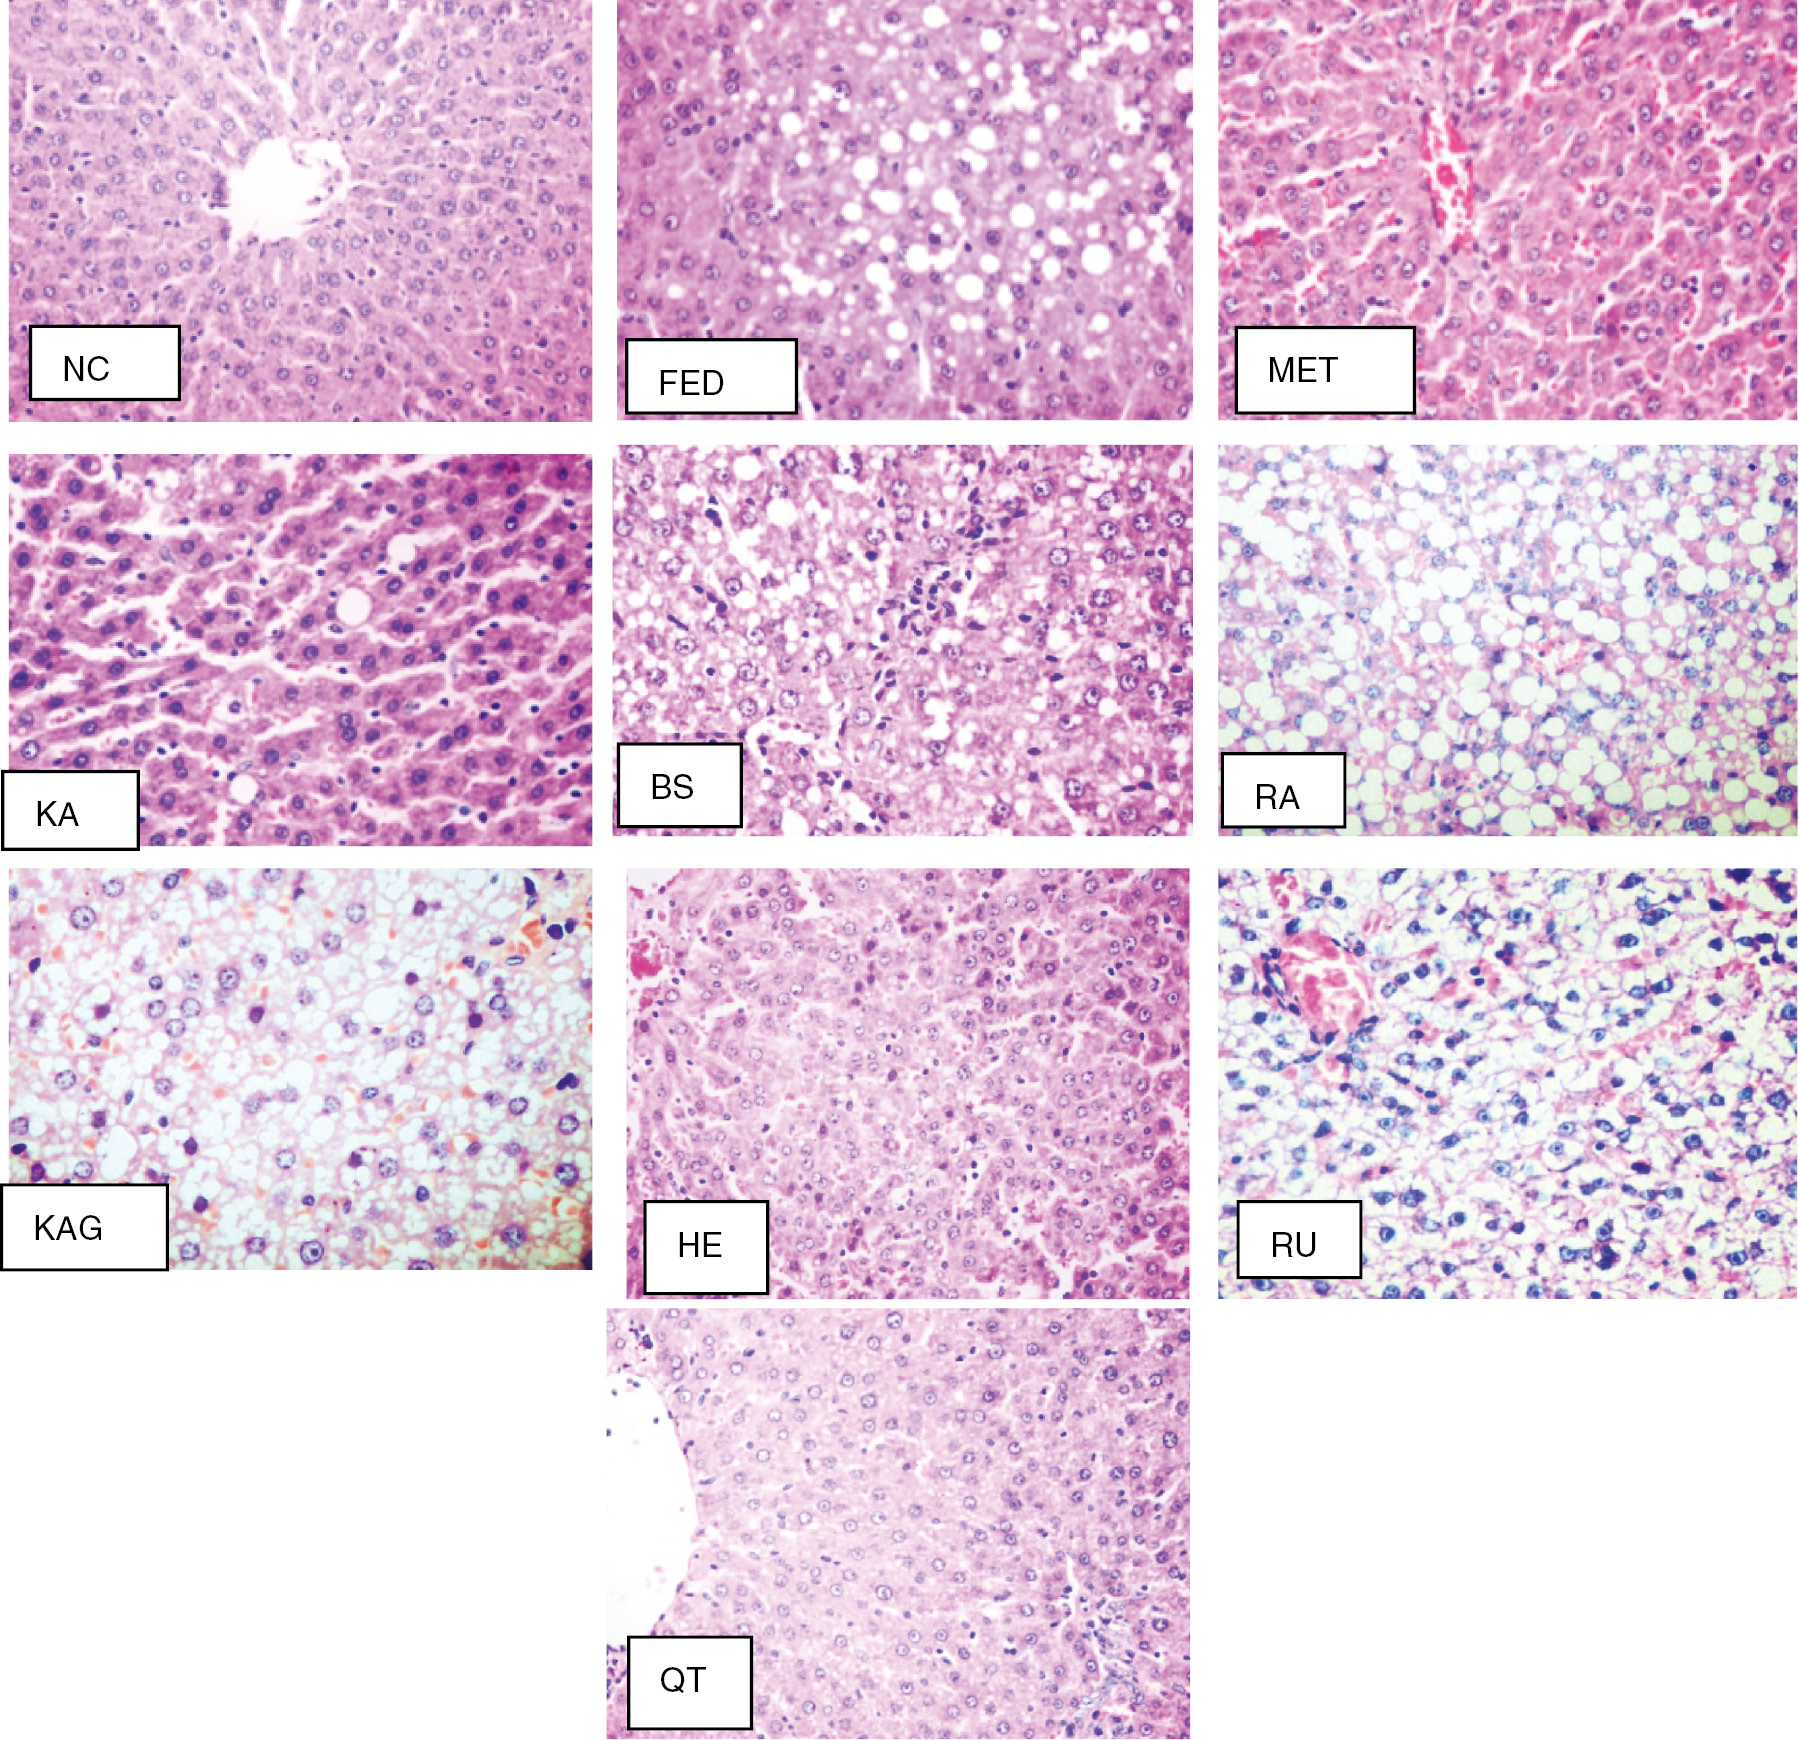
Histopathological examination (original magnification×200). NC group, normal histological structure (score 0); FED group, severe steatosis (score 3); MET group, complete absence of steatosis (score 0); KA group, with few fatty cells (score 1); BS group, steatosis (score 2), lobular inflammation (score 2) and ballooning (score 1); RA group, steatosis (score 3), lobular inflammation (score 2) and ballooning (score 2); KAG group, with ballooning and steatosis (score 2) with lobular inflammation (score 1); HE group, with cell ballooning (score 1), lobular inflammation (score 2), and apoptosis. RU group, cell ballooning (score 2) and lobular inflammation (score 1).
4 Discussion
4.1 Effect of isolated compounds on fructose-induced MS in rats
In a recent study, the ethyl acetate extract of C. boissieri leaves attenuated most of the changes associated with MS as marked by improved insulin sensitivity, glucose tolerance, kidney function, and lipid profiles and reduced oxidative stress and inflammation [15]. One of the objectives of the current study is to investigate which compound(s) is responsible for this activity by evaluating the effects of different constituents isolated from this extract on MS in fructose-fed rats including insulin resistance, lipid profiles, and oxidative stress biomarkers as well as liver and kidney function, in addition to confirming the obtained results by histopathological and immunohistochemical studies. Maintaining rats on high-carbohydrate diet developed MS as revealed by insulin resistance, dyslipidemia, vascular dysfunction, and inflammation [27]. The animal model is a useful tool for studying the underlying mechanisms of MS and the effectiveness of different treatment strategies [28]. Insulin resistance is the thread that runs through many chronic afflictions of modern times such as obesity, heart disease, and, most conspicuously, the major MS-developed affliction – type 2 diabetes [29]. Treatment of insulin-resistant rats with QT, KA, and RU for 4 weeks significantly decreased FBG and insulin levels when compared to FED control rats. The hypoglycemic effect of these three flavonoids may be due to the reduction of glucose absorption through inhibition of α-glucosidase activity, increase of adenosine monophosphate-activated protein kinase activity, and glucose transporter 4 (GLUT4) expression in skeletal muscle cells [30]. Furthermore, QT inhibits both glycogen phosphorylase a, b and hepatic glucose-6-phosphatase [31], reduces glucose absorption mediated by GLUT2 [32], and increases GLUT4 transporters in skeletal muscle [33]. In addition, [34] reported that KA has the ability to restore β-cell function. Moreover, RU possesses a protective effect on pancreatic β-cells, restores glycogen content and hexokinase activity, and decreases glucose-6-phosphatase and fructose-1,6-bisphosphatase activities [35]. These results verify multiple sites of action for flavonoids in the modulation of glucose homeostasis.
KA, RU, and QT again alleviated dyslipidemia. These results are in harmony with [36], who reported that QT and structurally similar flavonoids inhibit lipid absorption and lipogenesis. They might act through the modulation of the activity of different enzymes involved in lipid metabolism such as pancreatic lipase [37] and the expression of transcription factors involved in TG and cholesterol synthesis, for example, sterol regulatory element-binding proteins SREBP-1 and SREBP-2 [38].
Flavonoids of C. boissieri significantly ameliorated the glomerular filtration rate and kidney function as shown by reduced serum uric acid, urea, and creatinine levels. The favorable effect of these constituents could be explained by the modulation of the expression level of renal specific transporters and enhancement of renal excretion of urate in FED rats [39].
It has been demonstrated that KA and QT succeeded in the complete correction of oxidative stress in MS rats. These results confirmed their antioxidant potential reported by [40]. The antioxidant activities of these flavonoids are mediated both by their structural features and by their location in the membrane. Flavonoids are known to anchor on the polar head of the main phospholipids. Hence, distributed on the surface of the lipid bilayers as well as the aqueous phase and could scavenge free radicals as a result of their hydrogen-donating ability [41].
In the current study, all tested compounds significantly decreased the serum TNF-α level but only KA, RU, and QT totally reduced NOx activity. This is in good accordance with the immunohistochemistry studies that reported the attenuation of iNOS expression [42]. Flavonoids are well known to interfere with inflammatory signaling, inflammatory cytokines [43], and the expression of the pro-inflammatory iNOS and reduction of TNF-α secretion and NOx production [44]. Another possible explanation is related to decreased levels of uric acid. Hyperuricemia has been shown to mediate pro-inflammatory response in the adipose tissue and has been associated with inflammation. Uric acid induced up-regulation of monocyte chemoattractive protein expression and increased macrophage infiltration and proinflammatory responses in adipose tissue [45].
The protective effects of KA and QT were further confirmed histologically through improvement of hepatic structure.
4.2 Comparative structural evaluation of protective effect of isolated compounds against fructose-induced MS in rats
According to the results of the present study, all isolated flavonoids showed protective effect in different degrees against fructose-induced MS in rats, whereas BS and RA showed the least or almost no activity, suggesting that the basic flavonoid nucleus possesses activity itself. The main flavonoid skeleton includes two benzene rings on either side of a three-carbon ring (Figure 4). Multiple substitutions by hydroxyl, sugar, oxygen, and methyl groups attached to these structures create series of flavonoids that differ in activities and potencies. There is a tight correlation between the considered flavonoid structures RU, HE, KAG, QT, and KA (Figure 1) and the observed pharmacological effects (Table 1–3; Figures 2 and 3). Flavonoids with free hydroxyl groups (QT and KA) were the most active compounds of the evaluated series (RU, KAG, and HE). This indicates that glycosylation at C-3 ring C (RU, KAG) or C-7 ring A (HE) and methoxylation at C-4′ ring B (HE) decreased the activity. Moreover, QT, having an extra hydroxyl group at C-3′ ring B, was more potent than KA. This indicates that the number of OH groups in the B ring is important for activity, which may be attributed to their ability to establish H-bond between the flavonoid and its target [46]. The absence of a double bond between C-2 and C-3 in ring C (HE) decreased the activity. This double bond is an essential feature for recognition and strong binding to several receptors [46]. Figure 4 shows the important structural features that interfere with the effect of flavonoids on MS.
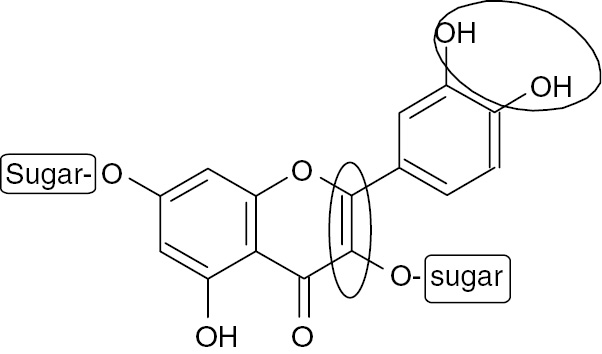
Structural elements in flavonoids that increase (circle) or decrease (rectangle) activity against MS.
5 Conclusions
Seven known compounds were isolated for the first time from the ethyl acetate-soluble fraction of the hydroalcoholic extract of C. boissieri leaves: three flavonoid glycosides, two flavonoid aglycones, one phenolic acid, and one sterol glucoside. This study provides scientific evidence of the health benefits of C. boissieri consumption. The isolated compounds impaired most of the changes associated with MS as evidenced by improved insulin sensitivity, glucose tolerance, kidney function, lipid profiles, and reduced oxidative stress and inflammation. It is worth noting that QT and KA showed the most potent effect. Isolation of structurally related flavonoids enabled to test the relationship between their structure and pharmacological actions. The presence of 2,3-double bond in ring C and ortho-hydroxylation in ring B increases the activity of flavonoids against MS, whereas glycosylation or methylation decreased this activity. More studies are required to compare the effect of the active flavonoids in combination with commercially used pharmaceutical agents aiming at decreasing side effects induced by these drugs.
References
1. Barwick M, Van der Schans A, Claudy JB. Tropical and subtropical trees: a worldwide encyclopaedic guide. UK: Thames & Hudson Ltd, 2004.Search in Google Scholar
2. Hirschhorn HH. Botanical remedies of South and Central America, and the Caribbean: an archival analysis. Part I J Ethnopharmacol 1981;4:129–58.10.1016/0378-8741(81)90032-5Search in Google Scholar
3. Janick J, Paull RE. The encyclopedia of fruit and nuts. London, UK: CABI, 2008.10.1079/9780851996387.0000Search in Google Scholar
4. Domínguez X, Escarria S, Butruille D. Dimethyl-3, 4′-kaempferol de Cordia boissieri. Phytochemistry 1973;12:724–5.10.1016/S0031-9422(00)84473-8Search in Google Scholar
5. Domínguez XA, Escarria S, Butruille D. ρ-Hydroxybenzaldehyde dans le fruit de Cordia boisieri. Phytochemistry 1973;12:2996.10.1016/0031-9422(73)80523-0Search in Google Scholar
6. Owis AI. Composition of essential oil from flowers of Cordia boissieri A. DC and revision on the use of sesquiterpenes as taxonomic markers for genus Cordia. WJPPS 2014;3:133–41.Search in Google Scholar
7. Molina-Salinas G, Pérez-López A, Becerril-Montes P, Salazar-Aranda R, Said-Fernández S, de Torres NW. Evaluation of the flora of Northern Mexico for in vitro antimicrobial and antituberculosis activity. J Ethnopharmacol 2007;109:435–41.10.1016/j.jep.2006.08.014Search in Google Scholar PubMed
8. Meshkani R, Adeli K. Hepatic insulin resistance, metabolic syndrome and cardiovascular disease. Clin Biochem 2009;42:1331–46.10.1016/j.clinbiochem.2009.05.018Search in Google Scholar PubMed
9. Roberts CK, Barnard RJ, Sindhu RK, Jurczak M, Ehdaie A, Vaziri ND. Oxidative stress and dysregulation of NAD (P) H oxidase and antioxidant enzymes in diet-induced metabolic syndrome. Metabolism 2006;55:928–34.10.1016/j.metabol.2006.02.022Search in Google Scholar PubMed
10. Boustany CM, Bharadwaj K, Daugherty A, Brown DR, Randall DC, Cassis LA. Activation of the systemic and adipose renin-angiotensin system in rats with diet-induced obesity and hypertension. Am J Physiol Regul Integr Comp Physiol 2004;287:R943–9.10.1152/ajpregu.00265.2004Search in Google Scholar PubMed
11. Demirtas C, Pasaoglu O, Bircan F, Kantar S, Turkozkan N. The investigation of melatonin effect on liver antioxidant and oxidant levels in fructose-mediated metabolic syndrome model. Eur Rev Med Pharmacol Sci 2015;19:1915–21.Search in Google Scholar
12. Espinola-Klein C, Gori T, Blankenberg S, Munzel T. Inflammatory markers and cardiovascular risk in the metabolic syndrome. Front Biosci (Landmark Ed) 2011;16:1663–74.10.2741/3812Search in Google Scholar PubMed
13. Haffner SM. The metabolic syndrome: inflammation, diabetes mellitus, and cardiovascular disease. Am J Cardiol 2006;97:3–11.10.1016/j.amjcard.2005.11.010Search in Google Scholar PubMed
14. Johnson L, Strich H, Taylor A, Timmermann B, Malone D, Teufel-Shone N, et al. Use of herbal remedies by diabetic Hispanic women in the southwestern United States. Phytother Res 2006;20:250–5.10.1002/ptr.1820Search in Google Scholar
15. Owis AI, Abo-youssef AM, Osman AH. Protective effect of Cordia boissieri A. DC (Boraginaceae) on metabolic syndrome. J App Pharm Sci 2016;6:83–9.10.7324/JAPS.2016.60813Search in Google Scholar
16. Care IoLARCo, Animals UoL, and Resources NIoHDoR. Guide for the Care and Use of Laboratory Animal, US Department of Health and Human Services, Public Health Service, National Insititutes of Health, 1985.Search in Google Scholar
17. Bezerra R, Ueno M, Silva M, Tavares D, Carvalho C, Saad M, et al. A high-fructose diet induces insulin resistance but not blood pressure changes in normotensive rats. Braz J Med Biol Res 2001;34:1155–60.10.1590/S0100-879X2001000900008Search in Google Scholar
18. Beutler E, Duron O, Kelly BM. Improved method for the determination of blood glutathione. J Lab Clin Med 1963;61:882–8.Search in Google Scholar
19. Miranda KM, Espey MG, Wink DA. A rapid, simple spectrophotometric method for simultaneous detection of nitrate and nitrite. Nitric oxide 2001;5:62–71.10.1006/niox.2000.0319Search in Google Scholar
20. Uchiyama M, Mihara M. Determination of malonaldehyde precursor in tissues by thiobarbituric acid test. Anal Biochem 1978;86:271–8.10.1016/0003-2697(78)90342-1Search in Google Scholar
21. Jiang W-W, Kong L-B, Li G-Q, Wang X-H. Expression of iNOS in early injury in a rat model of small-for-size liver transplantation. Hepatobiliary Pancreat Dis Int 2009;8:146–51.Search in Google Scholar
22. Bancroft J, Stevens A, Turner D. Theory and practice of histological techniques. New York: Churchill Livingstone, 1996.Search in Google Scholar
23. Kleiner DE, Brunt EM, Van Natta M, Behling C, Contos MJ, Cummings OW, et al. Design and validation of a histological scoring system for nonalcoholic fatty liver disease. Hepatology 2005;41:1313–21.10.1002/hep.20701Search in Google Scholar PubMed
24. Mabry T, Markham KR, Thomas MB. The systematic identification of flavonoids. New York: Springer, 1970.10.1007/978-3-642-88458-0Search in Google Scholar
25. Al-Musayeib N, Perveen S, Fatima I, Nasir M, Hussain A. Antioxidant, anti-glycation and anti-inflammatory activities of phenolic constituents from Cordia sinensis. Molecules 2011;16:10214–26.10.3390/molecules161210214Search in Google Scholar PubMed PubMed Central
26. Olennikov DN, Tankhaeva LM, Partilkhaev VV, Rokhin AV. Chemical constituents of Caragana bungei shoots. Rev Bras Farmacogn 2012;22:490–6.10.1590/S0102-695X2012005000010Search in Google Scholar
27. Nascimento AR, Machado M, Jesus N, Gomes F, Lessa MA, Bonomo IT, et al. Structural and functional microvascular alterations in a rat model of metabolic syndrome induced by a high-fat diet. Obesity 2013;21:2046–54.10.1002/oby.20358Search in Google Scholar PubMed
28. Alzamendi A, Giovambattista A, García ME, Rebolledo OR, Gagliardino JJ, Spinedi E. Effect of pioglitazone on the fructose-induced abdominal adipose tissue dysfunction. PPAR Res 2012;2012:article ID 259093.10.1155/2012/259093Search in Google Scholar PubMed PubMed Central
29. Wang J, Rong X, Li W, Yang Y, Yamahara J, Li Y. Rhodiola crenulata root ameliorates derangements of glucose and lipid metabolism in a rat model of the metabolic syndrome and type 2 diabetes. J Ethnopharmacol 2012;142:782–8.10.1016/j.jep.2012.05.063Search in Google Scholar PubMed
30. Kim J-S, Kwon C-S, Son KH. Inhibition of alpha-glucosidase and amylase by luteolin, a flavonoid. Biosci Biotechnol Biochem 2000;64:2458–61.10.1271/bbb.64.2458Search in Google Scholar PubMed
31. Jakobs S, Fridrich D, Hofem S, Pahlke G, Eisenbrand G. Natural flavonoids are potent inhibitors of glycogen phosphorylase. Mol Nutr Food Res 2006;50:52–7.10.1002/mnfr.200500163Search in Google Scholar PubMed
32. Kwon O, Eck P, Chen S, Corpe CP, Lee J-H, Kruhlak M, et al. Inhibition of the intestinal glucose transporter GLUT2 by flavonoids. FASEB J 2007;21:366–77.10.1096/fj.06-6620comSearch in Google Scholar PubMed
33. Anhê GF, Okamoto MM, Kinote A, Sollon C, Lellis-Santos C, Anhe FF, et al. Quercetin decreases inflammatory response and increases insulin action in skeletal muscle of ob/ob mice and in L6 myotubes. Eur J Pharmacol 2012;689:285–93.10.1016/j.ejphar.2012.06.007Search in Google Scholar PubMed
34. Holmes BF, Kurth-Kraczek E, Winder W. Chronic activation of 5′-AMP-activated protein kinase increases GLUT-4, hexokinase, and glycogen in muscle. J Appl Physiol 1999;87:1990–5.10.1152/jappl.1999.87.5.1990Search in Google Scholar PubMed
35. Prince P, Kamalakkannan N. Rutin improves glucose homeostasis in streptozotocin diabetic tissues by altering glycolytic and gluconeogenic enzymes. J Biochem Mol Toxicol 2006;20:96–102.10.1002/jbt.20117Search in Google Scholar PubMed
36. Koo SI, Noh SK. Green tea as inhibitor of the intestinal absorption of lipids: potential mechanism for its lipid-lowering effect. J Nutr Biochem 2007;18:179–83.10.1016/j.jnutbio.2006.12.005Search in Google Scholar PubMed PubMed Central
37. Kawaguchi K, Mizuno T, Aida K, Uchino K. Hesperidin as an inhibitor of lipases from porcine pancreas and Pseudomonas. Biosci Biotechnol Biochem 1997;61:102–4.10.1271/bbb.61.102Search in Google Scholar PubMed
38. Horton JD, Goldstein JL, Brown MS. SREBPs: activators of the complete program of cholesterol and fatty acid synthesis in the liver. J Clin Invest 2002;109:1125–31.10.1172/JCI0215593Search in Google Scholar
39. Hu Q-H, Wang C, Li J-M, Zhang D-M, Kong L-D. Allopurinol, rutin, and quercetin attenuate hyperuricemia and renal dysfunction in rats induced by fructose intake: renal organic ion transporter involvement. Am J Physiol Renal Physiol 2009;297:F1080–91.10.1152/ajprenal.90767.2008Search in Google Scholar PubMed
40. Potapovich A, Kostyuk V. Comparative study of antioxidant properties and cytoprotective activity of flavonoids. Biochemistry (Moscow) 2003;68:514–9.10.1023/A:1023947424341Search in Google Scholar
41. Ishisaka A, Ichikawa S, Sakakibara H, Piskula MK, Nakamura T, Kato Y, et al. Accumulation of orally administered quercetin in brain tissue and its antioxidative effects in rats. Free Radic Biol Med 2011;51:1329–36.10.1016/j.freeradbiomed.2011.06.017Search in Google Scholar PubMed
42. Figueiredo-Rinhel AS, Santos EO, Kabeya LM, Azzolini AE, Simões-Ambrosio LM, Lucisano-Valim YM. The flavonols quercetin, myricetin, kaempferol, and galangin inhibit the net oxygen consumption by immune complex-stimulated human and rabbit neutrophils. Z Naturforsch 2014;69c:346–56.10.5560/znc.2012-0122Search in Google Scholar PubMed
43. Fraga CG, Oteiza PI. Dietary flavonoids: role of (−)-epicatechin and related procyanidins in cell signaling. Free Radic Biol Med 2011;51:813–23.10.1016/j.freeradbiomed.2011.06.002Search in Google Scholar PubMed
44. Rivera L, Morón R, Sánchez M, Zarzuelo A, Galisteo M. Quercetin ameliorates metabolic syndrome and improves the inflammatory status in obese Zucker rats. Obesity 2008;16:2081–7.10.1038/oby.2008.315Search in Google Scholar PubMed
45. Baldwin W, McRae S, Marek G, Wymer D, Pannu V, Baylis C, et al. Hyperuricemia as a mediator of the proinflammatory endocrine imbalance in the adipose tissue in a murine model of the metabolic syndrome. Diabetes 2011;60:1258–69.10.2337/db10-0916Search in Google Scholar PubMed PubMed Central
46. Torres-Piedra M, Ortiz-Andrade R, Villalobos-Molina R, Singh N, Medina-Franco JL, Webster SP, et al. A comparative study of flavonoid analogues on streptozotocin–nicotinamide induced diabetic rats: quercetin as a potential antidiabetic agent acting via 11β-Hydroxysteroid dehydrogenase type 1 inhibition. Eur J Med Chem 2010;45:2606–12.10.1016/j.ejmech.2010.02.049Search in Google Scholar PubMed
©2017 Walter de Gruyter GmbH, Berlin/Boston
Articles in the same Issue
- Frontmatter
- Research Article
- Environmental alterations in biofuel generating molecules in Zilla spinosa
- Short Communication
- Antinociceptive effect of Aristolochia trilobata stem essential oil and 6-methyl-5-hepten-2yl acetate, its main compound, in rodents
- Research Articles
- Bioenergetics of lactate vs. acetate outside TCA enhanced the hydrogen evolution levels in two newly isolated strains of the photosynthetic bacterium Rhodopseudomonas
- Leaves of Cordia boissieri A. DC. as a potential source of bioactive secondary metabolites for protection against metabolic syndrome-induced in rats
- Rapid Communication
- The evaluation of the synergistic effect of 3-(2,4-dihydroxyphenyl)propionic acid and l-ascorbic acid on tyrosinase inhibition
- Research Articles
- Virus inactivation under the photodynamic effect of phthalocyanine zinc(II) complexes
- Cytochalasin P1, a new cytochalasin from the marine-derived fungus Xylaria sp. SOF11
- Synthesis and biological evaluation of newer 1,3,4-oxadiazoles incorporated with benzothiazepine and benzodiazepine moieties
- Caspase-1 from the silkworm, Bombyx mori, is involved in Bombyx mori nucleopolyhedrovirus infection