Synthesis and crystal structures of new phases in the system Hf–Ta–O–N
-
Sophie Hund
 ,
Nikita Bubnov
,
Nikita Bubnov

Abstract
New phases in the system Hf–Ta–O–N have been synthesized and characterized by means of SEM/STEM-EDX, hot gas extraction analysis, and pXRD including Rietveld refinement. Bixbyite-type phases crystallizing in the cubic space group Ia
1 Introduction
Numerous metal nitrides are already known and used in a long series of applications. Many transition metal nitrides are very hard and non-corrosive materials adapted for coatings, e.g. TiN, VN, or HfN.
1
,
2
In this introductory paragraph, first the most important nitrides from of titanium, zirconium and hafnium are presented, followed by tantalum nitrides. HfN is not only very hard but has also a low electrical resistance and is an electrode material suitable for metal-oxide-semiconductor (MOS) devices.
3
,
4
Some nitrides with 3:4 ratio from the fourth group (Ti, Zr, Hf) are known. At ambient pressure only one polymorph has been synthesized – orthorhombic Zr3N4. It was first prepared by Juza et al.
5
about three decades later, Lerch et al.
6
again reported orthorhombic Zr3N4 as a nearly pure phase (below 1 % ZrN side phase) and described the crystal structure for the first time. The isostructural orthorhombic phases of Hf3N4 and Ti3N4 are still unknown. However, at high-pressure, cubic Hf3N4 and Zr3N4 have been synthesized by Zerr et al.
7
which crystallize in space group I
Tantalum nitrides appear in various compositions and crystal structures. Even a slight increase of the nitrogen content leads to another crystal structure: TaN
x
phases with 0.05 ≤ x ≤ 0.22 crystallize in space group Im
The most common tantalum nitrides are TaN and Ta3N5. These two phases have a wide range of interesting applications. For example, TaN is a stable catalyst for electrochemical hydrogen evolution, 21 polyvinylpyrrolidone-functionalized TaN nanoparticles are, due to their high photothermal stability, useful for photothermal therapy of cancer, 22 and Pd-loaded TaN–TaC composites are highly active electrocatalysts for non-poisoning ethylene glycol (EG) oxidation. 23 Ta3N5 is a nontoxic red pigment. 24 , 25 Tantalum oxide nitrides are also interesting materials. The most-studied one in terms of its optical and photocatalytic properties is β-TaON (P21/c). The green to yellow compound is highly active for photocatalytic water oxidation. 26 , 27 In combination with other elements, tantalum-based materials can be synthesized as pigments in various colors, e.g. CaTaO2N (yellow, Pnma) and SrTaO2N (orange, I4/mcm). 28 , 29 Next to their function as pigments, tantalum-based oxide nitrides also have been studied in detail with regard to their promising activities as photocatalysts for solar water splitting. 30 , 31
In the light of the results described above, it seems promising that phases containing both tantalum and hafnium have interesting physical properties. The system Hf–Ta–O–N has not been studied intensively yet, whereas the system Ta–Zr–O–N is already known very well.
32
,
33
,
34
The nitride (Hf, Ta)N was synthesized by Nowotny et al.
35
up to a TaN content of 75 %. No full solubility was observed because of the different crystal structures of HfN (Fm
2 Results and discussion
2.1 Bixbyite-type phases
Various compositions of bixbyite-type phases in the system Hf–Ta–O–N were synthesized by the preparation of a precursor via a sol-gel method and subsequent ammonolysis. The ratios of hafnium to tantalum were confirmed by energy dispersive X-ray spectroscopy (EDX). The values are given in atomic percentage normalized to the cations (Table 1). Details concerning the anion contents are given below.
Results of the EDX measurements for different ratios of hafnium to tantalum. The standard deviation is estimated to be 5 %.
| Hf:Ta | x(Hf) (at%) | x(Ta) (at%) |
|---|---|---|
| 1:2 | 34 | 66 |
| 1:1 | 50 | 50 |
| 2:1 | 66 | 34 |
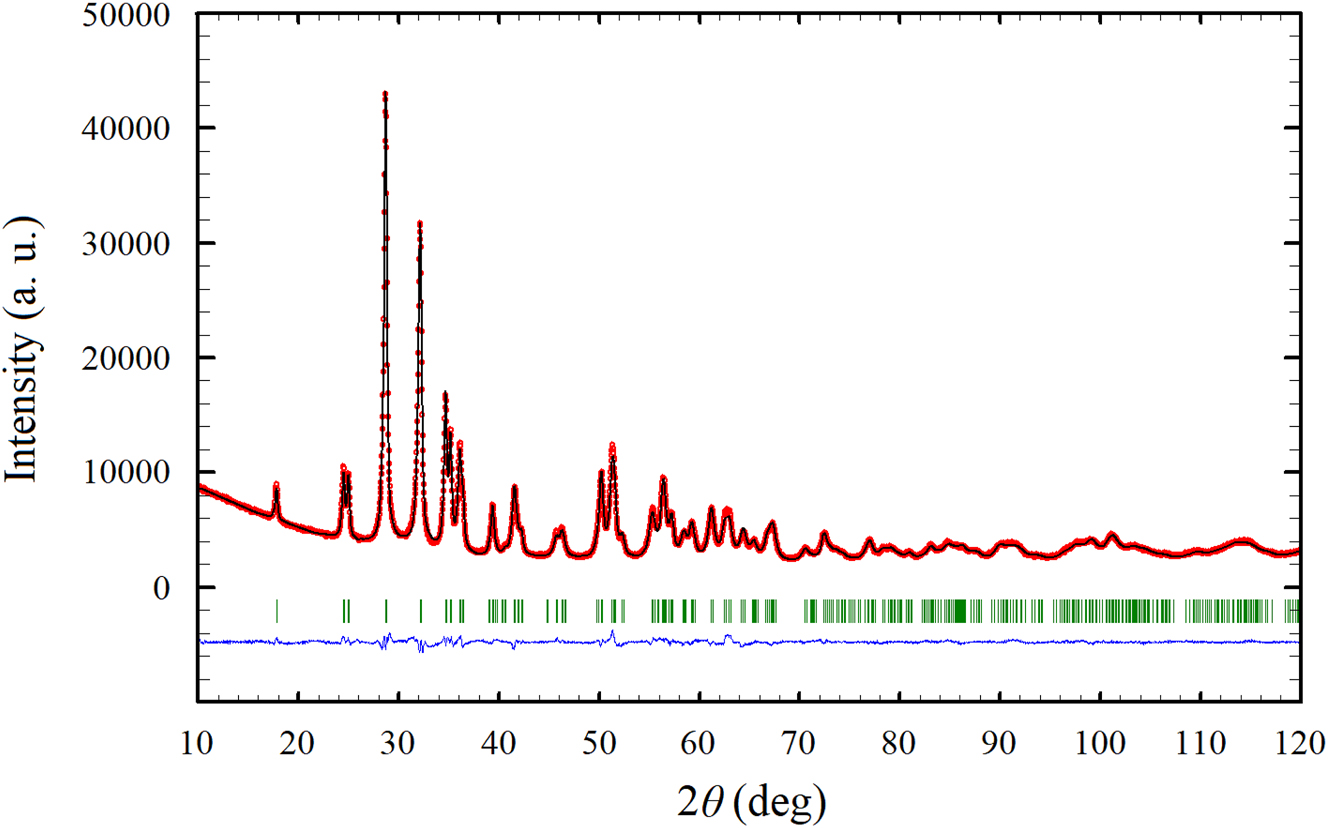
For crystal structure refinements, powder X-ray diffraction (pXRD) measurements were carried out. The pXRD pattern of HfTaN3 is shown in Figure 1, exemplarily for all bixbyite-type samples, together with the results of the Rietveld refinement. The atomic coordinates of Hf2ON2, reported by Clarke et al.
39
were used as starting values. The phase investigated in the present study crystallizes in space group Ia
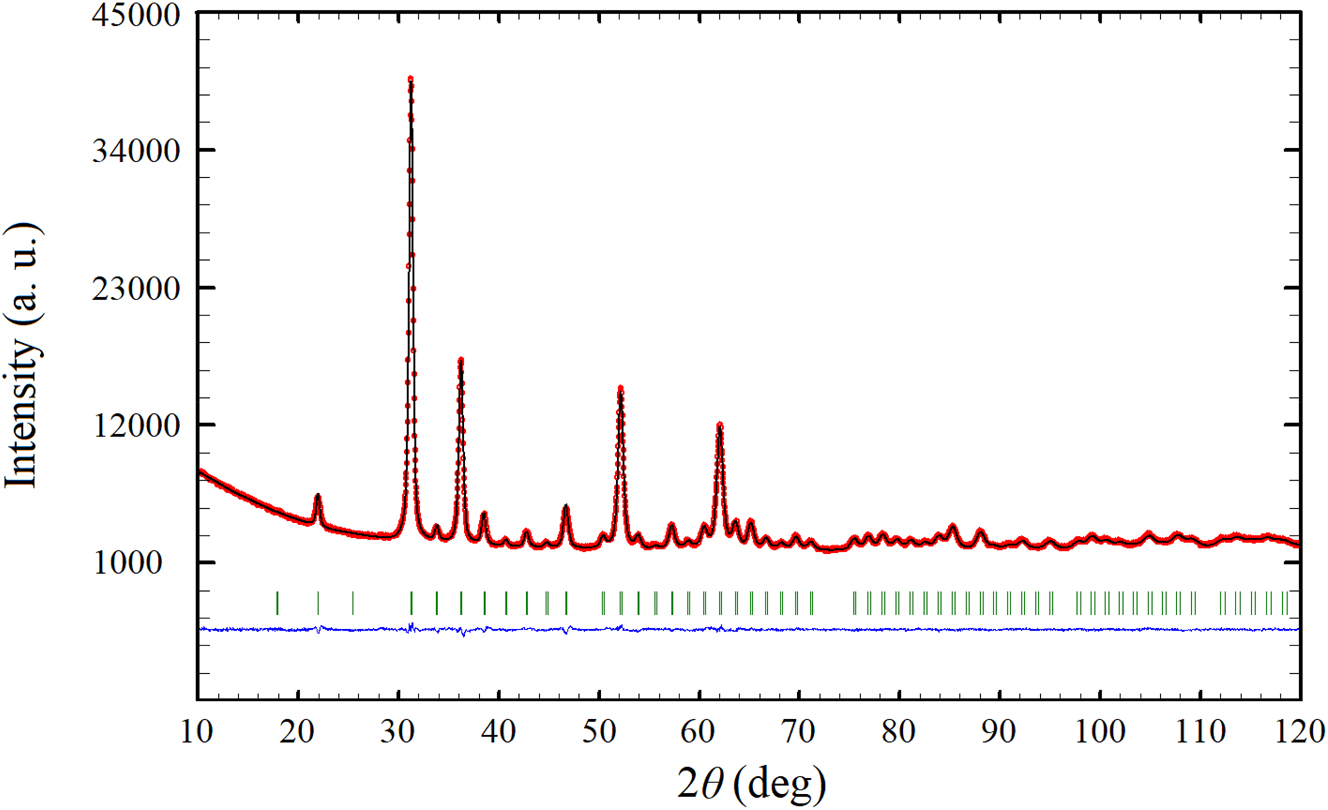
Powder X-ray diffraction pattern of HfTaN3 (red) with the results of the Rietveld refinement.
Refined atomic parameters (standard deviations in parentheses). Hf and Ta cannot be distinguished by standard X-ray powder methods.
| Atom | Wyckoff | x | y | z | B iso (Å2) |
|---|---|---|---|---|---|
| Hf1/Ta1 | 8a | 0 | 0 | 0 | 0.48(12) |
| Hf2/Ta2 | 24d | 0.28448(13) | 0 | 1/4 | 0.35(10) |
| N1/O1 | 48e | 0.361(2) | 0.134(2) | 0.099(2) | 1a |
-
aNot refined.
Results of the Rietveld refinements for selected compositions in comparison to Hf2ON2 (standard deviations in parentheses; N/A = not available).
| Hf0.67Ta1.33N3.11 | HfTaN3 | Hf1.33Ta0.67O0.33N2.67 | Hf2ON2 39 | |
|---|---|---|---|---|
| Hf:Ta | 1:2 | 1:1 | 2:1 | |
| Structure type | Bixbyite | |||
| Crystal system | cubic | |||
| Space group |
Ia
|
|||
| Diffractometer | PANalytical X’Pert Pro | Philips PW1050/81 | ||
| λ, Å | 1.54056, 1.54439 | |||
| Z | 16 | |||
| a, Å | 9.890(2) | 9.919(2) | 9.960(3) | 10.0692(2) |
| V, Å3 | 967.5(4) | 975.9(3) | 988.0(6) | 1,020.90(6) |
| ρ calc, g cm−3 | 11.05 | 10.93 | 10.79 | 10.44 |
| R p | 0.0157 | 0.0148 | 0.0157 | 0.0475 |
| R wp | 0.0205 | 0.0194 | 0.0209 | 0.0686 |
| R exp | 0.0181 | 0.0167 | 0.0163 | N/A |
| R Bragg | 0.0186 | 0.0120 | 0.0150 | N/A |
| S | 1.13 | 1.16 | 1.28 | 1.89 |
As expected, the lattice parameters increase with increasing hafnium content due to the higher effective ionic radius of Hf4+ (0.85 Å, coordination number 6) compared to Ta5+ (0.78 Å, coordination number 6). 40 In the following, only samples with equal contents of hafnium and tantalum will be discussed because this is the only cation ratio which allows the oxygen-free compound HfTaN3 with A 2 X 3 composition (oxygen contents are discussed below). In Figure 2, the unit cell of HfTaN3 is presented exemplarily for all prepared bixbyite-type phases.
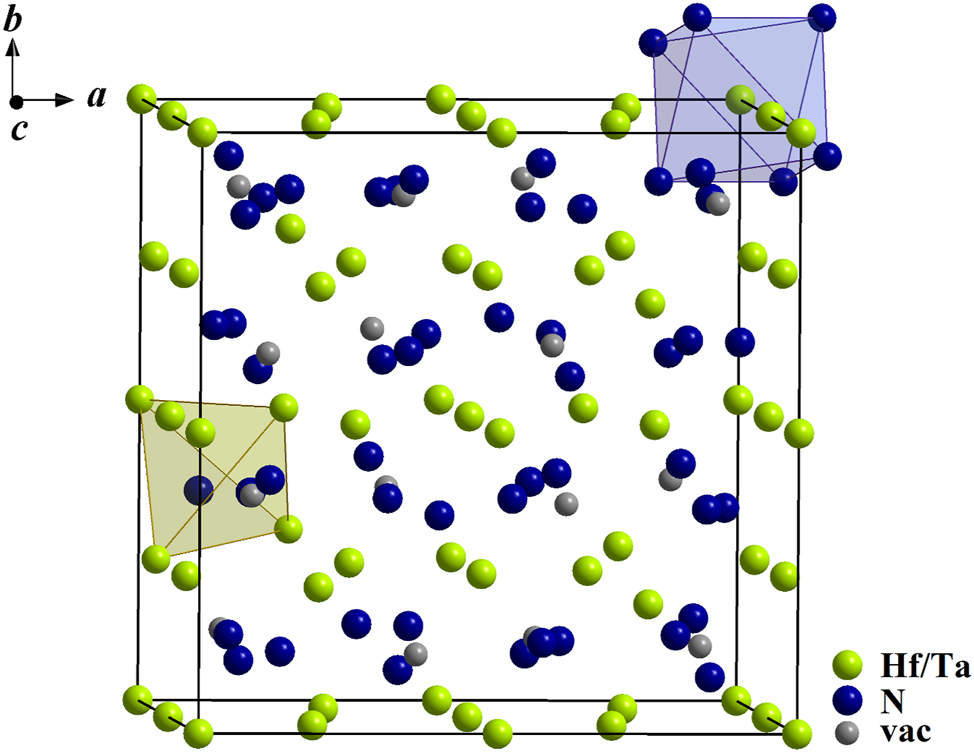
Unit cell of HfTaN3 including the vacancy positions (gray), one cation octahedron (blue) and one anion tetrahedron (green).
The bixbyite-type structure can be described as a superstructure of the fluorite type with doubled lattice parameters and thus an eight-fold volume of the unit cell. One quarter of the anions is missing. This vacant lattice position at the 16c site can be partly filled, which is characteristic for the bixbyite-type structure. The missing anions lead to distorted MX
6 octahedra, where MX
8 cubes are present in the ideal fluorite-type structure. The cations Hf4+ and Ta5+ are located at the 8a and 24d sites, the anions occupy the 48e site. All anions are surrounded tetrahedrally by cations. A simplified general formula can be given as A
2
X
3+δ
; for δ = 0 the composition is HfTaN3 (Ia
![Figure 3:
Dependency of the lattice parameter a (upper diagram) and the cation position x(24d) (lower diagram) on the measured nitrogen content of the new bixbyite-type phases (green), including the data from Ref. 33] (red).](/document/doi/10.1515/znb-2025-0025/asset/graphic/j_znb-2025-0025_fig_003.jpg)
Dependency of the lattice parameter a (upper diagram) and the cation position x(24d) (lower diagram) on the measured nitrogen content of the new bixbyite-type phases (green), including the data from Ref. 33] (red).
Measured nitrogen content, lattice parameter a and cation coordinate x of the 24d site for selected bixbyite-type phases with Hf:Ta = 1:1 compared to the data of selected samples with Zr:Ta = 1:1 published in ref. 33]. The given anion values are calculated from the measured nitrogen contents.
| Composition | Nitrogen content (anion%) | a (Å) | x(24d) |
|---|---|---|---|
| HfTaO0.00N3.00 | 100 | 9.9191(17) | 0.28448(13) |
| HfTaO0.10N2.93 | 97 | 9.920(3) | 0.28407(16) |
| HfTaO0.27N2.82 | 91 | 9.920(3) | 0.2836(2) |
| HfTaO0.46N2.70 | 85 | 9.920(3) | 0.28388(19) |
| HfTaO1.02N2.32 | 70 | 9.924(3) | 0.2831(2) |
| ZrTaO0.00N3.00 | 100 | 9.9517(4) | 0.28280(9) |
| ZrTaO0.02N2.99 | 99 | 9.9574(5) | 0.28422(10) |
| ZrTaO0.24N2.84 | 92 | 9.9596(5) | 0.28380(10) |
| ZrTaO0.98N2.35 | 71 | 10.0037(6) | 0.27050(16) |
| ZrTaO1.67N1.89 | 53 | 10.0793(5) | 0.26324(15) |
The lattice parameter a of all hafnium-containing phases is almost constant for any measured nitrogen content. A similar feature was also observed for Hf:Ta ratios of 2:1 and 1:2, respectively. Regarding the expected clear dependency of the lattice parameters from the nitrogen content, an almost constant lattice parameter leads to the conclusion that the nitrogen content of the crystalline phase is also very similar in all prepared samples, although the synthesis parameters varied very strongly (see Section 4). This may be explained by the assumption that the phase width of the hafnium-containing bixbyite phase is narrower than that of the zirconium-containing phase. So far, the reason for this is unknown. A possible explanation for the variation in the measured nitrogen contents might be the existence of oxygen-rich or oxidic surface layers that affects the measured values for nitrogen. To clarify this, HR-STEM (high resolution scanning transmission electron microscopy) and EDX measurements have been carried out. The presented BF (bright field) STEM image (Figure 4) visualizes lattice planes that extend almost to the edge of the particle. This points to the presence of only a small amorphous monolayer on the surface of the investigated particles. The EDX elemental mappings (Figure 5) indicate a higher oxygen concentration on the particle surface which supports the above suggestion. Due to various overlapping elemental peaks, some instrument related, some specimen related, the peaks for Hf-Lγ1 at 10.519 keV, Ta-L l at 7.173 keV, O-Kα at 0.525 keV and N-Kα at 0.392 keV were used for displaying the shown elemental maps. Table 4 illustrates that there is no significant difference in the lattice parameters for all samples with measured nitrogen contents between 100 % and 70 %. The effective ionic radii of Hf4+ and Zr4+ are almost identical with values of 0.85 Å and 0.86 Å 40 (coordination number 6), respectively. The lattice parameters of our phases are about 0.033 Å smaller than the lattice parameter of ZrTaN3. The comparison of the lattice parameters of Hf2ON2 (10.0692(2) Å) and Zr2ON2 (10.1415(1) Å), both crystallizing in the bixbyite-type structure, gives a difference of about 0.072 Å, what is almost twice as high. This is in a good agreement with the observed difference in the lattice parameters of ZrTaN3 and our bixbyite phases as half of the cations are Ta5+. Based on these observations, we assume that a phase with a composition close to HfTaN3 was synthesized under all synthesis conditions instead of oxide nitrides with different anion compositions, as it was the case for the zirconium phases.
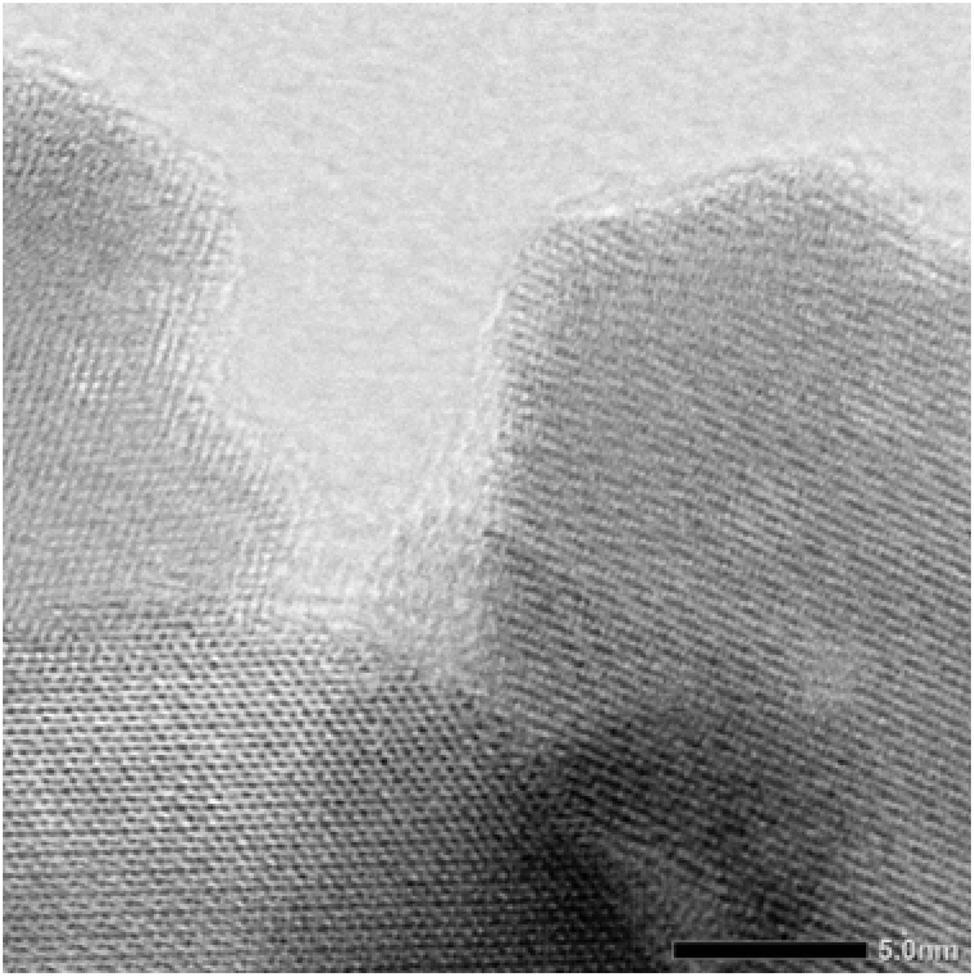
BF STEM image of a hafnium-containing bixbyite phase.
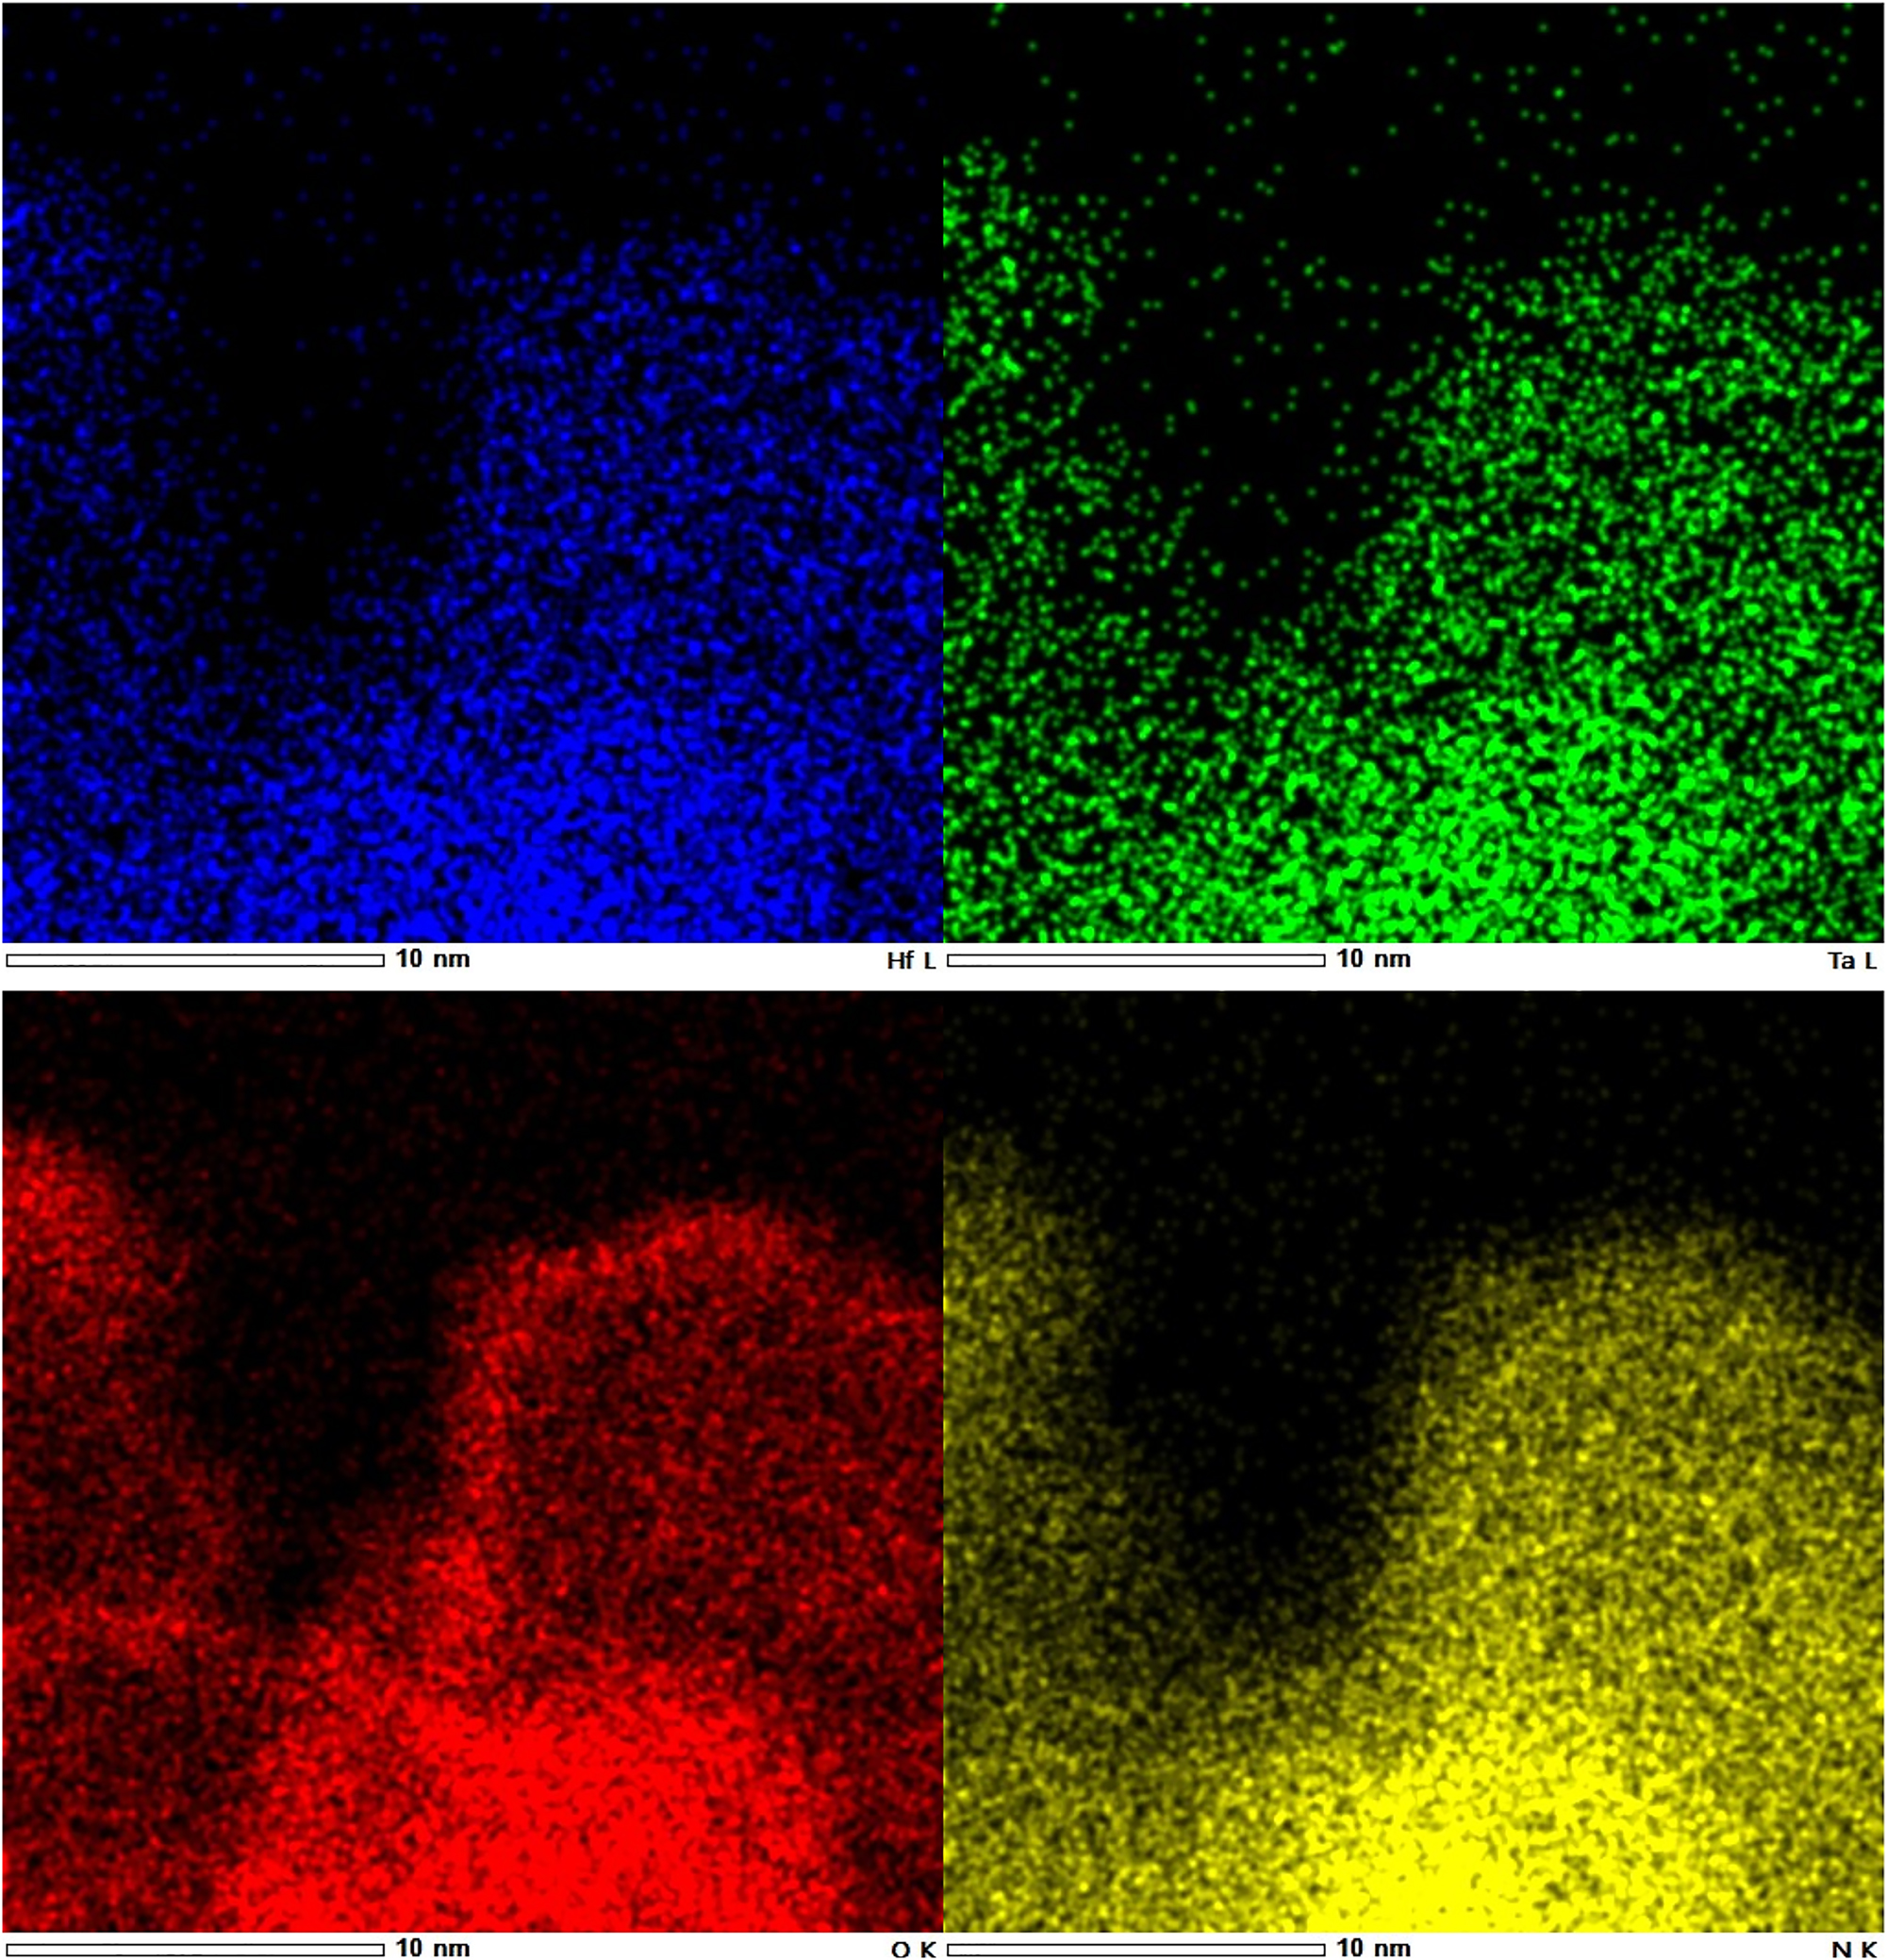
STEM-EDX mappings of a bixbyite-type phase (blue: hafnium, green: tantalum, red: oxygen, yellow: nitrogen).
The following section is about the baddeleyite-type phase HfTaO3N which was prepared by ammonolysis out of the same precursor as HfTaN3. There is a competition in the formation of the two compounds under mild synthesis conditions.
2.2 Baddeleyite-type phases
A baddeleyite phase containing the elements Hf, Ta, O, and N in a molar ratio of 1:1:3:1 has been synthesized, which in the following is designated as HfTaO3N. The anion composition was confirmed by hot gas extraction analysis (10.6 wt% oxygen, 3.6 wt% nitrogen) and the cation composition was measured with EDX (51 % Hf, 49 % Ta). The standard deviation is estimated to be 2 % for hot gas extraction analysis and 5 % for EDX. The chemical formula HfTaO3N is in a good agreement with the analytic results.
For the structural refinement of HfTaO3N (Figure 6), the coordinates of β-TaON, reported by Weishaupt and Strähle, 42 were used as starting values. The prepared oxide nitride adopts the baddeleyite-type structure (space group P21/c). The results are presented in Tables 5 and 6.
Powder X-ray diffraction pattern of HfTaO3N (red) with the results of the Rietveld refinement.
Refined atomic parameters for HfTaO3N (standard deviations in parentheses).
| Atom | Wyckoff | x | y | z | B iso (Å2) |
|---|---|---|---|---|---|
| Hf/Ta | 4e | 0.2840(6) | 0.0423(4) | 0.2121(5) | 0.5a |
| O/N1 | 4e | 0.0854(8) | 0.339(6) | 0.361(6) | 1a |
| O/N2 | 4e | 0.450(8) | 0.756(5) | 0.476(7) | 1a |
-
aNot refined.
Results of the Rietveld refinement of HfTaO3N (standard deviations in parentheses).
| HfTaO3N | |
|---|---|
| Structure type | baddeleyite |
| Crystal system | monoclinic |
| Space group | P21/c (no. 14) |
| Z | 2 |
| a, Å | 5.043(2) |
| b, Å | 5.101(5) |
| c, Å | 5.243(2) |
| β, deg | 99.465(9) |
| R p | 0.0212 |
| R wp | 0.0274 |
| R exp | 0.0150 |
| R Bragg | 0.0196 |
| S | 1.82 |
The prepared phase crystallizes in space group P21/c and can formally be described as a solid solution of HfO2 and β-TaON. The question to be clarified is whether the prepared sample is a fine distribution of β-TaON or HfO2 or a new quaternary phase HfTaO3N. Even if the XRD pattern indicates a pure phase, more tests are necessary in order to allow a conclusion regarding the resemblance of the lattice parameters of HfO2 43 and TaON 44 (HfO2: a = 5.1156(5) Å, b = 5.1722(5) Å, c = 5.2948(5) Å, β = 99.18(8)°; TaON: a = 4.968(1) Å, b = 5.037(1) Å, c = 5.185(1) Å, β = 99.56(1)°). For additional clarifying, STEM-EDX measurements were carried out. From the elemental maps in Figure 7, it can be concluded that hafnium and tantalum appear to be homogeneously distributed within the order of magnitude shown. There is no indication for the presence of two phases here. The following elemental peaks were used for displaying the shown elemental maps: Hf-Lα1 at 7.901 keV and Ta-Lα1 at 8.146 keV.
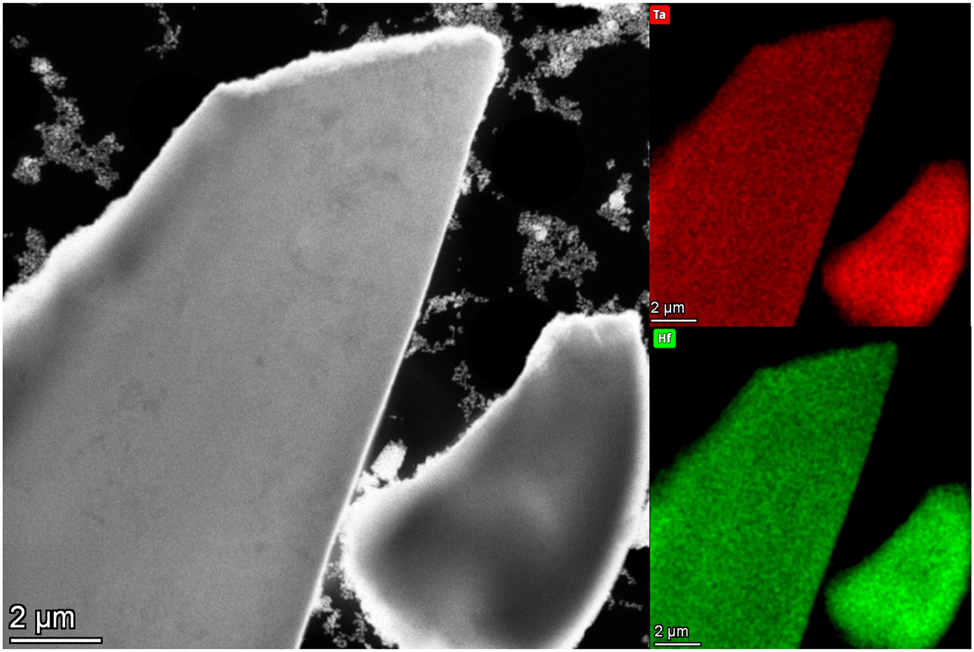
HAADF image and EDX maps of tantalum (red) and hafnium (green) for HfTaO3N.
Moreover, diffuse reflectance UV/Vis spectra were recorded using our material and a mixture of HfO2 and TaON (Hf:Ta = 1:1). As exemplarily depicted in Figure 8, the Tauc plot shown for an indirect optical transition of the biphasic mixture exhibits two absorption edges for TaON and HfO2. The Kubelka-Munk function of our powder differs from that of the reference material as there is only one clear absorption step. Extrapolation of the linear part of the plot revealed an optical band gap of 2.27 eV for an indirect transition, while for a direct transition a band gap of 2.66 eV was estimated. All these details point to the presence of the quaternary phase HfTaO3N.
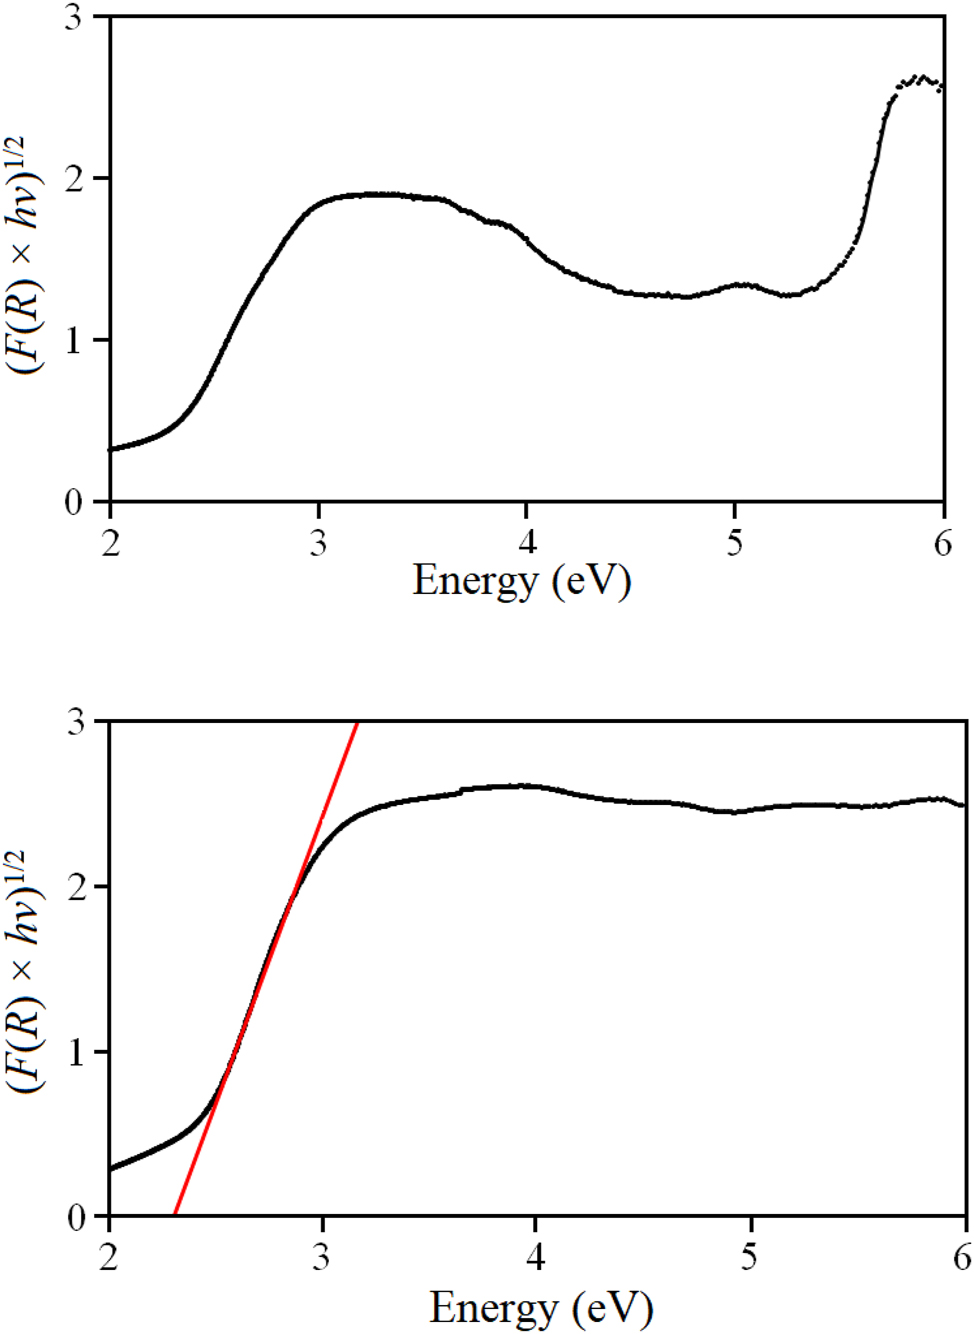
Tauc plot for indirect band gaps of a mixture of TaON and HfO2 (upper diagram) and for HfTaO3N (lower diagram).
It is noticeable that β-TaON 44 (E g,ind = 2.25 eV, E g,d = 2.67 eV) and HfTaO3N (E g,ind = 2.27 eV, E g,d = 2.66 eV) have almost identical band gaps. TaON is a well-known oxygen evolution photocatalyst, 27 and because of the apparent similarity in optical properties according to UV/Vis spectroscopy, the prepared sample of HfTaO3N was examined for its photocatalytic properties. The results are shown in Figure 9 for HfTaO3N and TaON for comparison.
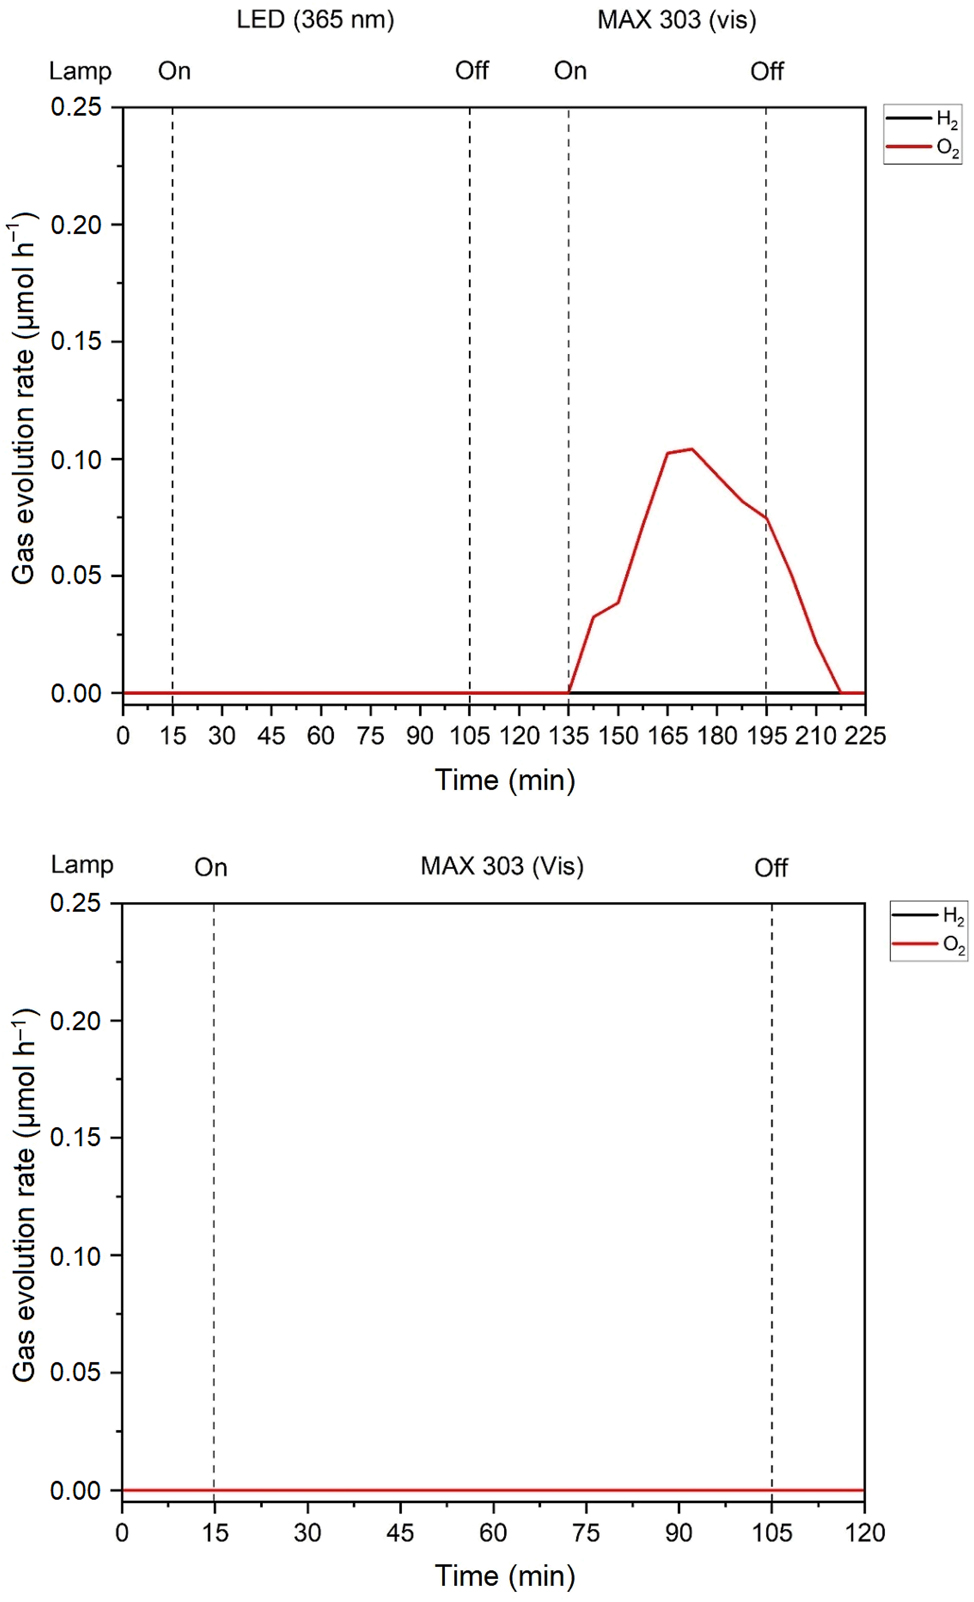
Photocatalytic OER measurements of TaON (upper diagram) and HfTaO3N (lower diagram).
For TaON, the reaction takes place under visible light. In contrast, no oxygen is produced with HfTaO3N under the same testing conditions. This is another hint that HfTaO3N is indeed the product of the preparative experiments.
Its crystal structure is illustrated in Figure 10. The cations Hf4+ and Ta5+ occupy a 4e site and the anions O2− and N3− (formally) are distributed over two crystallographically independent 4e positions, where nitrogen presumably prefers the 4e site on (0.450, 0.756, 0.476) analogous to the observation made for β-TaON 45 and following the 2nd rule of Pauling. It should be kept in mind that it is not possible to distinguish hafnium from tantalum or oxygen from nitrogen by standard powder XRD measurements (very similar scattering factors). Consequently, the real symmetry of HfTaO3N may be lower than that described above. TaON 42 has Ta–O/N interatomic distances between 2.02(2) and 2.13(2) Å while the values for HfO2 43 are calculated to 2.03–2.25 Å. The Hf/Ta–O/N bond lengths in HfTaO3N are in the range of 2.04(3)–2.26(4) Å and are similar to the larger values for HfO2 and to the Zr–O distances of 2.04–2.26 Å in ZrO2. 46
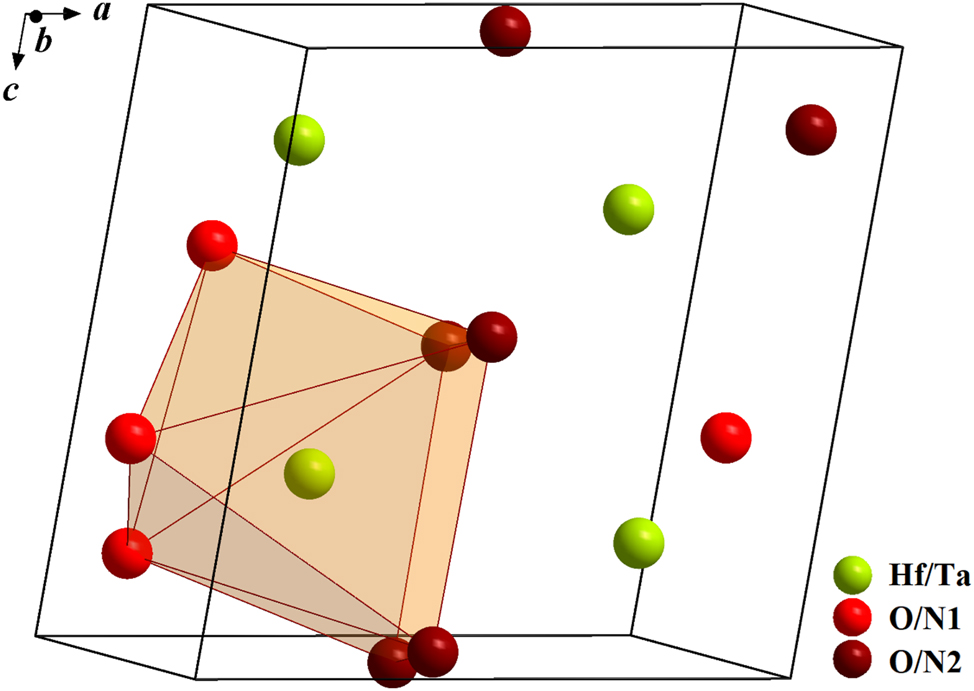
Unit cell of HfTaO3N (green: Hf/Ta, red: O/N1, dark-red: O/N2, orange: polyhedron).
3 Conclusions
New phases in the system Hf–Ta–O–N have been synthesized which crystallize in the bixbyite-type (cubic space group Ia
4 Experimental section
4.1 Syntheses
Precursors with defined cation ratios were prepared by the sol-gel based Pechini 47 route. A metal citrate solution of each cation was prepared in the first step. For the hafnium citrate solution, HfCl4 (99.9 %, Alfa Aesar) was filled in a two-necked flask under inert gas. A solution of a 12-fold molar access of citric acid (≥99.5 %, Sigma Aldrich) in absolute ethanol (99.5 %, Acros Organics) was given in a dropping funnel. Under counterflow of nitrogen the solution of citric acid in ethanol was dropped to the hafnium chloride slowly. After thorough stirring, the hafnium citrate solution was obtained. The same procedure was carried out with TaCl5 (99.995 %, abcr) to receive the tantalum citrate solution. Both metal citrate solutions were combined in the desired molar ratio and an at least 17-fold excess of ethylene glycol was added. This mixture was heated in steps of 50 K to approximately 300 °C and afterwards calcinated in a chamber furnace at 450 °C overnight. The product of this precursor preparation was an amorphous colorless oxide powder.
The final synthesis step is the nitridation by ammonolysis. The bixbyite-type phases were prepared at temperatures between 700 and 900 °C (10–15 h) with ammonia flows of 10–20 L h−1 and a heating rate of 400 K h−1. The baddeleyite phase HfTaO3N was synthesized at 950 °C with a holding time of 12 h, a heating rate of 400 K h−1, and gas flows of 10 L h−1 ammonia and 0.1 L h−1 oxygen. The products were crystalline brown to black (bixbyite phases) and yellow (baddeleyite phase) powders.
The mixture of HfO2 and β-TaON was prepared by milling HfO2 (Merck) and TaON thoroughly in the molar ratio of Hf:Ta = 1:1. For the TaON synthesis, the tantalum citrate solution was subjected to the sol-gel process to gain an oxidic tantalum precursor. The citrate was mixed with ethylene glycol and annealed stepwise until a gel was formed, which was calcinated at 450 °C overnight. The precursor was heated in a tube furnace to 900 °C for 12 h under flowing ammonia (10 L h−1) and oxygen (0.3 L h−1) to receive TaON.
4.2 Chemical and structural characterization
For N/O analyses by hot gas extraction, an ONH836 analyzer by Leco was used. The standard materials were steel (nitrogen) and ZrO2 (oxygen). 3–4 mg of the samples were weighed in an Sn capsule which was pressed and inserted in an Ni capsule. Quantitative EDX measurements were carried out using a Zeiss Gemini SEM500 NanoVP instrument with a Quantax XFlash 6|60 detector (Bruker) and Esprit software for evaluation. For powder X-ray diffraction, a PANalytical X’Pert Pro (Bragg-Brentano geometry) and a nickel filter were used. We measured with a step width of 0.026° in the angular range of 10–120° in 2θ. For Rietveld 48 refinements the program FullProf Suite 2021 49 was used.
Further details of the crystal structure investigations may be obtained from the joint CCDC/FIZ Karlsruhe online deposition service (https://www.ccdc.cam.ac.uk/structures/?) by quoting the deposition numbers CSD-2443720 (HfTaO3N), CSD-2443721 (HfTaN3), CSD-2444010 (Hf0.67Ta1.33N3.11) and CSD-2444011 (Hf1.33Ta0.67O0.33N2.67).
High-resolution scanning transmission electron microscopy (HR-STEM) measurements were conducted using a JEM-ARM300F2 electron microscope (JEOL Ltd., Tokyo, Japan) operating at 300 kV accelerating voltage. The instrument is equipped with a cold field emission electron (cold FEG) source, a JEOL ETA Probe Cs corrector, and conventional STEM-detectors as well as a combined SE/BSE (SEI) detector for imaging the specimen morphology. For high-angle annular dark-field (HAADF) imaging, camera lengths of 10 cm were used, corresponding to detection angles of 54–220 mrad. EDX mappings were recorded using a windowless dual SDD detector system with dimensions of 2 × 158 mm2 and a resulting solid angle of 2.2 sr and the AnalysisStation Software provided with the instrument. To improve the image quality, a Gaussian filter of size 9 was applied to the mappings. For specimen preparation, a tiny amount of material was dispersed in Ethanol, 3 µL of the dispersion was drop-casted onto a 300 mesh lacey-carbon Cu grid and dried at around 40 °C on air. For the baddeleyite phase, STEM studies were carried out using a Thermo Scientific Talos F200X instrument, operating at 200 kV acceleration voltage and a condenser aperture (C2) of 70 µm. The sample was dry-deposited on a lacey-carbon-coated Au grid and analyzed using a double-tilt sample holder. EDX was performed using the SuperX EDX system consisting of four silicon drift detectors (SDD) that cover 0.9 sr. The elemental mappings were recorded using a pre-filtering Gaussian blur with sigma 1.0.
4.3 UV/vis spectroscopy and catalytic testing
A Jasco V760 spectrometer was used for diffusive reflectance UV/Vis spectroscopy measurements in an integrating sphere in the ranges of 200–1,000 nm for HfTaO3N and 200–2,000 nm for the mixture of HfO2 and TaON with a speed of 20 nm min−1.
The photocatalytic experiments were carried out in a double-walled quartz glass reactor operated in a semi-batch mode. Either an LED panel (365 nm, 10.61 mW cm2) or a xenon light source (Asahi MAX-303, 300 W, equipped with a mirror module (385–740 nm), 129.00 mW cm2) was used for top illumination. The N2 flow (99.999 %, Air Liquide) into the reactor was controlled by a mass flow controller (Bronkhorst). To ensure efficient gas distribution, a frit was mounted at the end of the gas inlet. The output gas stream was analysed for hydrogen and oxygen using an online GC-BID (GC-2023, Shimadzu, Hayeseq Q and molecular sieve 13 X column) allowing for a sampling period of 7.5 min.
To investigate the OER, the catalyst was dispersed in a solution of FeSO4 (5 mM, 98 %, Fisher Scientific) in 70 mL water (HPLC grade). The pH value was adjusted to 2.4 using conc. H2SO4. After sonification for 60 min, the reactor was flushed with N2 to remove residual O2 and H2.
Acknowledgments
We acknowledge financial support by the Deutsche Forschungsgemeinschaft (DFG, German Research Foundation) under Projects 403371556 – GZ: INST 131/789-1 FUGG. T. L. acknowledges the Federal Ministry of Education and Research in the framework of the project Catlab (03EW0015A). We also thank the Center for Electron Microscopy (ZELMI) of the TU Berlin for providing access and support. Special thanks go to Christoph Fahrenson of ZELMI for quantitative EDX analyses and to Dr. Stefan Berendts for hot gas extraction analyses.
-
Research ethics: Not applicable.
-
Informed consent: Not applicable.
-
Author contributions: The authors have accepted responsibility for the entire content of this manuscript and approved its submission.
-
Use of Large Language Models, AI and Machine Learning Tools: None declared.
-
Conflict of interest: The authors state no conflict of interest.
-
Research funding: DFG (German Research Foundation), projects 403371556 – GZ: INST 131/789-1 FUGG and BMBF (Federal Ministry of Education and Research), project: Catlab 03EW0015A.
-
Data availability: Not applicable.
References
1. Milošev, I.; Strehblow, H.-H.; Navinšek, B. Thin Solid Films 1997, 303, 246–254. https://doi.org/10.1016/s0040-6090(97)00069-2.Search in Google Scholar
2. Glechner, T.; Hudak, O. E.; Wojcik, T.; Haager, L.; Bohrn, F.; Hutter, H.; Hunold, O.; Ramm, J.; Kolozsvári, S.; Pitthan, E.; Primetzhofer, D.; Riedl, H. Mater. Des. 2021, 211, 110136. https://doi.org/10.1016/j.matdes.2021.110136.Search in Google Scholar
3. Johansson, B. O.; Sundgren, J.-E.; Helmersson, U. J. Appl. Phys. 1985, 58, 3112–3117. https://doi.org/10.1063/1.335813.Search in Google Scholar
4. Yu, H. Y.; Lim, H. F.; Chen, J. H.; Li, M. F.; Zhu, C.; Tung, C. H.; Du, A. Y.; Wang, W. D.; Chi, D. Z.; Kwong, D.-L. IEEE Electron Device Lett. 2003, 24, 230–232. https://doi.org/10.1109/led.2003.812143.Search in Google Scholar
5. Juza, R.; Rabenau, A.; Nitschke, I. Z. Anorg. Allg. Chem. 1964, 332, 1–4. https://doi.org/10.1002/zaac.19643320102.Search in Google Scholar
6. Lerch, M.; Füglein, E.; Wrba, J. Z. Anorg. Allg. Chem. 1996, 622, 367–372.10.1002/zaac.19966220227Search in Google Scholar
7. Zerr, A.; Miehe, G.; Riedel, R. Nat. Mater. 2003, 2, 185–189. https://doi.org/10.1038/nmat836.Search in Google Scholar PubMed
8. Kroll, P. Phys. Rev. Lett. 2003, 90, 125501. https://doi.org/10.1103/PhysRevLett.90.125501.Search in Google Scholar PubMed
9. Gebhardt, E.; Seghezzi, H.-D.; Dürrschnabel, W. Z. Metallkd. 1958, 48, 577–583.10.1515/ijmr-1958-491106Search in Google Scholar
10. Geils, R. H.; Potter, D. I. Metall. Trans. 1973, 4, 1469–1474. https://doi.org/10.1007/bf02667996.Search in Google Scholar
11. Brauer, G.; Zapp, K. H. Z. Anorg. Allg. Chem. 1954, 277, 129–139. https://doi.org/10.1002/zaac.19542770304.Search in Google Scholar
12. Liu, L.; Huang, K.; Hou, J.; Zhu, H. Mater. Res. Bull. 2012, 47, 1630–1635, https://doi.org/10.1016/j.materresbull.2012.03.050.Search in Google Scholar
13. Brauer, G. P.; Mohr, E.; Neuhaus, A.; Skogan, A. Monatsh. Chem. 1972, 103, 794–798. https://doi.org/10.1007/bf00905439.Search in Google Scholar
14. Christensen, A. N.; Lebech, B. Acta Crystallogr. 1978, B34, 261–263.10.1107/S0567740878002733Search in Google Scholar
15. Petrunin, V. F.; Sorokina, N. I. Izv. Akad. Nauk SSSR, Neorg. Mater. 1982, 18, 1733–1736.Search in Google Scholar
16. Fontbonne, A.; Gilles, J. C. Rev. Int. Hautes Temp. Refract. 1969, 6, 181–192.Search in Google Scholar
17. Terao, N. Jpn. J. Appl. Phys. 1971, 10, 248–259. https://doi.org/10.1143/jjap.10.248.Search in Google Scholar
18. Strähle, J. Z. Anorg. Allg. Chem. 1973, 402, 47–57.10.1002/zaac.19734020107Search in Google Scholar
19. Salamat, A.; Woodhead, K.; Shah, S. I. U.; Hector, A. L.; McMillan, P. F. Chem. Commun. 2014, 50, 10041–10044. https://doi.org/10.1039/c4cc05147e.Search in Google Scholar PubMed
20. Bykov, M.; Bykova, E.; Ponomareva, A. V.; Abrikosov, I. A.; Chariton, S.; Prakapenka, V. B.; Mahmood, M. F.; Dubrovinsky, L.; Goncharov, A. F. Angew. Chem. Int. Ed. 2021, 60, 9003–9008. https://doi.org/10.1002/anie.202100283.Search in Google Scholar PubMed
21. Alhajri, N. S.; Yoshida, H.; Anjum, D. H.; Garcia-Esparza, A. T.; Kubota, J.; Domen, K.; Takanabe, K. J. Mater. Chem. A 2013, 1, 12606–12616. https://doi.org/10.1039/c3ta12984e.Search in Google Scholar
22. Yi, H.; Yan, G.; He, J.; Zhuang, J.; Jin, C.; Zhang, D.-Y. Nanomaterials 2023, 13, 1708. https://doi.org/10.3390/nano13111708.Search in Google Scholar PubMed PubMed Central
23. Li, Q.; Qin, G.; Wu, L.; Zhao, Y.; Wang, X. Appl. Surf. Sci. 2021, 537, 147849. https://doi.org/10.1016/j.apsusc.2020.147849.Search in Google Scholar
24. Henderson, S. J.; Hector, A. L. J. Solid State Chem. 2006, 179, 3518–3524. https://doi.org/10.1016/j.jssc.2006.07.021.Search in Google Scholar
25. Jansen, M.; Guenther, E.; Letschert, H. P. Verfahren zur Herstellung von gelben und roten Pigmenten auf der Basis von Nitriden und Oxidnitriden. German Patent 199 07 618.9, 1999.Search in Google Scholar
26. Orhan, E.; Tessier, F.; Marchand, R. Solid State Sci. 2002, 4, 1071–1076. https://doi.org/10.1016/s1293-2558(02)01369-9.Search in Google Scholar
27. Hitoki, G.; Takata, T.; Kondo, J. N.; Hara, M.; Kobayashi, H.; Domen, K. Chem. Commun. 2002, 16, 1698–1699. https://doi.org/10.1039/b202393h.Search in Google Scholar PubMed
28. Günther, E.; Hagenmayer, R.; Jansen, M. Z. Anorg. Allg. Chem. 2000, 626, 1519–1525. https://doi.org/10.1002/1521-3749(200007)626:7<1519::aid-zaac1519>3.0.co;2-i.10.1002/1521-3749(200007)626:7<1519::AID-ZAAC1519>3.0.CO;2-ISearch in Google Scholar
29. Aguiar, R.; Logvinovich, D.; Weidenkaff, A.; Rachel, A.; Reller, A.; Ebbinghaus, S. G. Dyes Pigm. 2008, 76, 70–75. https://doi.org/10.1016/j.dyepig.2006.08.029.Search in Google Scholar
30. Zhang, P.; Zhang, J.; Gong, J. Chem. Soc. Rev. 2014, 43, 4395–4422. https://doi.org/10.1039/c3cs60438a.Search in Google Scholar
31. Ahmed, M.; Xinxin, G. Inorg. Chem. Front. 2016, 3, 578–590. https://doi.org/10.1039/c5qi00202h.Search in Google Scholar
32. Schönberg, N.; Heimbürger, G.; Matikkala, E. J.; Sörensen, N. A. Acta Chem. Scand. 1954, 8, 627–629. https://doi.org/10.3891/acta.chem.scand.08-0627.Search in Google Scholar
33. Lüdtke, T.; Orthmann, S.; Lerch, M. Z. Naturforsch. 2017, 72b, 305–311.10.1515/znb-2017-0014Search in Google Scholar
34. Guenther, E.; Jansen, M. Mater. Res. Bull. 2001, 36, 1399–1405. https://doi.org/10.1016/s0025-5408(01)00632-8.Search in Google Scholar
35. Nowotny, H.; Benesovsky, F.; Rudy, E. Monatsh. Chem. 1960, 91, 348–356. https://doi.org/10.1007/bf00901755.Search in Google Scholar
36. Gatterer, J.; Dufek, G.; Ettmayer, P.; Kieffer, R. Monatsh. Chem. 1975, 106, 1137–1147. https://doi.org/10.1007/bf00906226.Search in Google Scholar
37. Grosso, B. F.; Davies, D. W.; Zhu, B.; Walsh, A.; Scanlon, D. O. Chem. Sci. 2023, 24, 9175–9185.10.1039/D3SC02171HSearch in Google Scholar PubMed PubMed Central
38. Liu, Q.-J.; Liu, Z.-T.; Feng, L.-P.; Tian, H. Comput. Mater. Sci. 2010, 50, 114–117. https://doi.org/10.1016/j.commatsci.2010.07.014.Search in Google Scholar
39. Clarke, S. J.; Michie, C. W.; Rosseinsky, M. J. J. Solid State Chem. 1999, 146, 399–405. https://doi.org/10.1006/jssc.1999.8372.Search in Google Scholar
40. Shannon, R. D.; Prewitt, C. T. Acta Crystallogr. 1969, B25, 925–946.10.1107/S0567740869003220Search in Google Scholar
41. Ramos-Gallardo, A.; Vegas, A. J. Solid State Chem. 1995, 119, 131–133. https://doi.org/10.1016/0022-4596(95)80019-l.Search in Google Scholar
42. Weishaupt, M.; Strähle, J. Z. Anorg. Allg. Chem. 1977, 429, 261–269.10.1002/zaac.19774290132Search in Google Scholar
43. Ruh, R.; Corfield, P. W. R. J. Am. Ceram. Soc. 1970, 53, 126–129. https://doi.org/10.1111/j.1151-2916.1970.tb12052.x.Search in Google Scholar
44. Cosgun, S. Synthese und Charakterisierung Tantaloxidnitrid-basierter Verbindungen für die photokatalytische Wasserspaltung. Dissertation, Technische Universität Berlin, Berlin, 2015.Search in Google Scholar
45. Armytage, D.; Fender, B. E. F. Acta Crystallogr. 1974, B30, 809–812.10.1107/S0567740874003761Search in Google Scholar
46. McCullough, J. D.; Trueblood, K. N. Acta Crystallogr. 1959, 12, 507–511. https://doi.org/10.1107/s0365110x59001530.Search in Google Scholar
47. Pechini, M. P. Method of Preparing Lead and Alkaline Earth Titanates and Niobates and Coating Method Using the Same to Form a Capacitor. US3,330,697, 1967.Search in Google Scholar
48. Rietveld, H. M. J. Appl. Crystallogr. 1969, 2, 65–71. https://doi.org/10.1107/s0021889869006558.Search in Google Scholar
49. Rodríguez-Carvajal, R. FULLPROF, A Program for Rietveld Refinement and Pattern Matching Analysis. In Satellite Meeting on Powder Diffraction of the 15th International Congress of theIUCr, Toulouse (France), 1990; p. 127.Search in Google Scholar
© 2025 Walter de Gruyter GmbH, Berlin/Boston
Articles in the same Issue
- Frontmatter
- In this issue
- Research Articles
- A MEMS-based gas sensor for H2S detection with enhanced performance using a Ni–In2O3/ZnO nano-composite
- Ultra-sensitive and rapid response H2S microsensor based on Co–ZnO with ppm level detection
- Crystal chemistry and structural phase transition in CaLa2Zn1–x Ca x Ti2O9 (x = 0.00, 0.15, 0.30, 0.45, 0.90 and 1.00)
- RE 10Co3In10 (RE = Y, Gd, Tb, Dy, Ho, Er, Tm) – a new intergrowth structure with CsCl- and AlB2-type slabs
- Crystal structures of phases from the solid solutions DyNiIn1−xSn x
- Tricyanomethanides of the scandium group obtained from aqueous solution: syntheses, crystal structures and Raman spectra of Sc[C(CN)3]3(H2O)3, Y[C(CN)3]3(H2O)2 and La[C(CN)3]3(H2O)4
- Three pnictides with Sm6Rh30Si19-type structure: Sm6Rh30P19, Lu6Rh30P19 and Eu6Rh30Sb19
- The compound (NH4)0.64B4.36O6.72(OH)0.28(NH3)0.36 representing the first ammine/ammonium borate
- Extended investigations on the pressure stability of AlB4O6N:Cr3+
- Synthesis and crystal structures of new phases in the system Hf–Ta–O–N