Electron density of a benzoylated tetrafructopyranose
-
Peter Luger
 and
Birger Dittrich
and
Birger Dittrich

Abstract
The electron density distribution (EDD) of a tetrasaccharide composed of four benzoylated fructopyranosyl units was obtained by refinement with scattering factors from the invariom library. X-ray diffraction data was downloaded from the Cambridge Structural Database (CSD). Bond topological and atomic properties were obtained by application of Bader’s QTAIM formalism. From a large number of 105 C–C bonds in the molecule average bond orders for 33 single and 72 aromatic bonds were calculated yielding values of 1.33 and 1.61. Molecular Hirshfeld and electrostatic potential (ESP) surfaces show that only weak non-covalent interactions exist. The phenyl rings of the benzoyl fragments in the outer regions of the molecule generate a positive ESP shell with repulsive properties between adjacent molecules. Weak surface interactions result in a rather unusual low density around 1.3 g cm−3, which is understandable when compared to other carbohydrates where strong O–H⋯O hydrogen bonds allow a 20% more dense packing with densities >1.5 g cm−3 as determined by single crystal X-ray diffraction.
1 Introduction
Carbohydrates played an interesting role in the history of crystal structure analysis. They documented the problems and progress in crystal structure research in the last century. The first entry of a carbohydrate in the Cambridge Structural Database (CSD) [1, 2] was pentaerythritol in 1937 [3], 25 years after the discovery of X-ray diffraction. Until 1950 only 20 further carbohydrate structures were added. Of special interest is the structure of sucrose, since it is, next to sodium chloride, one of two compounds consumed daily in gram amounts by humans in the crystalline state. In contrast to sodium chloride, which was the first crystal structure ever solved (already in 1913 [4]), it took further 40–60 years until structures based on X-ray and neutron diffraction of free sucrose were published [5], [6], [7], [8].
Promoted by the activities of the school around George Jeffrey from the Department of Crystallography, University of Pittsburgh, a large number of carbohydrate structures appeared then, starting in the early 1950s. Until the 1990s, about 2000 such crystal structures were published, documented by Jeffrey and coworkers by a series of annual summaries, resulting in a lead article in Acta Crystallographica in 1990 [9]. Today more than 7400 carbohydrate structures are listed as belonging to the carbohydrate class in the CSD.
In 2007 we reported an electron density (ED) analysis of sucrose based on a full aspherical multipole refinement of a high-resolution data set of ca. 86,000 reflections (sinθ/λ = 1.15 Å−1) measured at 20 K [10]. Later we added a room temperature low-order data set of sucrose (ca. 2600 reflections, sinθ/λ = 0.59 Å−1) and performed an invariom refinement [11], where fixed multipoles were taken from a library of non-spherical scattering factors [12, 13]. It turned out that the invariom based topological descriptors, and bond topological and atomic properties, were indeed comparable to the results of the multipole refinement using high-order data, and within the limits of transferability indices introduced by Grabowsky et al. [14].
These findings encouraged us to carry out an invariom based ED study of a larger carbohydrate, the title tetrasaccharide, consisting of 236 atoms. Syntheses of β-D-fructopyranosyl oligomers were reported by a group around Feng Lin and Yingxia Li [15] to provide a route to inulin type oligo fructosyl units. Inulin is a linear oligosaccharide mixture consisting of 30 or more fructose units. In the course of the synthetic work, the title tetrasaccharide was crystallized and a conventional X-ray structure determination was recently published by these authors [15]. They measured an exceptionally high quality X-ray diffraction data set at a temperature of 173 K up to a resolution of (sinθ/λ)max = 0.60 Å−1. This data was extracted from the Cambridge Structural Database, CSD, refcode DAYMUO [1, 2], and used for this study. The invariom formalism [12, 13] allowed reconstructing the ED of the molecule, which was further analyzed. This approach permits a more accurate refinement, followed by further analysis of the ED to be performed, also for conventional low-resolution X-ray data sets. Since the aspherical description of the atoms is deduced from a library of fixed multipole contributions and applied in least-squares refinement, results can be obtained that would otherwise require a data set of high resolution.
With one exception, all OH groups at the fructopyranosyl rings are replaced by benzoyl groups reducing hydrogen bonding options. Hence, the potential presence of weak non-covalent interactions in the crystal structure is an interesting aspect of this work.
2 Results and discussion
2.1 Structural properties
The molecular structure in the crystal is shown in Figure 1 in MERCURY representations [16]. In contrast to inulin, all fructose units are in the pyranose form. The atomic numbering scheme from Ref. [15] was maintained. As expected, the pyranosyl rings are in chair conformations 1C4, more precisely 2C5 in the notation for a keto sugar, as indicated by the θ-values of the Cremer & Pople puckering parameters [17, 18], which are close to 180°. This holds also for free β-D-fructopyranose [19]. The 2 → 1 glycosidic linkages all exhibit a -gauche-trans conformation, see also Figure 1 (bottom).
![Figure 1:
MERCURY representations [16] of the title compound. Hydrogen atoms are omitted for clarity. The contributing tetrabenzoylpyranose sugars are numbered (I)–(IV). The benzoyl phenyl rings and their centers (shown in yellow) are numbered P11, P12, … P43 in the representation (top). To make the pyranosyl rings and the glycosidic linkages more clearly visible, the benzoyl substituents are omitted in the representation (bottom).](/document/doi/10.1515/znb-2021-0178/asset/graphic/j_znb-2021-0178_fig_001.jpg)
MERCURY representations [16] of the title compound. Hydrogen atoms are omitted for clarity. The contributing tetrabenzoylpyranose sugars are numbered (I)–(IV). The benzoyl phenyl rings and their centers (shown in yellow) are numbered P11, P12, … P43 in the representation (top). To make the pyranosyl rings and the glycosidic linkages more clearly visible, the benzoyl substituents are omitted in the representation (bottom).
The 12 phenyl rings that are part of the benzoyl groups are all planar. Most of them form insignificant interplanar angles. Exceptions are the ring pairs P12/P23 and P32/P43, which are coplanar with interplanar angles of 6.5(4) and 8.9(1)°, respectively. Their interplanar distances are 5.32 and 5.28 Å. A closer approach is seen between rings P21 and P33 (to 4.24 Å) with an interplanar angle of 35.9(3)°.
Due to the absence of all but one OH group, only one O–H⋯O hydrogen bond exists, namely O(2)–H(1)⋯O(34), the primed oxygen atom being related by a translation in x-direction. In addition, Platon [18] lists seven intermolecular C–H⋯O contacts with C⋯O distances of 3.04–3.55 Å.
2.2 Electron density results, bonding and atomic properties
An illustration of the non-spherical ED distribution in the form of deformation densities is shown in selected intramolecular planes in Figure 2, confirming the proper assignment of the library multipoles. Deformation densities in the O–H⋯O and a C–H⋯O hydrogen bond region are shown in Figure 3. The O–H and C–H bond vectors are directed towards the accepting oxygen-atom lone-pair region.

Deformation densities in selected intramolecular planes: Above left: C(19)–O(26)–C(23), above right: C(19)–O(25)–C(18); below: phenyl ring through C(103)–C(107)–C(104).

Deformation densities in the planes of the intermolecular hydrogen bonds O(2)–H(1)⋯O(34) and C(107)–H(88)⋯O(24).
For a quantitative analysis of the electron density, Bader’s QTAIM formalism [20] was applied to yield bond critical points (BCPs) and atomic properties. Averages of bond critical point properties (BCP’s, defined by the property that the gradient ∇ρ(r) vanishes at this point) on the covalent bonds are given in Table 1. For a summary of all BCP properties on the covalent bonds (and ring critical point properties) see Supplementary material, Table S1. There is a large number of 105 C–C bonds in the molecule which permits a reliable statistic. One can distinguish two carbon–carbon bond types: 33 single and 72 aromatic bonds. From the electron density ρ(rBCP) at their bond critical points, the topological bond order nB was calculated [21]. We obtain averages nB = 1.23(6) for the single, and 1.71(6) for the aromatic bonds. In an earlier study on a rotaxane, where averages over 22 single and 46 aromatic bonds were calculated, bond orders of 1.03 and 1.61 were derived [22]. In the present case, electron delocalization for the C–C single bonds can be discussed. For the 54 C–O bonds, three types can be distinguished as specified in Table 1. They show the expected behavior and do not need further discussion. Ring critical points rcp were identified for the 4 pyranosyl and the 12 phenyl rings, see also Table 1.
Selection of averaged bond topological properties, For details see Table S1 in the Supplementary material.
| Bond | Length (Å) | ρ(rBCP) (e Å−3) | ∇2ρ(rBCP) (e Å−5) | ε a | N b | C–C bond order nbc |
|---|---|---|---|---|---|---|
| O–Csp3 | 1.421(13) | 1.85(7) | −13.3(28) | 0.04(1) | 28 | |
| O–Csp2 | 1.343(10) | 2.20(3) | −22.5(14) | 0.13(1) | 13 | |
| O=C | 1.204(6) | 3.03(3) | −33.6(6) | 0.09(–) | 13 | |
| C–C(arom) | 1.38(1) | 2.17(4) | −18.1(9) | 0.20(2) | 72 | 1.71(6) |
| C–C(single) | 1.51(2) | 1.85(5) | −14.4(7) | 0.10(5) | 33 | 1.23(6) |
| rcpd (phenyl) | 0.20(2) | 3.3(1) | 12 | |||
| rcpd (pyranosyl) | 0.18(1) | 2.8(1) | 4 |
-
aThe ellipticity ε is defined by (λ1/λ2) – 1 with λ1 and λ2 being the two principal negative curvatures of ρ(r) at a BCP. It is a measure for the asphericity and hence the double bond character of a bond.
bN = number of entries contributing to the average.
cThe bond order nb was calculated as nb = exp[C1(ρ(rBCP) − C2)], with C1 = 1.0229 and C2 = 1.6459 [21].
dring critical points.
Topological properties of the intermolecular hydrogen bonds (HBs) are summarized in Table 2. The HB energy of O–H⋯O units is around 10 kcal mol−1 [23], indicating a weak HB. The ρ(rBCP) values on the BCPs of the C–H⋯O HBs are all very low, so that in total the intermolecular interactions in terms of HBs are marginal. As a result, the packing in the crystal is less dense than in carbohydrates, with their larger number of hydroxyl groups giving rise to more or less strong hydrogen bonds. We refer to the low density of the crystals of the title compound of 1.32 g cm−3 as determined by XRD. For comparison, β-D-fructopyranose, β-D-glucopyranose and sucrose have a much higher density of around 1.55–1.60 g cm−3. Non-substituted oligosaccharides, as for example the tetrasaccharides coded PEKHES or STACHY10, or the pentasaccharide trehalose (DEKYEE) [1, 2], have a substantial higher density, 1.50 g cm−3 or higher. In all those cases, the molecules are linked by a variety of hydrogen bonds.
| D–H⋯A | D⋯A (Å) | H⋯A (Å) | D–H⋯A (deg) | ρ(rBCP) (e Å−3) | ∇2ρ(rBCP) (e Å−5) |
|---|---|---|---|---|---|
| O(2)–H(1)⋯O(34)a | 2.940(3) | 2.161(3) | 173.9(2) | 0.08 | 1.58 |
| C(4)–H(4)⋯O(16)b | 3.328(3) | 2.512(3) | 137.4(3) | 0.05 | 0.76 |
| C(10)–H(11)⋯O(8)c | 3.043(4) | 2.397(4) | 124.3(3) | 0.08 | 1.10 |
| C(56)–H(51)⋯O(1)d | 3.132(4) | 2.595(4) | 115.9(4) | 0.05 | 0.83 |
| C(59)–H(54)⋯O(6)c | 3.459(4) | 2.579(4) | 166.7(4) | 0.04 | 0.61 |
| C(63)–H(56)⋯O(6)e | 3.550(5) | 2.573(5) | 166.7(3) | 0.04 | 0.58 |
| C(92)–H(77)⋯O(24)d | 3.298(6) | 2.420(6) | 139.1(4) | 0.07 | 0.92 |
| C(107)–H(88)⋯O(24)f | 3.276(5) | 2.308(5) | 169.0(4) | 0.07 | 1.08 |
-
aSymmetry code: 1 + x, y, z;
bSymmetry code: 2 − x, 1/2 + y, −z;
cSymmetry code: 2 − x, −1/2 + y, −z;
dSymmetry code: −1 + x, y, z;
eSymmetry code −1 + x, −1 + y, z;
fSymmetry code x, 1 + y, z.
Atomic properties [25] were calculated by integration over the atomic basins bound by zero flux surfaces of the gradient vector field ∇ρ(r), which subdivide a structure into transferable substructures. The algorithm introduced by Volkov et al. [26], as implemented in the Xdprop subprogram of XD [24], was used. To illustrate the atomic properties in different neighborhoods, a fragment consisting of a pyranosyl ring with one benzoyl substituent is plotted in Figure 4 together with the atomic properties in this region, which is representative for all other groups. The oxygen atoms carry a strong negative charge close to −1 e, which is in part compensated by the charge of the directly bonded carbon atoms. Carbon atoms C(1) and C(25) bonded to two oxygen atoms are more positively charged than the other carbon atoms in the pyranosyl ring.
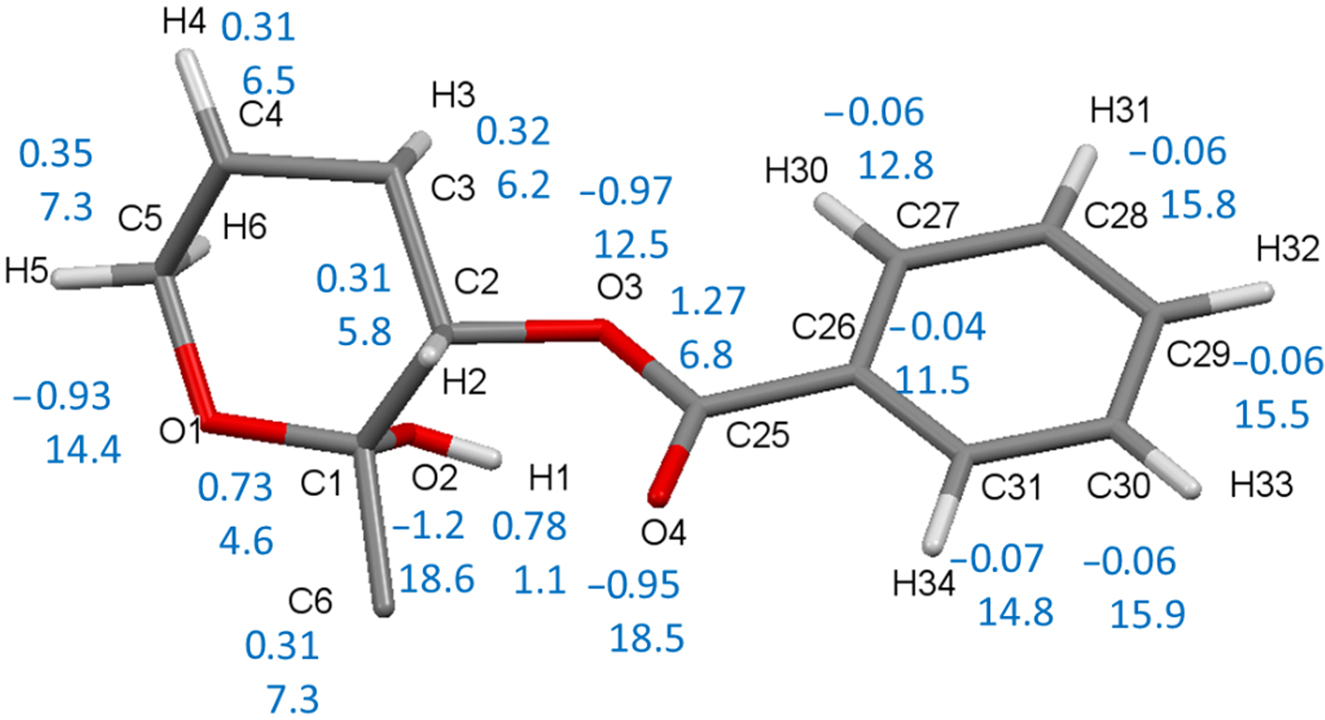
The pyranosyl ring (IV) with one benzoyl substituent (P41) is displayed together with atomic charges and volumes of carbon and oxygen atoms (in blue). Not shown: average charges/volumes at the pyranosyl hydrogen atoms H(2)⋯H(6) are 0.08(2) e/7.5(12) Å3, at the phenyl hydrogen atoms H(30)⋯H(34) 0.15(1) e/8.0(14) Å3.
All carbon atoms of the phenyl rings have atomic charges close to zero. Atomic volumes of the formal sp3 hybridized atoms at the pyranosyl ring are smaller than those of the sp2 carbon atoms of the phenyl rings. Obviously, the number of neighboring atoms has a small but noticeable influence on the atomic volume within each of these two groups. The hydrogen atom of the only OH group, which is the donor of an O–H⋯O hydrogen bond, has an extremely small volume close to 1 Å3, and a rather high atomic charge. The phenyl hydrogen atoms have twice the charges of the pyranosyl ring hydrogen atoms, and contribute to the positive electrostatic potential belt of the molecule, see next section.
The volume of the entire molecule, as obtained from the summation over the atomic volumes, is 2436.81 Å3. It reproduces half the unit cell volume (Vcell/2 = 2452.0 Å3) within less than 1%, which is a good check whether the integration procedure has worked properly.
2.3 Electron density, Hirshfeld and electrostatic potential surfaces
Hirshfeld surfaces [28, 29] can provide information about intermolecular interactions based on local ED concentrations. Mapping the aspherical ED by a color code onto this surface, ED concentrations indicate sites and strengths of these interactions. The electrostatic potential (ESP) makes sites of molecular polarization visible, where positive and negative ESP regions can be identified. The joint information that ESP and Hirshfeld surfaces provide helps to understand interactions and reactivity of a structure of interest. The generation of both types of surfaces was carried out using the graphical software Moliso [27].
In Figure 5 the Hirshfeld surface of the title molecule is represented. Due to the large size of the molecule, this surface is difficult to display and to interpret. We note that there are only small and weak signals (see also the color bar on the left in Figure 5). The viewing direction was chosen to highlight ED concentration at the donor and the acceptor site of the only O–H⋯O hydrogen bond. Some additional signals occasionally appearing on this surface representation stand for a few C–H⋯O interactions. For comparison, we have generated the Hirshfeld surface for sucrose (Figure 6). On this surface, broad and strong signals (compare the color bar with the one for the title molecule shown in Figure 5) are easy to interpret. The ED concentrations indicated by white circles are caused by some of the strongest hydrogen bond interactions in sucrose.
![Figure 5:
Electron density mapped onto the Hirshfeld surface of the benzoylated tetrasaccharide. Small ED concentrations are seen at the donor and acceptor sites of the O–H⋯O hydrogen bond, and occasionally at one of the C–H⋯O HB’s (drawn with the program Moliso [27]).](/document/doi/10.1515/znb-2021-0178/asset/graphic/j_znb-2021-0178_fig_005.jpg)
Electron density mapped onto the Hirshfeld surface of the benzoylated tetrasaccharide. Small ED concentrations are seen at the donor and acceptor sites of the O–H⋯O hydrogen bond, and occasionally at one of the C–H⋯O HB’s (drawn with the program Moliso [27]).
![Figure 6:
Electron density mapped onto Hirshfeld surfaces of sucrose; above: transparent representation with the molecular skeleton visible, below: non-transparent representation; four of the strongest hydrogen bonds are indicated by local electron density concentrations (representations generated with Moliso [27]).](/document/doi/10.1515/znb-2021-0178/asset/graphic/j_znb-2021-0178_fig_006.jpg)
Electron density mapped onto Hirshfeld surfaces of sucrose; above: transparent representation with the molecular skeleton visible, below: non-transparent representation; four of the strongest hydrogen bonds are indicated by local electron density concentrations (representations generated with Moliso [27]).
The ESP surface shown in Figure 7 was calculated by using the method of Volkov et al. [30] with the Xdprop subprogram of Xd2006 [24], and color coded onto the 0.067 e Å−3 (=0.01 a.u.) ED [27] isosurface. The terminal phenyl rings of the benzoyl groups cause a positive ESP on the outer shell of the ED isosurface, so that a rather strongly positive ESP belt exists. The oxygen atoms of the benzoyl groups cause an almost neutral ESP. A weakly negative ESP in the interior at the pyranosyl oxygen atoms is visible through a pale red coloring. In total, we see a polarization from the positive ESP belt in the outer regions of the molecule towards neutral and negative regions in the interior. The almost completely positive outer surface is expected to lead to repulsive forces with adjacent molecules in the crystal. This result explains the less dense packing mentioned before, as also suggested by the weak signals on the Hirshfeld surface.
![Figure 7:
Electrostatic potential of the title compound. For guidance, the sites of the pyranosyl residues are labeled in roman letters, see also Figure 1 (representation with Moliso [27]).](/document/doi/10.1515/znb-2021-0178/asset/graphic/j_znb-2021-0178_fig_007.jpg)
3 Conclusions
The invariom formalism relies on Bader’s transferability concept in that the electron density and derived properties of a functional group or an atom should be transferable between similar chemical neighborhoods [31]. In the title compound, a large number of atoms are in a comparable neighborhood. Therefore, only 24 different invarioms had to be assigned to the 256 atoms for least-squares refinement. From this model, which is easy to establish, the derived electron density was analyzed.
In addition to bond topological and atomic properties, molecular surfaces were evaluated. The Hirshfeld surface does not show any strong ED concentrations, meaning that only weak noncovalent contacts do exist. This is in line with an unusually low density of around 1.3 g cm−3, which is small when compared to that of other carbohydrates, where strong O–H⋯O hydrogen bonds allow a 20% more dense packing as determined by single crystal X-ray diffraction.
The electron density, as derived from the aspherical invariom model, provides additional quantitative information on bond topological and atomic properties and on molecular surfaces with acceptable effort. The main challenge of the analysis is not the application of the invariom model, but to measure a properly resolved X-ray data set, which is not easy to obtain for larger oligosaccharides.
4 Invariom refinement
The invariom refinement of the title compound followed the same procedure as reported earlier [22]. Making use of the data set reported in Ref. [15], aspherical-atom modeling was carried out with the software INVARIOMTOOL [32]. Scattering factors from the invariom library up to the hexadecapolar level, including κ parameters, were assigned to all atoms. Hydrogen-atom positions were idealized, and riding model constraints were generated with INVARIOMTOOL. After invariom transfer, a least-squares refinement of positional and displacement parameters (anisotropic for non-hydrogen atoms, isotropic for hydrogen atoms) was carried out with Xdlsm of the Xd2006 program suite [24] until convergence was achieved. Selected crystallographic data and figures of merit are summarized in Table 3.
Selected crystallographic and invariom refinement data for the title compound.a
| Compound | Tetrafructopyranose |
|---|---|
| Formula | C110H92O34 |
| M r (g mol−1) | 1957.95 |
| Crystal system | Monoclinic |
| Space group (No.) | P21 (#4) |
| Z | 2 |
| V (Å3) | 4904.0(1) |
| X-ray density (g cm−3) | 1.33 |
| T (K) | 173(2) |
| (sin θ/λ)max (Å−1) | 0.588 |
| No. of reflections | 15,295 |
| Observed reflections (Fo2 ≥ 2 σ[Fo2]) | 13,748 |
| Invariom refinement: | |
| R(F) | 0.0369 |
| Rall(F) | 0.0425 |
| Rw(F) | 0.0343 |
| R(F 2 ) | 0.0517 |
| Rall(F 2 ) | 0.0527 |
| Rw(F 2 ) | 0.0680 |
| Min/max Δρ (e Å−3) | −0.12/0.13 |
| Gof | 1.59 |
| N ref /N v | 9.90 |
-
aFor further data see CSD entry DAYMUO or Ref. [15].
In the refinements the quantity
Atomic and multipole parameters are presented in the Supplementary material, Table S3.
Dedicated to: Professor Dr. Hans Paulsen, Hamburg, on the occasion of his 100th birthday.
-
Author contributions: All the authors have accepted responsibility for the entire content of this submitted manuscript and approved submission.
-
Research funding: None declared.
-
Conflict of interest statement: The authors declare no conflicts of interest regarding this article.
References
1. Allen, H. Acta Crystallogr. 2002, B58, 380–388; https://doi.org/10.1107/s0108768102003890.Search in Google Scholar PubMed
2. Groom, C. R., Bruno, I. J., Lightfood, M. P., Ward, S. C. Acta Crystallogr. 2016, B72, 171–179; https://doi.org/10.1107/s2052520616003954.Search in Google Scholar PubMed PubMed Central
3. Llewellyn, F. J., Cox, E. G., Gooodwin, T. H. J. Chem. Soc. 1937, 0, 883–894; https://doi.org/10.1039/jr9370000883.Search in Google Scholar
4. Bragg, W. L. Proc. R. Soc. London, Ser. A 1913, 89, 248–277.10.1098/rspa.1913.0083Search in Google Scholar
5. Beevers, C. A., McDonald, T. R. R., Robertson, J. H., Stern, F. Acta Crystallogr. 1952, 5, 689–690; https://doi.org/10.1107/s0365110x52001908.Search in Google Scholar
6. Brown, G. M., Levy, H. A. Science 1963, 141, 921–923; https://doi.org/10.1126/science.141.3584.921.Search in Google Scholar PubMed
7. Brown, G. M., Levy, H. A. Acta Crystallogr. 1973, B29, 790–797; https://doi.org/10.1107/s0567740873003353.Search in Google Scholar
8. Hanson, J. C., Sieker, L. C., Jensen, L. H. Acta Crystallogr. 1973, B29, 797–808; https://doi.org/10.1107/s0567740873003365.Search in Google Scholar
9. Jeffrey, G. A. Acta Crystallogr. 1990, B46, 89–103; https://doi.org/10.1107/s0108768189012449.Search in Google Scholar PubMed
10. Jaradat, D. M. M., Mebs, S., Checinska, L., Luger, P. Carbohydr. Res. 2007, 342, 1480–1489; https://doi.org/10.1016/j.carres.2007.04.004.Search in Google Scholar PubMed
11. Dittrich, B., Weber, M., Kalinowski, R., Grabowsky, S., Hübschle, C. B., Luger, P. Acta Crystallogr. 2009, B65, 749–756; https://doi.org/10.1107/s0108768109046060.Search in Google Scholar PubMed
12. Dittrich, B., Koritsanszky, T., Luger, P. Angew. Chem. Int. Ed. 2004, 43, 2718–2721; https://doi.org/10.1002/anie.200353596.Search in Google Scholar PubMed
13. Dittrich, B., Hübschle, C. B., Pröpper, K., Dietrich, F., Stolper, T., Holstein, J. J. Acta Crystallogr. 2013, B69, 91–104; https://doi.org/10.1107/s2052519213002285.Search in Google Scholar PubMed
14. Grabowsky, S., Kalinowski, R., Weber, M., Förster, D., Paulmann, C., Luger, P. Acta Crystallogr. 2009, B65, 488–501; https://doi.org/10.1107/s0108768109016966.Search in Google Scholar
15. Zhang, L., Wang, H., Xu, Q., Lu, R., Cao, Y., Wang, Z., Tang, P., Lin, F., Li, Y. Carbohydr. Res. 2017, 448, 6–9; https://doi.org/10.1016/j.carres.2017.05.012.Search in Google Scholar PubMed
16. Macrae, C. F., Bruno, I. J., Chisholm, J. A., Edgington, P. R., McCabe, P., Pidcock, E., Rodriguez-Monge, L., Taylor, R., van de Streek, J., Wood, P. A. J. Appl. Crystallogr. 2008, 41, 466–470; https://doi.org/10.1107/s0021889807067908.Search in Google Scholar
17. Cremer, D., Pople, J. A. J. Am. Chem. Soc. 1975, 97, 1354–1358; https://doi.org/10.1021/ja00839a011.Search in Google Scholar
18. Spek, A. L. Acta Crystallogr. 2009, D65, 148–155; https://doi.org/10.1107/s090744490804362x.Search in Google Scholar
19. Kanters, J. A., Roelofsen, G., Alblas, B. P., Meinders, I. Acta Crystallogr. 1977, B33, 665–672; https://doi.org/10.1107/s0567740877004439.Search in Google Scholar
20. Bader, R. F. W. Atoms in Molecules- A Quantum Theory; Clarendon Press: Oxford, 1994.Search in Google Scholar
21. Luger, P., Messerschmidt, M., Scheins, S., Wagner, A. Acta Crystallogr. 2004, A60, 390–396; https://doi.org/10.1107/s0108767304014825.Search in Google Scholar PubMed
22. Luger, P., Dittrich, B. Z. Naturforsch. 2021, 76b, 91–95.Search in Google Scholar
23. Espinosa, E., Molins, E., Lecomte, C. Chem. Phys. Lett. 1998, 285, 170–173; https://doi.org/10.1016/s0009-2614(98)00036-0.Search in Google Scholar
24. Volkov, A., Macchi, P., Farrugia, L. J., Gatti, C., Mallinson, P. R., Richter, T., Koritsánszky, T. XD2006 – A Computer Program for Multipole Refinement, Topological Analysis of Charge Densities and Evaluation of Intermolecular Energies from Experimental and Theoretical Structure Factors; University of Buffalo: NY (USA), University of Milano, (Italy); University of Glasgow, (UK); CNRISTM, Milano (Italy); Middle Tennessee State University, TN (USA), 2006.Search in Google Scholar
25. Bader, R. F. W. Theo. Chem. Acc. 2001, 105, 276–284.10.1007/s002140000233Search in Google Scholar
26. Volkov, A., Gatti, C., Abramov, Y., Coppens, P. Acta Crystallogr. 2000, A56, 252–258; https://doi.org/10.1107/s0108767300001628.Search in Google Scholar
27. Hübschle, C. B., Luger, P. J. Appl. Crystallogr. 2006, 39, 901–904.10.1107/S0021889806041859Search in Google Scholar
28. McKinnon, J. J., Mitchell, A. S., Spackman, M. A. Chem. Eur J. 1998, 4, 2136–2141; https://doi.org/10.1002/(sici)1521-3765(19981102)4:11<2136::aid-chem2136>3.0.co;2-g.10.1002/(SICI)1521-3765(19981102)4:11<2136::AID-CHEM2136>3.0.CO;2-GSearch in Google Scholar
29. Spackman, M. A., McKinnon, J. J., Jayatilaka, D. CrystEngComm 2008, 10, 377–388.Search in Google Scholar
30. Volkov, A., King, H. F., Coppens, P., Farrugia, L. J. Acta Crystallogr. 2006, A62, 400–408; https://doi.org/10.1107/s0108767306026298.Search in Google Scholar
31. Bader, R. F. W., Bayles, D. J. Phys. Chem. 2000, A104, 5579–5589; https://doi.org/10.1021/jp9943631.Search in Google Scholar
32. Hübschle, C. B., Luger, P., Dittrich, B. J. Appl. Crystallogr. 2007, 40, 623–627.10.1107/S0021889807016524Search in Google Scholar
Supplementary Material
The online version of this article offers supplementary material (https://doi.org/10.1515/znb-2021-0178).
© 2022 Peter Luger and Birger Dittrich, published by De Gruyter, Berlin/Boston
This work is licensed under the Creative Commons Attribution 4.0 International License.
Articles in the same Issue
- Frontmatter
- In this issue
- Research Articles
- Electron density of a benzoylated tetrafructopyranose
- Die Reihe der nicht-zentrosymmetrischen tetragonalen Lanthanoid(III)-Oxidoantimonat(III)-Chloride LnSb2O4Cl (Ln = Gd–Lu)
- Iminium-substituted 2,3-dihydroisoxazoles: synthesis from acetylenic iminium salts and nitrones, and some transformations
- Reactions of 1-trifluoromethyl-prop-2-yne1-iminium salts with 2- and 3-aminopyridines
- 2,5-Dihydroxy-1,4-quinones appended with two phosphinyl groups: syntheses, structures, and redox properties
- Ordered CaCu5-type phases REPd2Zn3 (RE = Y, La–Nd, Sm, Gd–Dy)
- The solid solutions TbCuIn1–x M x (M = Al, Ga)
- Synthesis and structural characterization of a luminescent cadmium(II) complex with bis(4-(1H-imidazole-1-yl)phenyl)amine and 4,4′-sulfonyldibenzoate ligands
- Synthesis and structure of a zinc(II) coordination polymer assembled with 5-(3-carboxybenzyloxy)isophthalic acid and 1,2-bis(4-pyridyl)ethane
- Orthoamide und Iminiumsalze, CV. Umsetzungen von Orthoamiden der Alkincarbonsäuren mit Carbonsäureamiden
- Notes
- Addendum to: bixbyite-type phases in the system Ta-Zr-O-N
- Addendum to: Crystal structure of mechanochemically synthesized Ag2CdSnS4
- Addendum to: FeBiS2Cl – a new iron-containing member of the MPnQ 2 X family